BBands Stops
Indicator

BBands Stops

iBands
BBands Stops_v1
Indicator

BBands Stops_v1

iBands
BBands Stops_v2
Indicator

BBands Stops_v2

iBands
BBands Stops_v3
Indicator

BBands Stops_v3

iBands
bbands+alert
Indicator

bbands+alert

iBands
BBANDS
Indicator

BBANDS

iBands
BBandsStop
Indicator

BBandsStop

iBands

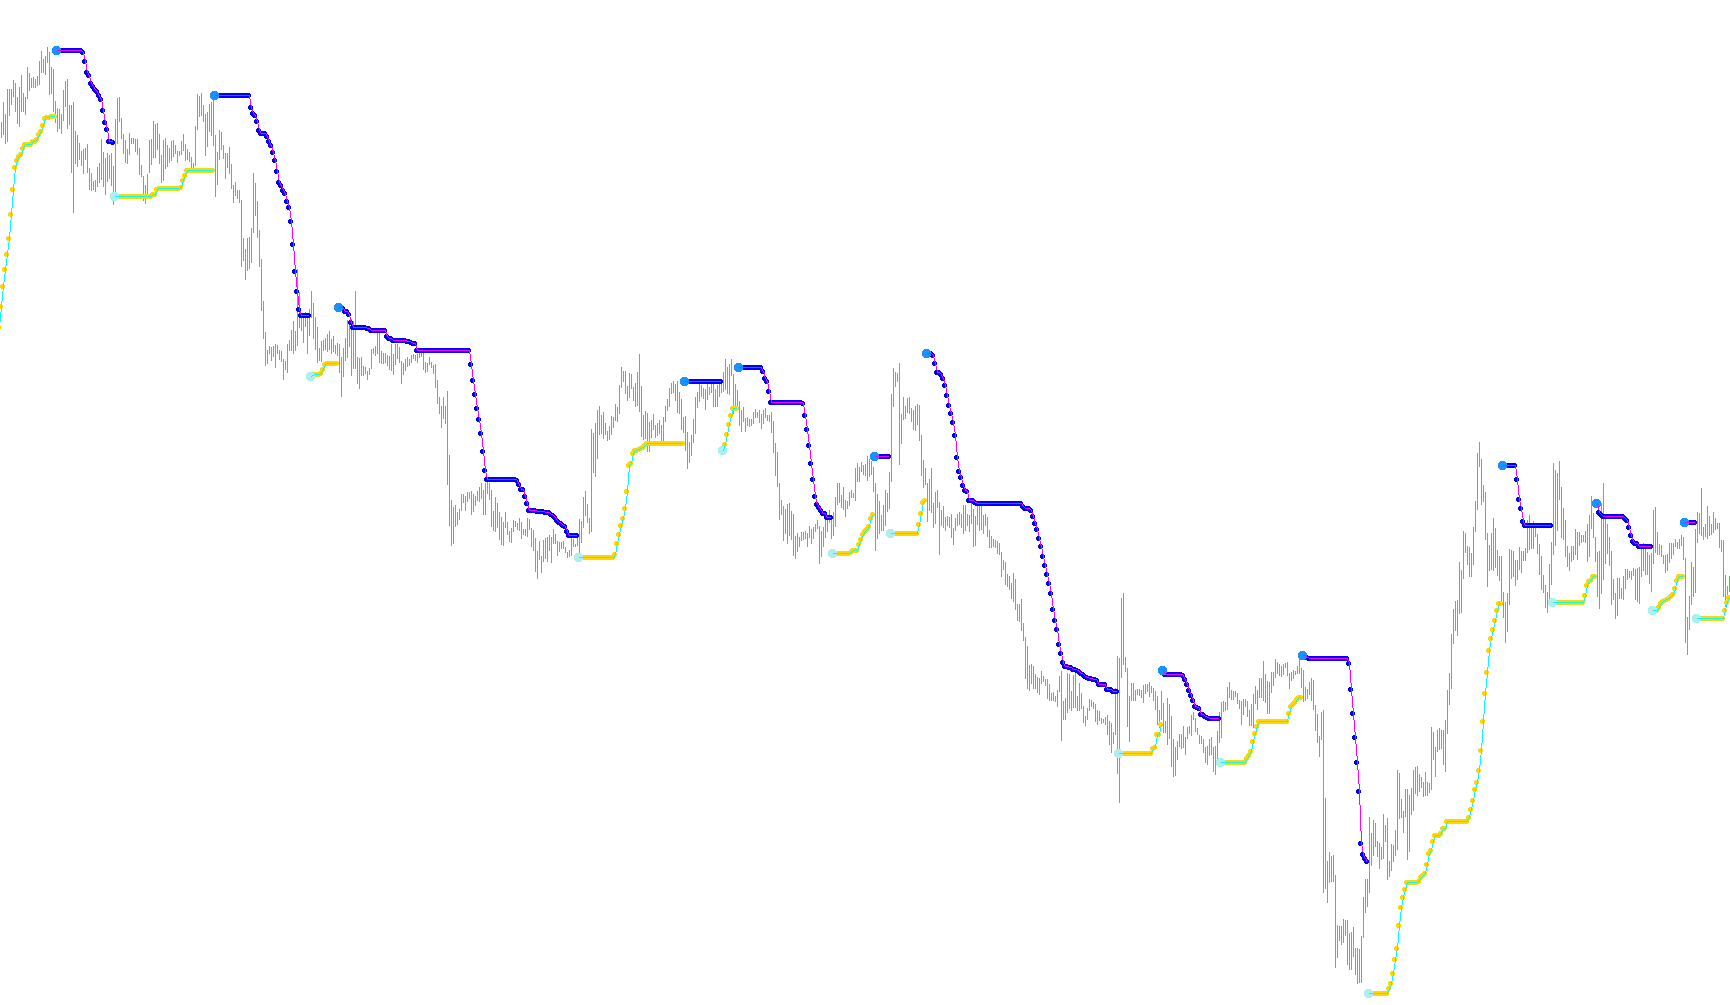
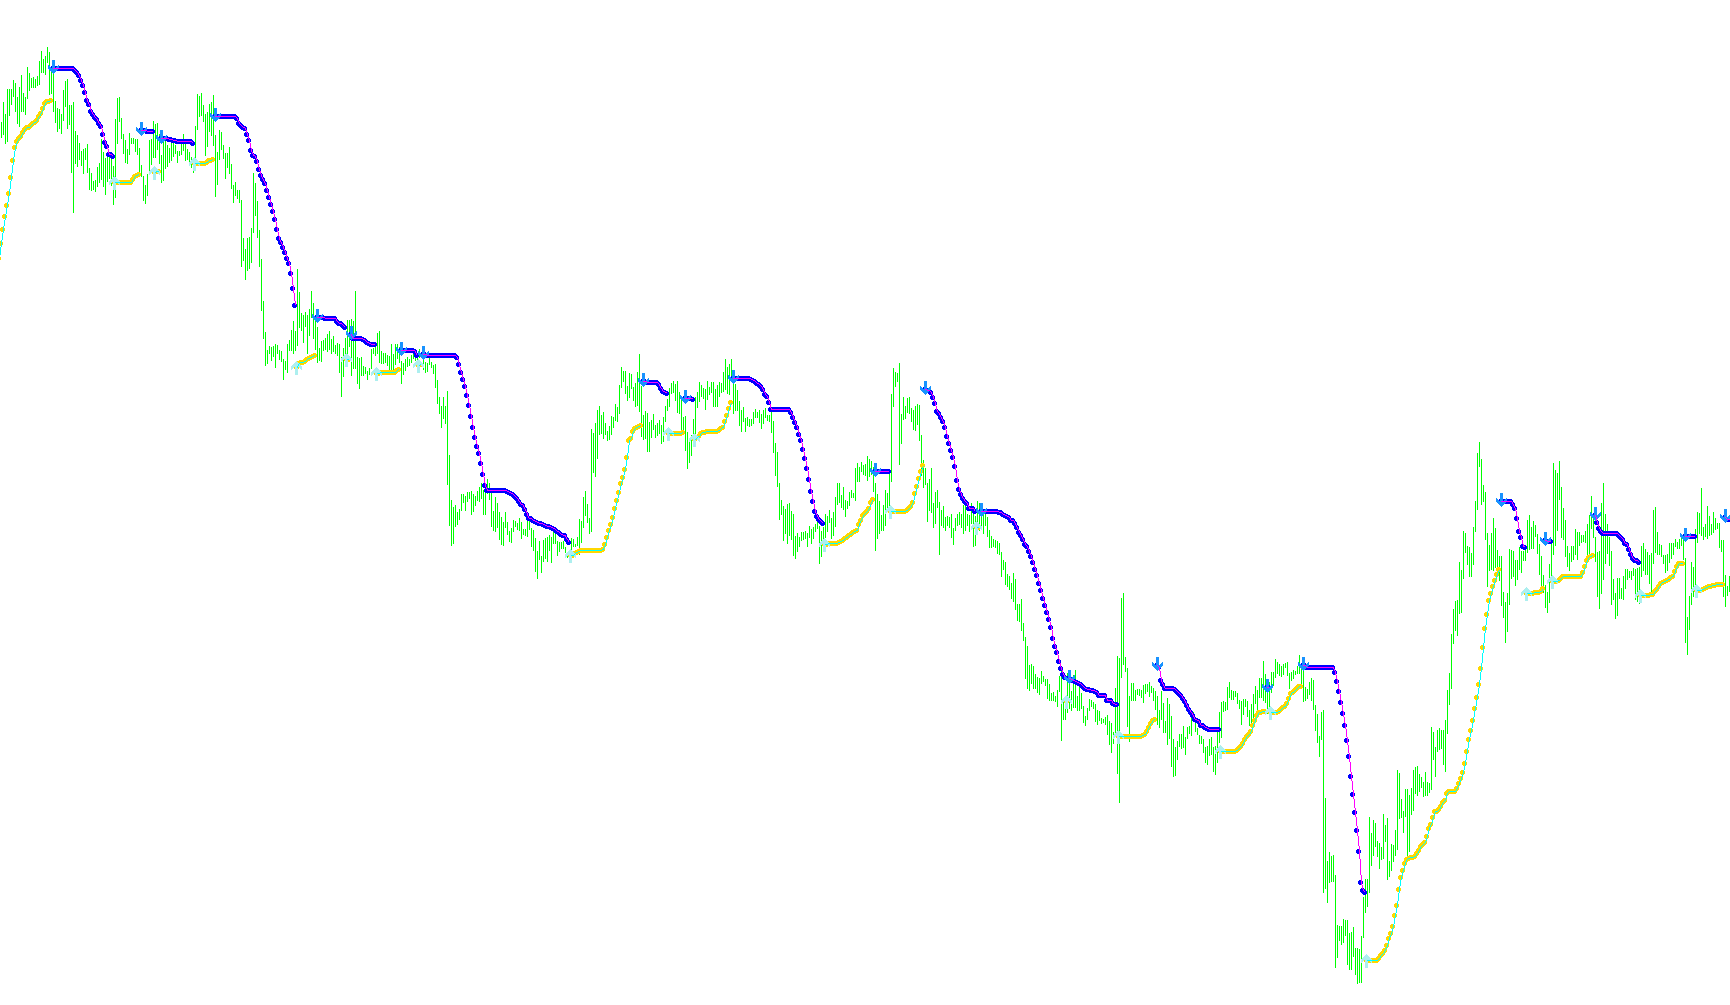
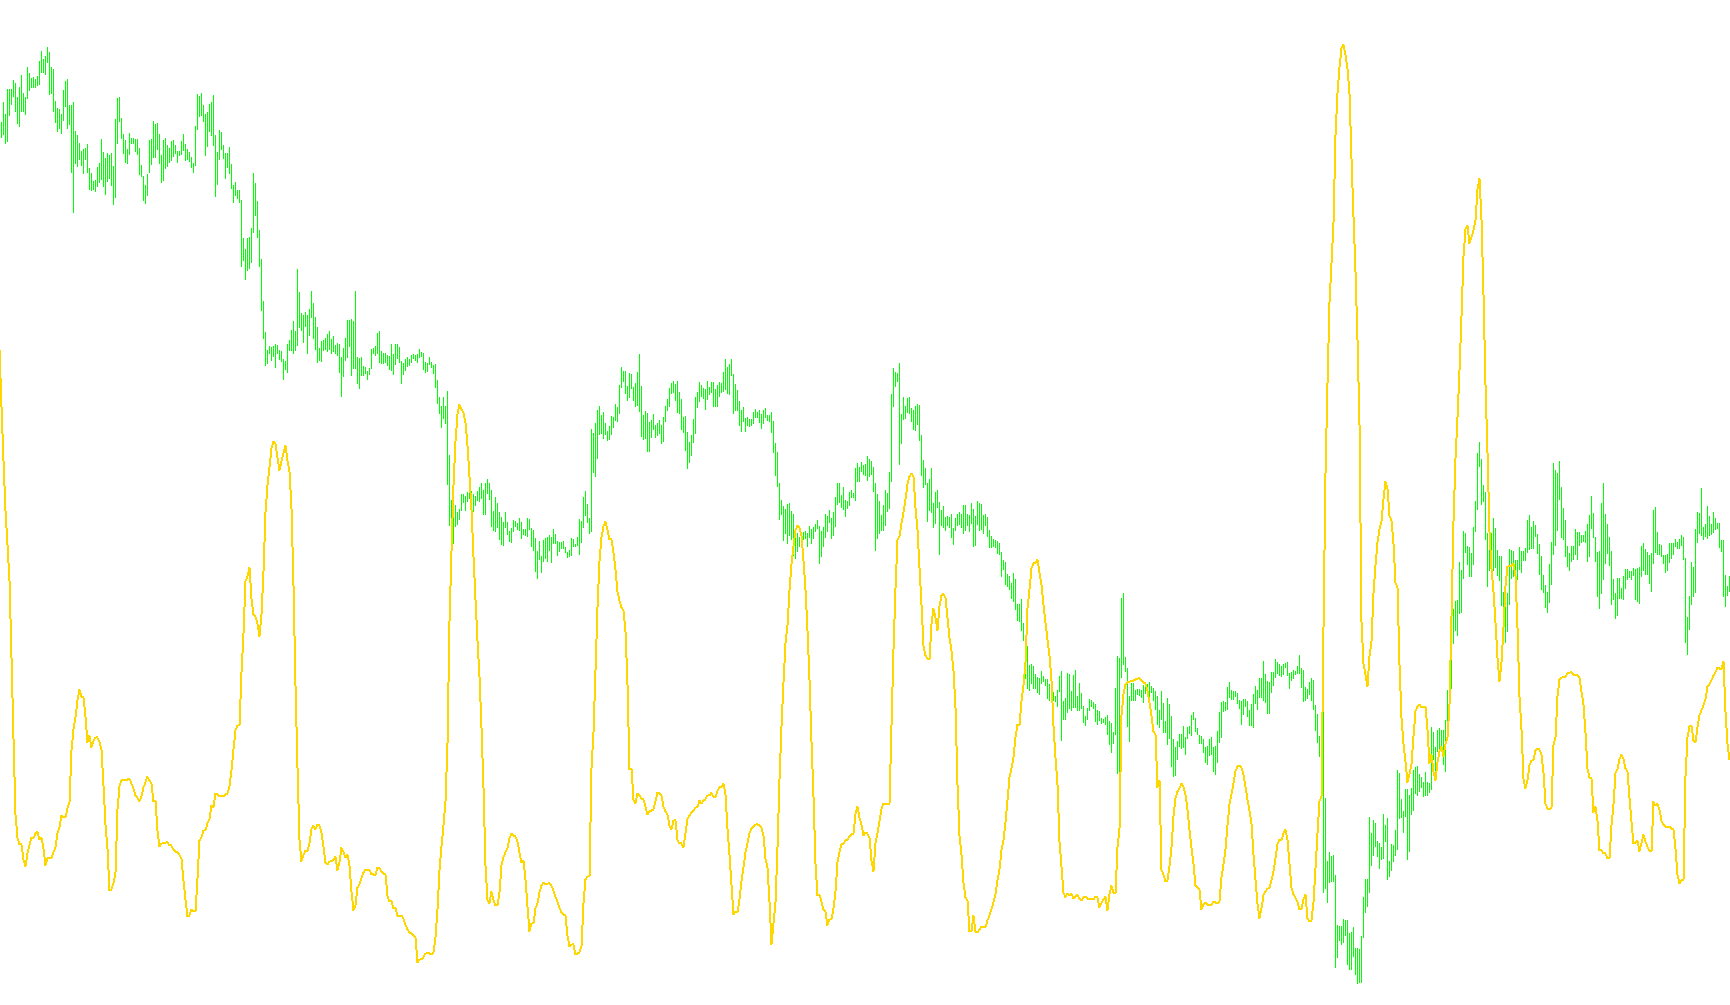
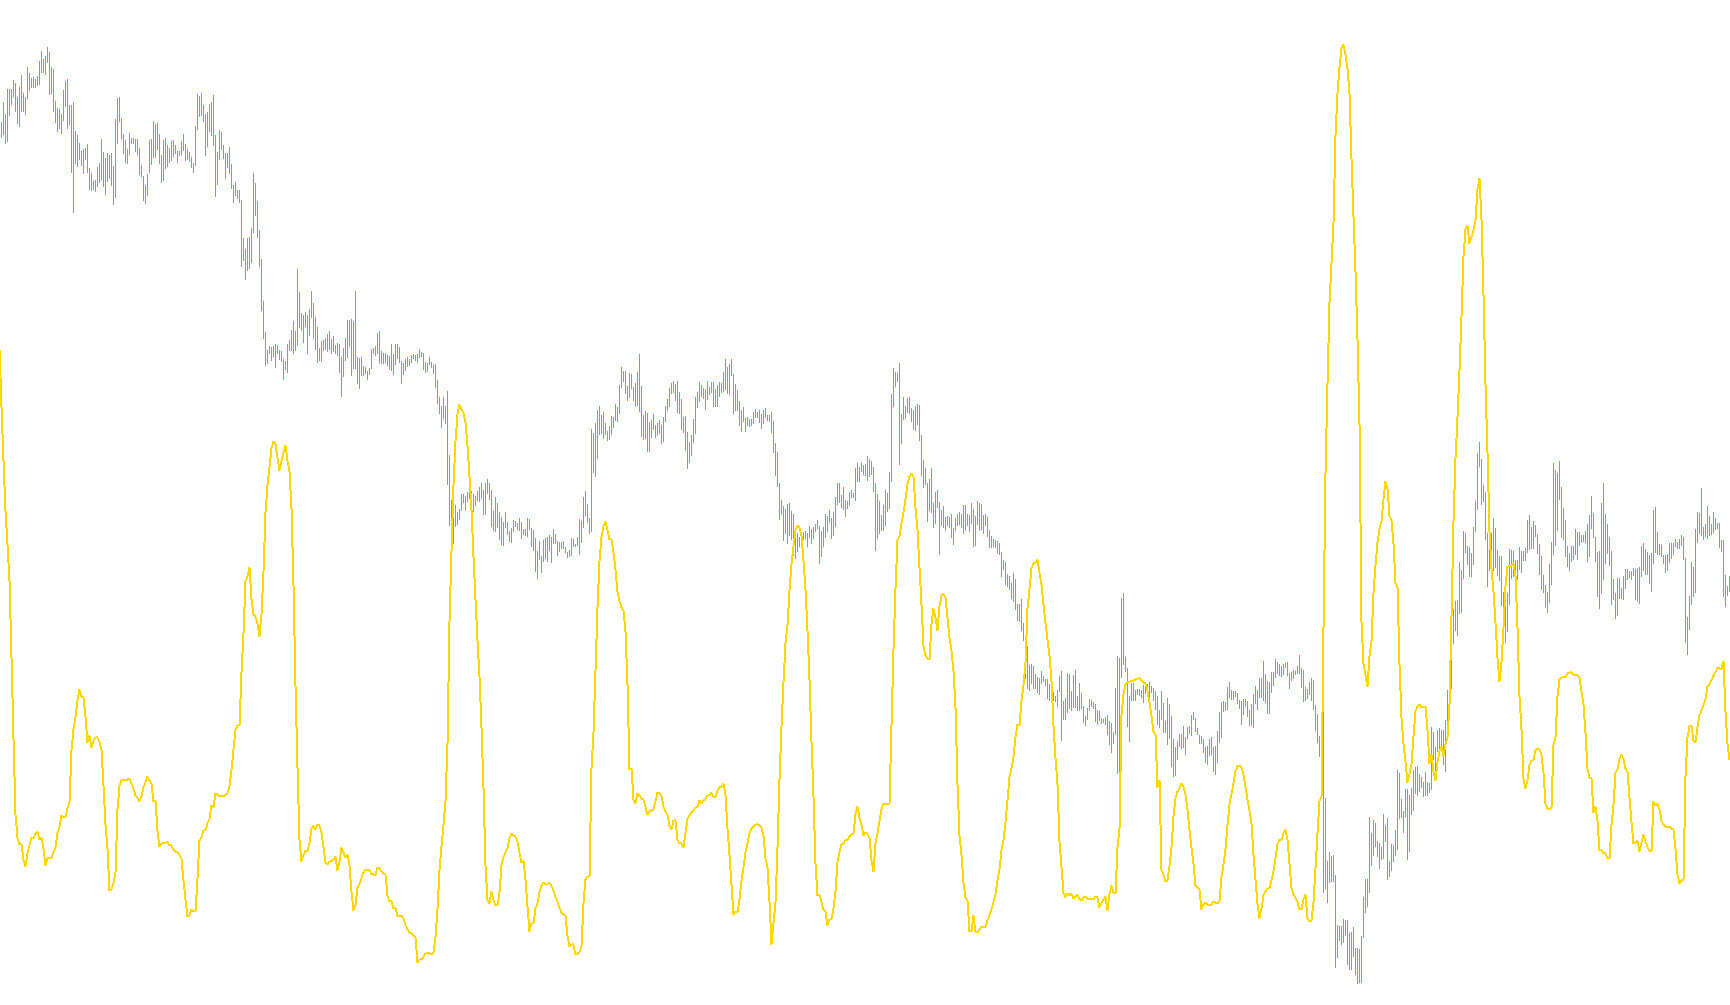
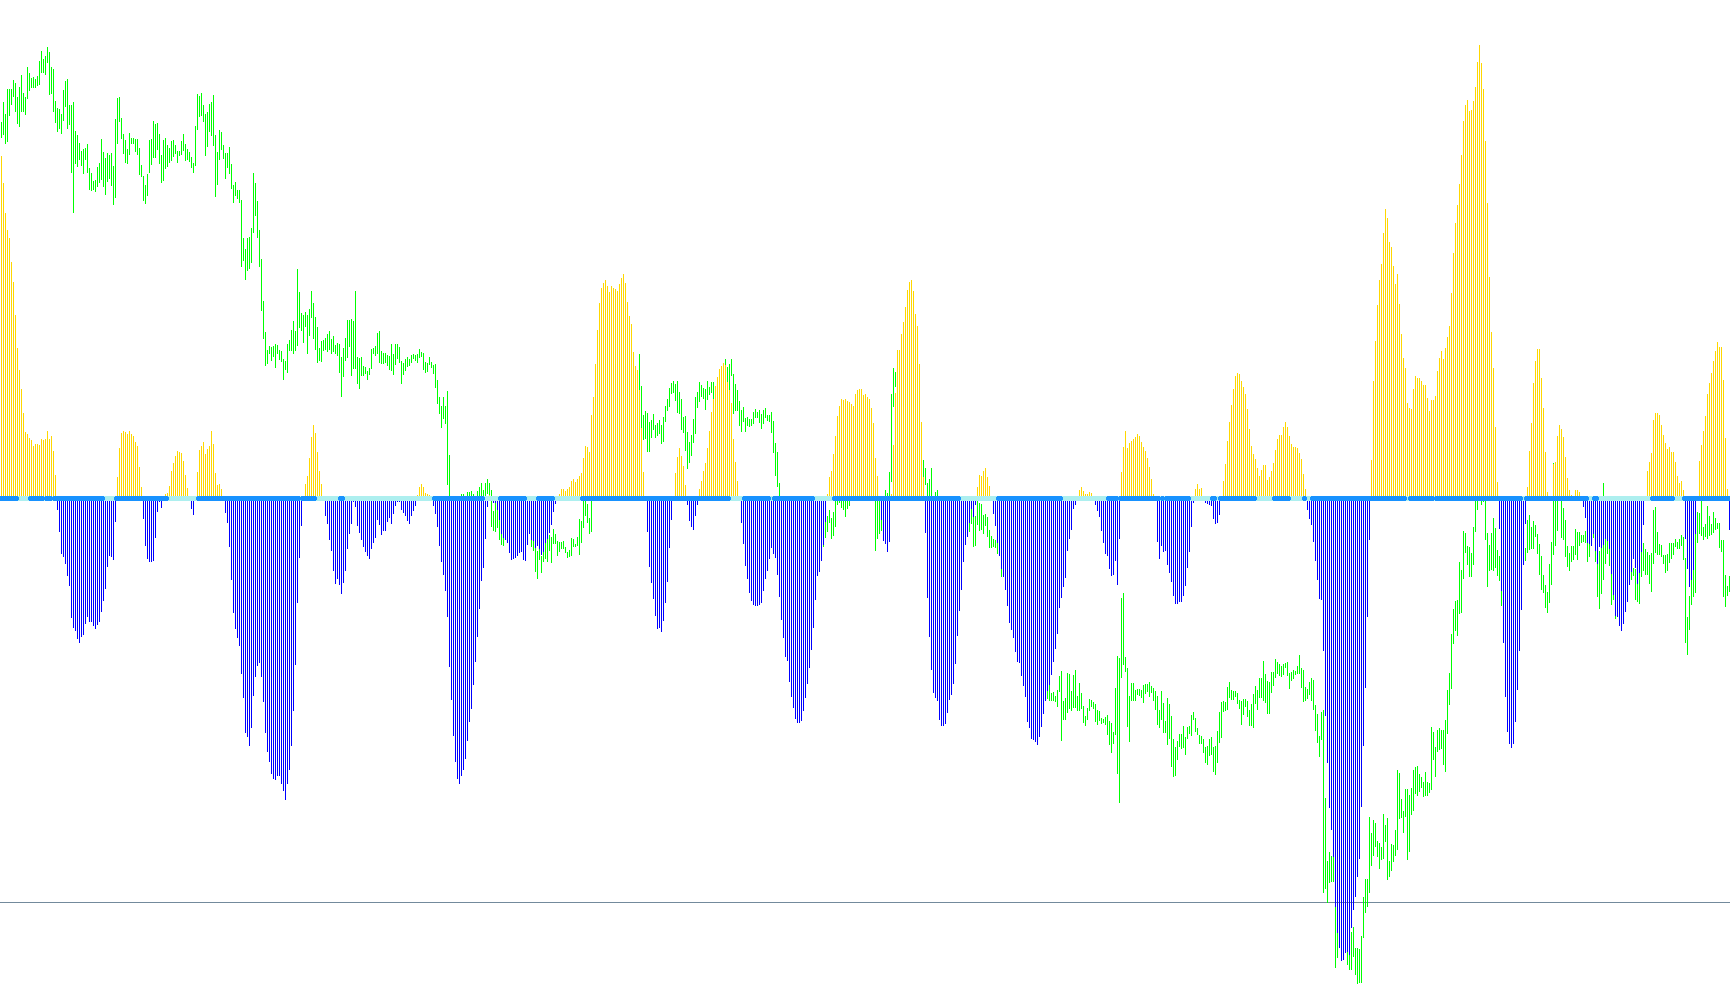
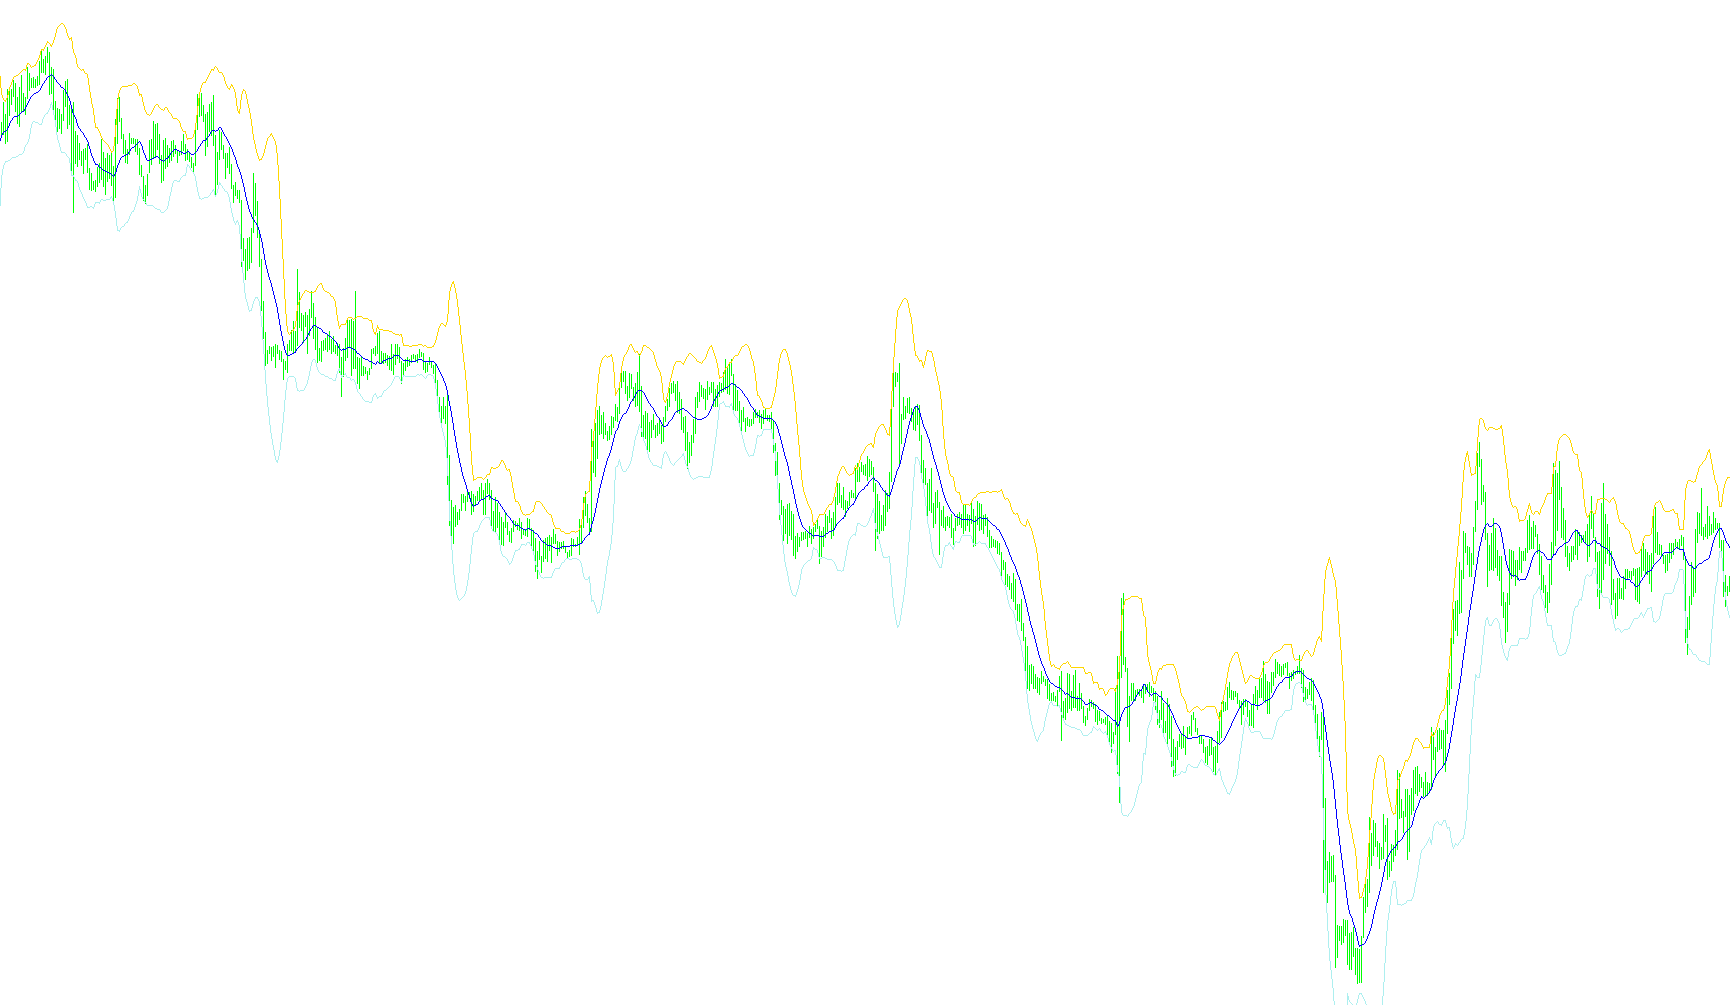
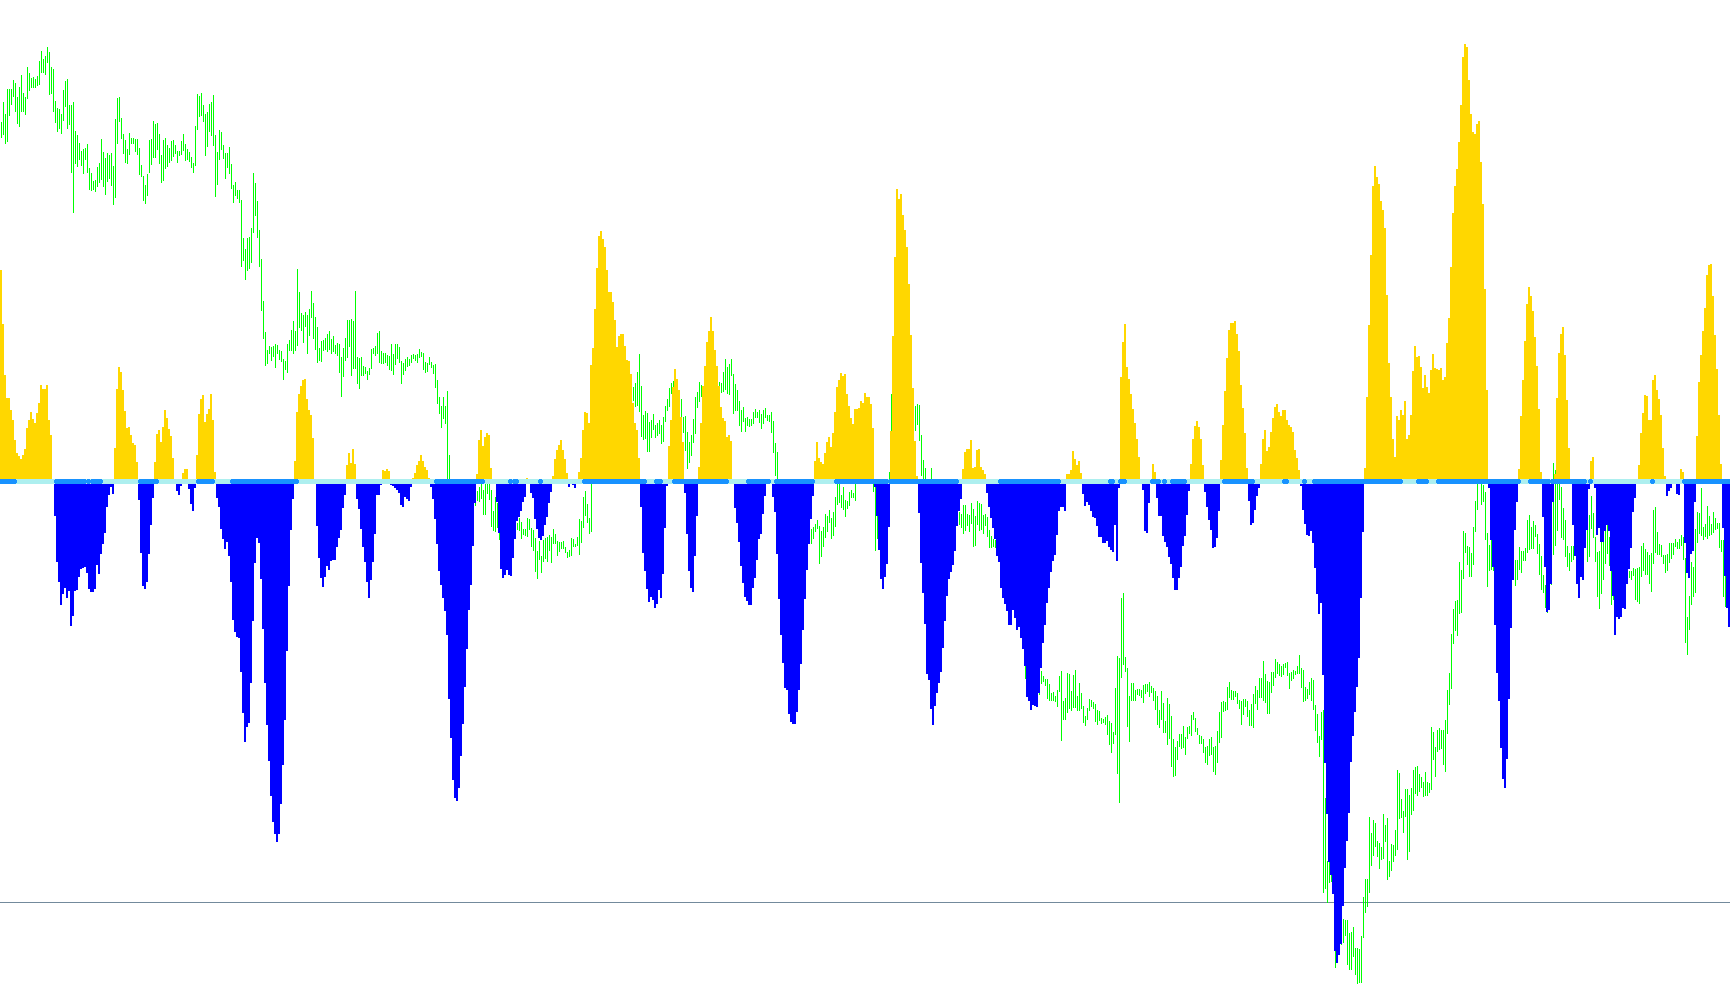
This indicator identifies trend reversals and trailing stop levels by dynamically adjusting Bollinger Band boundaries based on price breakout momentum and a customizable risk offset factor.
BBandsStopsAlert
Indicator

BBandsStopsAlert

iBands
BBands_Stops
Indicator

BBands_Stops

iBands
Indicator

BBands_StopsV1A_mtf

iBands
BBands_Stop_v1
Indicator

BBands_Stop_v1

iBands
BBands_Stop_v1_001
Indicator

BBands_Stop_v1_001

iBands
BBands_Stop_v1_003
Indicator

BBands_Stop_v1_003

iBands
BBands_Stop_v1_rdb
Indicator

BBands_Stop_v1_rdb

iBands
BBands_Stop_v1_v1
Indicator

BBands_Stop_v1_v1

iBands
BBands_Stop_v1_v2
Indicator

BBands_Stop_v1_v2

iBands
BBands_Stop_v1_v3
Indicator

BBands_Stop_v1_v3

iBands
BBands_Stop_v1_with alert
Indicator

BBands_Stop_v1_with alert

iBands

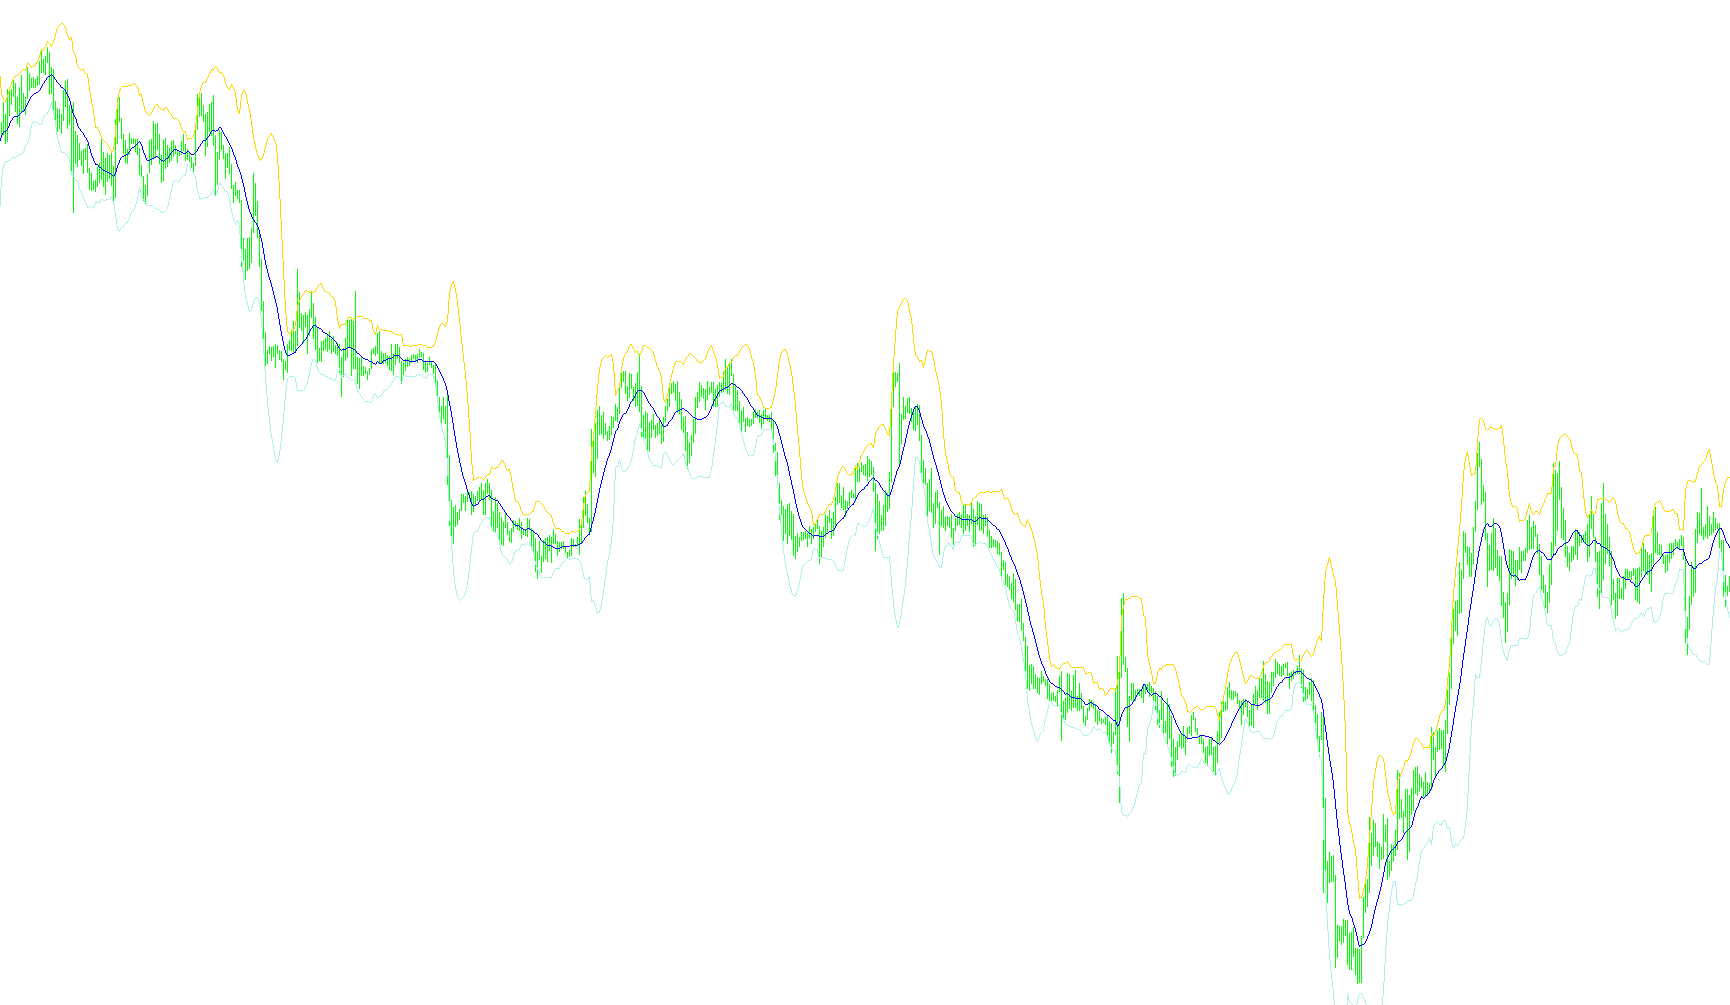
This indicator identifies trend reversals and provides dynamic trailing stop levels by tracking price breaches of Bollinger Band boundaries and adjusting the offset based on volatility risk.

BBands_Stop_v1_with_alert
Indicator

BBands_Stop_v1_with_alert

iBands
BBands_Stop_v1_with_alert_v1
Indicator

BBands_Stop_v1_with_alert_v1

iBands
BBands_Stop_v2
Indicator

BBands_Stop_v2

iBands
BBANDS~1_001
Indicator

BBANDS~1_001

iBands
BBandWidthRatio
Indicator

BBandWidthRatio

iMA

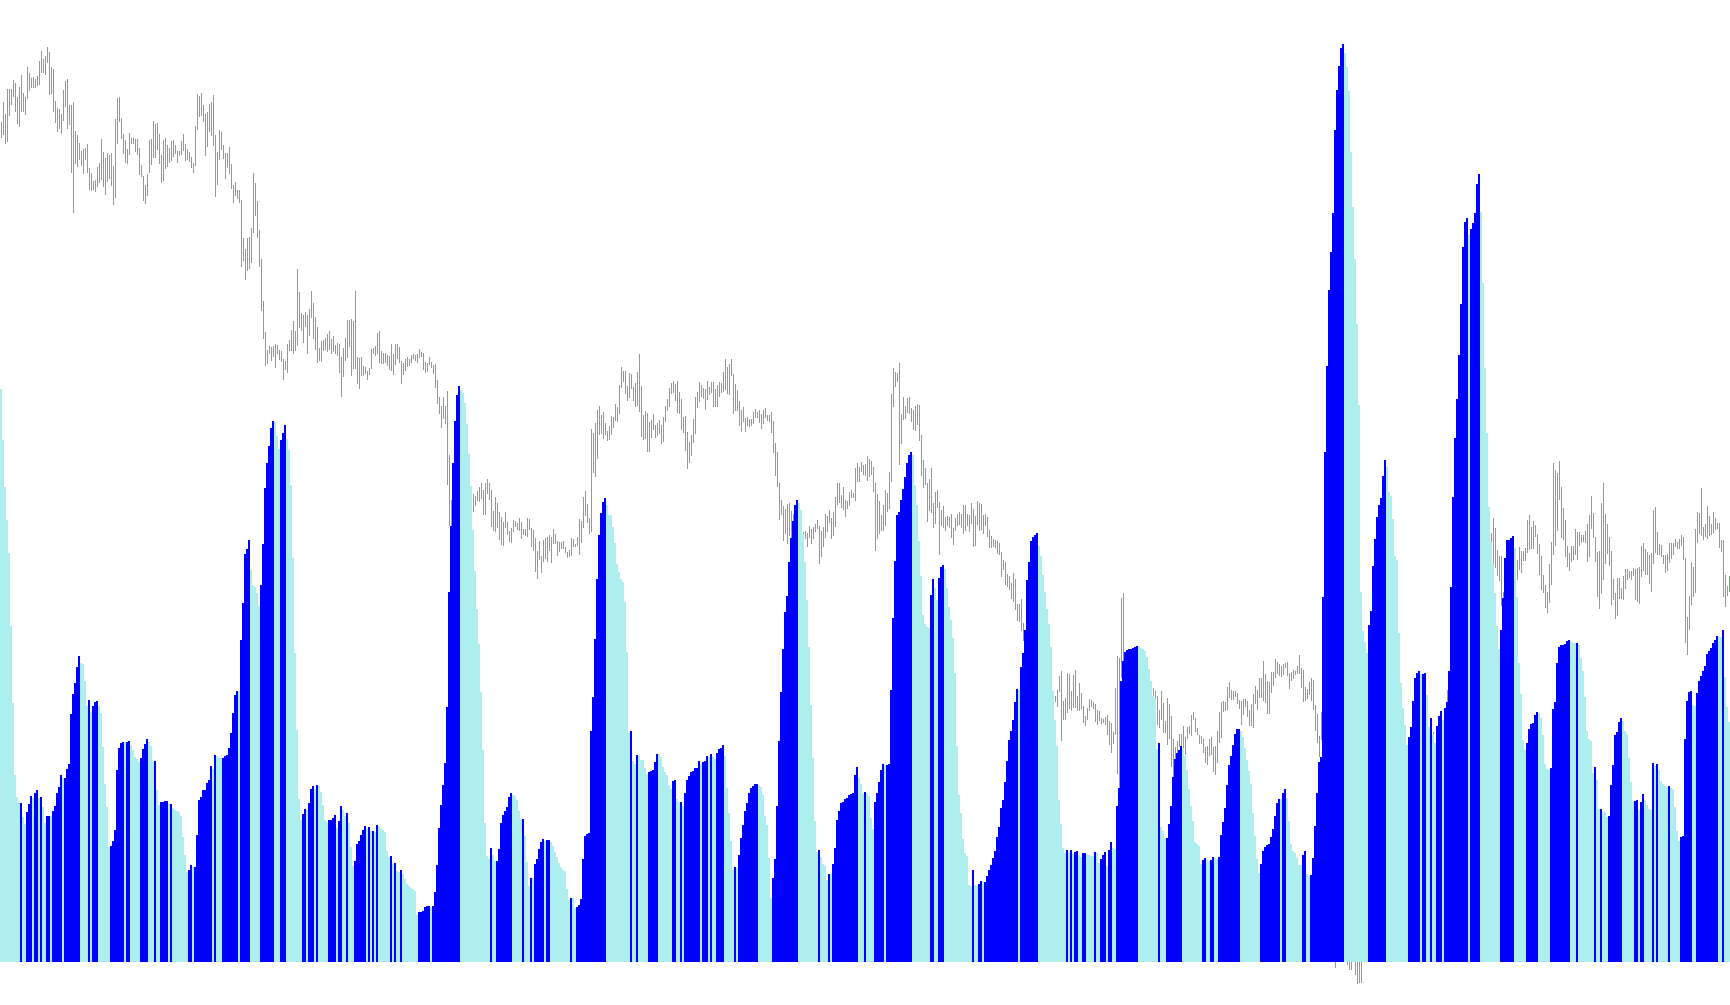
This indicator quantifies the relationship between Bollinger Band expansion and the underlying moving average to identify relative price volatility levels.

BBandWidthRatiohisto
Indicator

BBandWidthRatiohisto

iMA

This indicator quantifies market volatility by calculating the ratio between the Bollinger Band range and the current moving average price.

BBandWidthRatio_alert_v03
Indicator

BBandWidthRatio_alert_v03

iMA

Quantifies the relative expansion of Bollinger Band width against the moving average price to identify periods of extreme market stagnation.

BBandWidthRatio_v1
Indicator

BBandWidthRatio_v1

iMA

Quantifies the relative expansion of Bollinger Band width against its moving average mean to identify dynamic volatility scaling.

BBandWidthRatio_v3
Indicator

BBandWidthRatio_v3

iMA

This indicator quantifies the relative magnitude of Bollinger Band width against its moving average to identify periods of abnormal price expansion.

Indicator

BBFiboM_mtf

iMA
BBflat
Indicator

BBflat

iMAiStdDev

This indicator quantifies market volatility by mapping the standard deviation bands and calculating the real-time price distance from the moving average.

BBflat_sw
Indicator

BBflat_sw

iMAiStdDev

Quantifies the instantaneous distance between current market price and a moving average relative to dynamic standard deviation bounds.

BBflat_sw_v1
Indicator

BBflat_sw_v1

iMAiStdDev

This indicator quantifies market sentiment by visualizing the absolute distance of price action from its moving average relative to standard deviation thresholds.

BBhisto
Indicator

BBhisto

iMAiStdDev

This indicator quantifies the price's relative position within a Bollinger Band structure by calculating a normalized variance value plotted as a histogram.

bbhisto_sq
Indicator

bbhisto_sq

iATRiMAiStdDev

Identifies periods of extreme market stagnation by calculating the ratio between Bollinger Band standard deviation and ATR-based volatility to pinpoint potential breakout signals.

bbhisto_v1
Indicator

bbhisto_v1

iMAiStdDev

This indicator quantifies price volatility by normalizing the distance between the current close and the upper Bollinger Band against the standard deviation to generate a momentum-based histogram.

bbhisto_v2
Indicator

bbhisto_v2

iMAiStdDev

This indicator quantifies price displacement from the moving average relative to standard deviation, plotting a histogram to signal overextended market momentum.

BBRSI&MA_v2
Indicator

BBRSI&MA_v2

iMAiMAOnArray

This indicator synthesizes relative strength momentum with moving average smoothing and Bollinger Band envelopes to identify price trend exhaustion and volatility breakouts.

BBRSI_v1
Indicator

BBRSI_v1

iMA

This indicator synthesizes a custom Relative Strength Index calculation with Bollinger Band volatility envelopes to identify momentum exhaustion and mean reversion signals.

Indicator

bbsqueeze w Alert

iATRiMAiStdDev
bbsqueeze
Indicator

bbsqueeze

iATRiMAiStdDev

This indicator identifies high-volatility expansion phases by measuring the ratio between Bollinger Band deviation and ATR-adjusted volatility, while using linear regression slopes to determine trend direction.

bbsqueeze1
Indicator

bbsqueeze1

iATRiMAiStdDev

Identifies high-probability breakout opportunities by monitoring the ratio between linear regression slopes and volatility-adjusted standard deviations.

bbsqueeze1_v1
Indicator

bbsqueeze1_v1

iATRiMAiStdDev

This indicator identifies market compression by calculating the ratio between Bollinger Band volatility and Keltner Channel range against a linear regression trend line.

bbsqueezemodified
Indicator

bbsqueezemodified

iATRiMAiStdDev

This indicator identifies high-probability breakout points by detecting price compression through a ratio of Bollinger Band deviation to ATR volatility combined with linear regression momentum.

bbsqueeze_001
Indicator

bbsqueeze_001

iATRiMAiStdDev

This indicator identifies high-probability trend reversals by detecting periods of low volatility relative to linear regression price action.

bbsqueeze_003
Indicator

bbsqueeze_003

iATRiMAiStdDev

This indicator identifies trend momentum using a custom linear regression slope while signaling potential volatility breakouts by comparing standard deviation against ATR-based price expansion.

bbsqueeze_dark
Indicator

bbsqueeze_dark

iATRiMAiStdDev

This indicator identifies volatility compression and expansion by cross-referencing linear regression trends with a modified Bollinger Band squeeze metric.

bbsqueeze_dark_001
Indicator

bbsqueeze_dark_001

iATRiMAiStdDev

This indicator identifies trend reversals and volatility contractions by comparing linear regression slopes against a normalized standard deviation ratio.

bbsqueeze_v1
Indicator

bbsqueeze_v1

iATRiMAiStdDev

This indicator identifies potential trend breakouts by calculating the ratio between Bollinger Band standard deviation and ATR-based volatility to detect price compression.

BBStopLightv2
Indicator

BBStopLightv2

iMA

This indicator analyzes the relative expansion of Bollinger Band width against a linear weighted moving average to categorize market volatility states into actionable trading zones.

BBwithFractdev
Indicator

BBwithFractdev

iMA

This indicator calculates a Bollinger Band variant by utilizing a Fibonacci-based deviation multiplier of 2.618 to project volatility extremes.

BBwithFractdev_v1
Indicator

BBwithFractdev_v1

iMA

This indicator calculates a dynamic volatility channel by overlaying Fibonacci-based deviation multipliers onto a simple moving average to identify extreme price excursions.