BBRSI_v1
Download script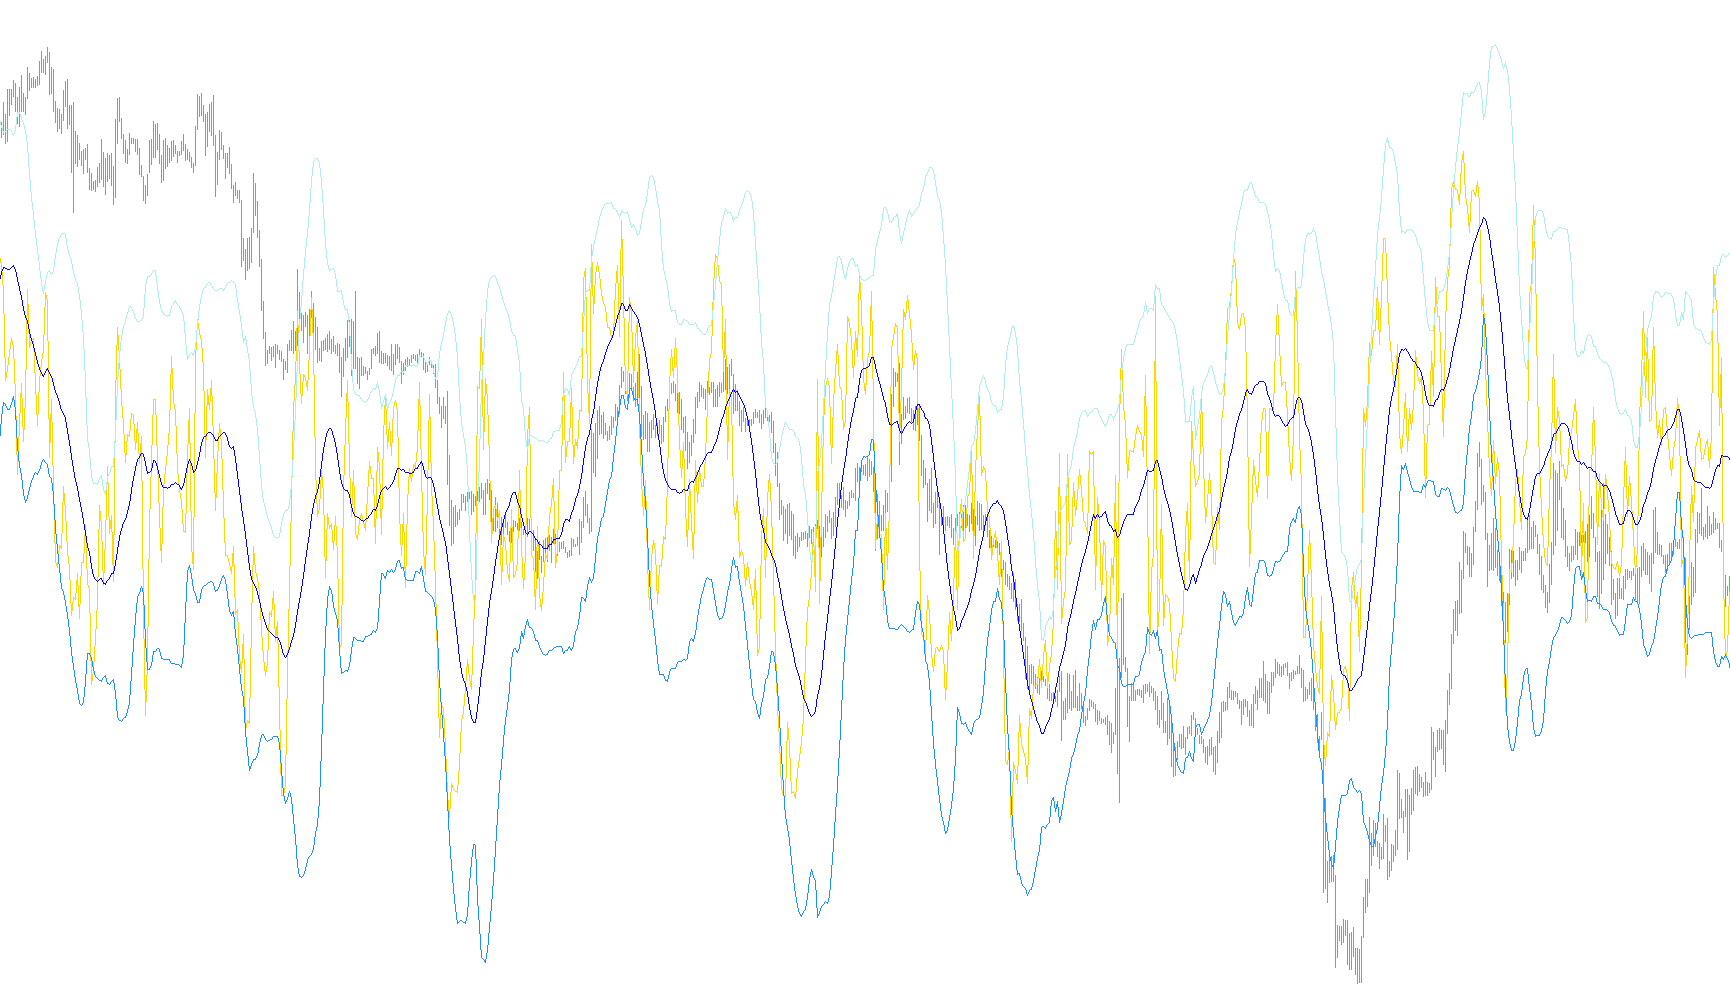
This tool is designed to analyze market momentum by combining two popular technical analysis methods into a single visual display. It creates a specialized indicator that helps traders identify whether the current price movement is gaining strength, losing steam, or becoming overextended.
Core Components of the Logic
The script functions by layering two distinct mathematical concepts:
1. Relative Strength Index (RSI) Calculation At its foundation, the tool calculates the "Relative Strength" of a market. Instead of just looking at price alone, it analyzes the difference between gains and losses over a specific period of time.
- It separates positive movements from negative movements.
- It then calculates a ratio to determine whether the buying pressure or selling pressure is dominant.
- The result is plotted as an oscillator that moves between 0 and 100, where higher values typically indicate upward momentum and lower values indicate downward momentum.
2. Bollinger Band Overlay To make the RSI data more actionable, the script applies "Bollinger Bands" directly onto the RSI line itself. In traditional trading, Bollinger Bands are used to measure volatility; here, they act as dynamic boundaries for the RSI.
- The Middle Line: Represents the average value of the RSI over a set period.
- The Upper and Lower Bands: These move automatically based on how volatile the RSI is. When the RSI stays within these bands, the trend is considered relatively stable.
How it Works Together
Rather than just seeing if an index is "high" or "low," this logic allows a user to see if the momentum is breaking out of its normal range. By watching where the RSI line sits in relation to its own Bollinger Bands, you can identify:
- Momentum Breakthroughs: When the RSI pushes outside the upper or lower bands, it suggests that the current trend is exceptionally strong (or weakening quickly).
- Mean Reversion: It helps identify points where the momentum has stretched too far from its average and may be likely to "snap back" toward the middle line.
Summary for the User
In simple terms, this script doesn't just tell you if the market is moving up or down; it tells you how aggressively it is moving compared to its own recent history. It provides a "map" of momentum where the bands represent the "normal" zone of activity, and the RSI line shows the current direction and intensity of the market's pulse.
//+------------------------------------------------------------------+
//|                                                       SMARSI.mq4 |
//|                          Typical RSI revised By TrendLaboratory  |
//|            http://finance.groups.yahoo.com/group/TrendLaboratory |
//|                                       E-mail: igorad2004@list.ru |
//+------------------------------------------------------------------+
#property copyright "Copyright © 2005, TrendLaboratory Ltd."
#property link      "http://finance.groups.yahoo.com/group/TrendLaboratory"

#property indicator_separate_window
#property indicator_minimum 0
#property indicator_maximum 100
#property indicator_level1 30
#property indicator_level2 70
#property indicator_buffers 4
#property indicator_color1 DodgerBlue
#property indicator_color2 Yellow
#property indicator_color3 Yellow
#property indicator_color4 Yellow

//---- input parameters
extern int RSIPeriod=14;
extern int BBPeriod=20;
extern int Price=0;
extern int Deviation=2;
//---- buffers
double RSIBuffer[];
double BBBuffer[];
double UpBuffer[];
double DnBuffer[];

double PosBuffer[];
double NegBuffer[];
//+------------------------------------------------------------------+
//| Custom indicator initialization function                         |
//+------------------------------------------------------------------+
int init()
  {
   string short_name;
//---- 2 additional buffers are used for counting.
   IndicatorBuffers(6);
   SetIndexBuffer(4,PosBuffer);
   SetIndexBuffer(5,NegBuffer);
//---- indicator line
   SetIndexStyle(0,DRAW_LINE);
   SetIndexBuffer(0,RSIBuffer);
   SetIndexStyle(1,DRAW_LINE);
   SetIndexBuffer(1,BBBuffer);
   SetIndexStyle(2,DRAW_LINE);
   SetIndexBuffer(2,UpBuffer);
   SetIndexStyle(3,DRAW_LINE);
   SetIndexBuffer(3,DnBuffer);


//---- name for DataWindow and indicator subwindow label
   short_name="BBRSI("+RSIPeriod+","+BBPeriod+","+Price+","+Deviation+")";
   IndicatorShortName(short_name);
   SetIndexLabel(0,short_name);
   SetIndexLabel(1,"BB mid");
   SetIndexLabel(2,"BB up");
   SetIndexLabel(3,"BB down");

//----
   SetIndexDrawBegin(0,RSIPeriod+BBPeriod);
   SetIndexDrawBegin(1,RSIPeriod+BBPeriod);
   SetIndexDrawBegin(2,RSIPeriod+BBPeriod);
   SetIndexDrawBegin(3,RSIPeriod+BBPeriod);


//----
   return(0);
  }
//+------------------------------------------------------------------+
//| BB and Relative Strength Index                                          |
//+------------------------------------------------------------------+
int start()
  {
   int    i,counted_bars=IndicatorCounted();
   double rel,negative,positive;
//----
   if(Bars<=RSIPeriod) return(0);
//---- initial zero
   if(counted_bars<1)
      for(i=1;i<=RSIPeriod;i++) RSIBuffer[Bars-i]=0.0;
//----
   i=Bars-RSIPeriod-1;
   if(counted_bars>=RSIPeriod) i=Bars-counted_bars-1;
   int MAPeriod=1;
   while(i>=0)
     {
      double sumn=0.0,sump=0.0;
      for (int k=RSIPeriod-1;k>=0;k--)
           {
            rel=iMA(NULL,0,MAPeriod,0,MODE_SMA,Price,i+k)-iMA(NULL,0,MAPeriod,0,MODE_SMA,Price,i+k+1);
            if(rel>0) sump+=rel;
            else      sumn-=rel;
           }
         positive=sump/RSIPeriod;
         negative=sumn/RSIPeriod;

      PosBuffer[i]=positive;
      NegBuffer[i]=negative;
      if(negative==0.0) RSIBuffer[i]=0.0;
      else RSIBuffer[i]=100.0-100.0/(1+positive/negative);

      i--;
     }
     int total=0;
     for (i=Bars-RSIPeriod-BBPeriod-1;i>=0;i--)
     {
     UpBuffer[i]=iBandsOnArray(RSIBuffer,total,BBPeriod,2,0,MODE_UPPER,i);
     DnBuffer[i]=iBandsOnArray(RSIBuffer,total,BBPeriod,2,0,MODE_LOWER,i);
     BBBuffer[i]=0.5*(UpBuffer[i]+DnBuffer[i]);
     }
//----
   return(0);
  }
//+------------------------------------------------------------------+
Comments