Bollinger Band Width
Indicator

Bollinger Band Width

iBands
Bollinger Bands %b
Indicator

Bollinger Bands %b

iBands
Bollinger Bands _2525b
Indicator

Bollinger Bands _2525b

iBands
Bollinger Bands
Indicator

Bollinger Bands

iMA

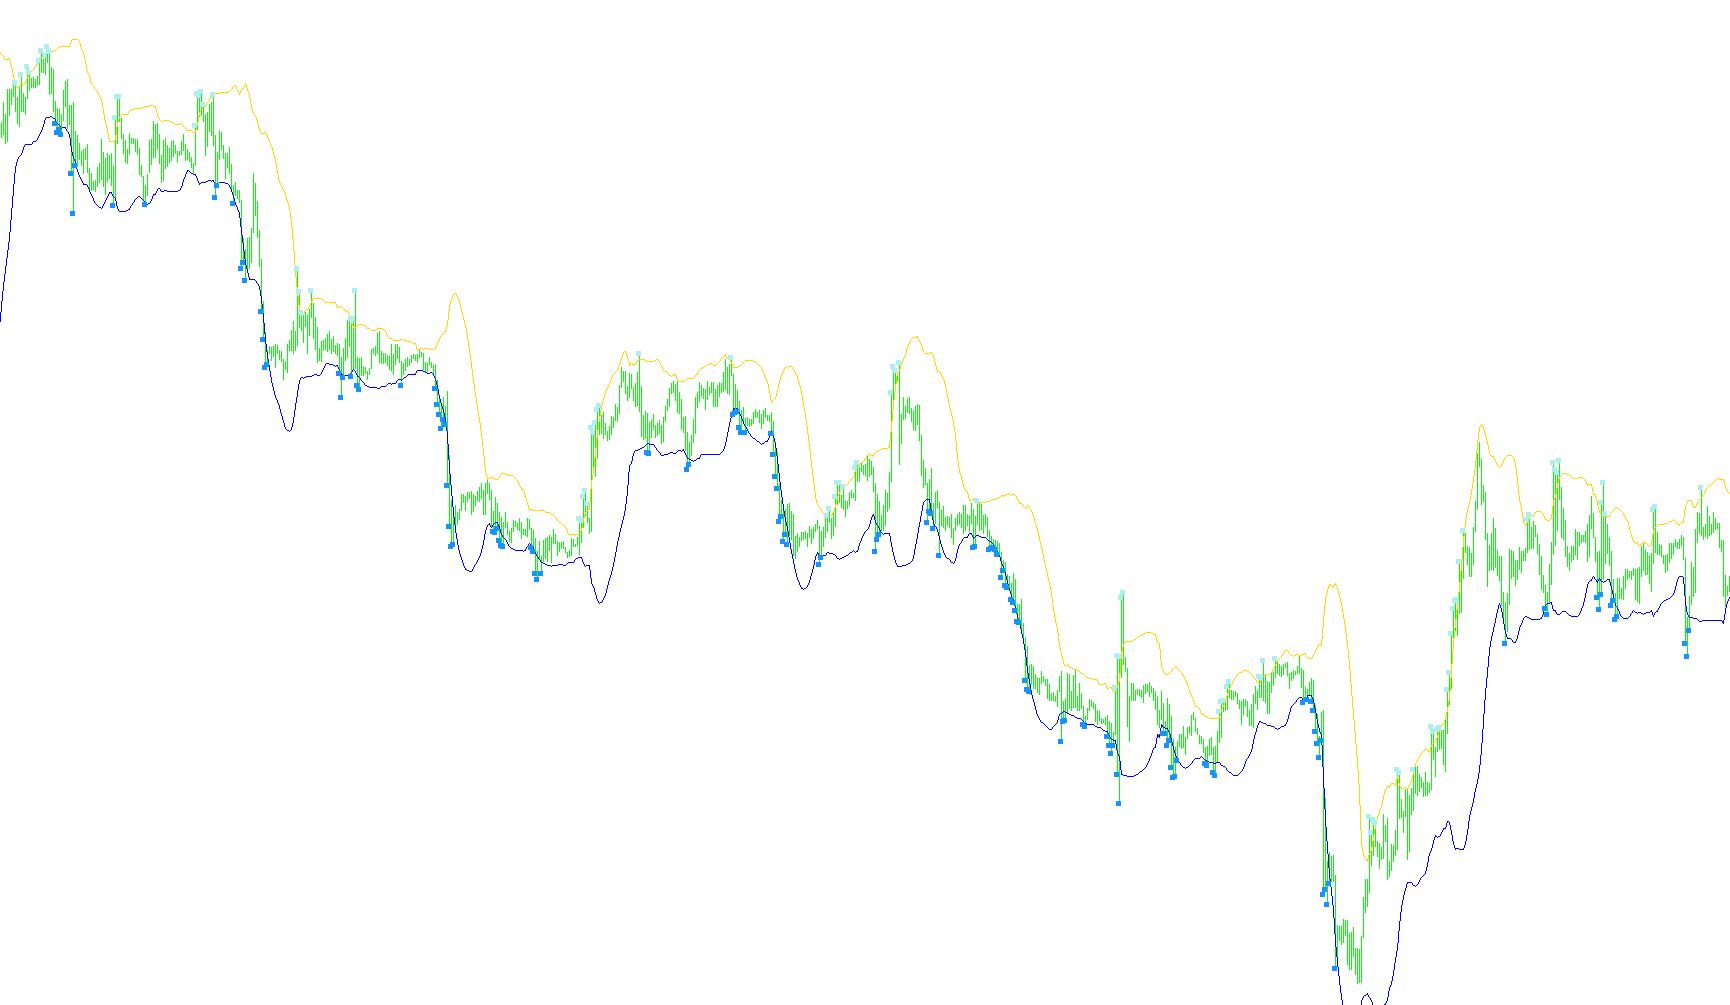
This indicator calculates a central simple moving average and plots upper and lower boundaries based on standard deviation to visualize price extremes.

Bollinger Bands_v1
Indicator

Bollinger Bands_v1

iMA

This indicator calculates a central simple moving average and maps upper and lower boundaries based on the standard deviation of price variance.

Bollinger Bands_v2
Indicator

Bollinger Bands_v2

iMA

Calculates a dynamic price corridor by mapping standard deviation offsets against a simple moving average to identify statistical extremes.

Bollinger Bandwidth
Indicator

Bollinger Bandwidth

iBandsiMA
Bollinger Squeeze Basic
Indicator

Bollinger Squeeze Basic

iATRiMomentumiStdDev

This indicator identifies market compression by comparing momentum deviations against ATR-adjusted standard deviation thresholds to detect potential explosive breakouts.

Bollinger Squeeze v3
Indicator

Bollinger Squeeze v3

iATRiMomentumiMAiStdDev

This indicator identifies market compression by calculating a volatility ratio between Standard Deviation and ATR while visualizing momentum shifts through comparative histogram bars.

Bollinger Squeeze v4
Indicator

Bollinger Squeeze v4

iATRiMAiStdDev

This indicator identifies potential volatility breakouts by measuring the ratio between Bollinger Band deviations and ATR-based fluctuations while tracking linear regression momentum shifts.

Bollinger Squeeze v4_001
Indicator

Bollinger Squeeze v4_001

iATRiMAiStdDev

This indicator identifies potential market breakouts by measuring the compression of price action using a ratio of Standard Deviation to Average True Range, overlaid with Linear Regression momentum histograms.

Bollinger Squeeze v4_v1
Indicator

Bollinger Squeeze v4_v1

iATRiMAiStdDev

This indicator identifies market compression and trend direction by calculating the ratio between standard deviation and ATR volatility while plotting a linear regression-based momentum histogram.

Indicator

Bollinger Squeeze v5

iCCIiATRiStdDev
Bollinger Squeeze v6
Indicator

Bollinger Squeeze v6

iCCIiATRiRSIiStochastic

This indicator identifies potential explosive price movements by detecting periods of low volatility relative to historical averages and filtering them against momentum oscillators like CCI, RSI, or Stochastic.

Bollinger Squeeze v7
Indicator

Bollinger Squeeze v7

iCCIiATRiRSIiStochastic

This indicator identifies high-probability breakout points by filtering momentum oscillators through a normalized ratio of standard deviation against Average True Range to detect price squeezes.

Bollinger Squeeze v8
Indicator

Bollinger Squeeze v8

iCCIiATRiRSIiStochastic

This indicator detects low-volatility environments by comparing Bollinger Band width against ATR-derived expansion to filter momentum signals from Stochastic, CCI, or RSI oscillators.

Bollinger Squeeze
Indicator

Bollinger Squeeze

iATRiMAiStdDev

This indicator identifies trend shifts by correlating Linear Regression Momentum values with an ATR-based Bollinger Band squeeze ratio to pinpoint volatility breakouts.

Bollinger_Bands_b
Indicator

Bollinger_Bands_b

iBands
Bollinger_SqueezeX
Indicator

Bollinger_SqueezeX

iATRiMAiStdDev

This indicator identifies periods of low market volatility by comparing standard deviation to ATR, while utilizing a custom linear regression formula to map price momentum trends.

BolliToucher
Indicator

BolliToucher

iBands
BolliToucher1
Indicator

BolliToucher1

iBands
BolliToucher1_v1
Indicator

BolliToucher1_v1

iBands
BolliToucher1_v2
Indicator

BolliToucher1_v2

iBands
BolliToucher_001
Indicator

BolliToucher_001

iMAiStdDev

This indicator identifies potential reversal opportunities by detecting price interaction with upper and lower Bollinger Bands using standard deviation volatility.

BolliToucher_002
Indicator

BolliToucher_002

iMAiStdDev

This indicator identifies 'Gimmee Bar' patterns based on price touching Bollinger Bands and closing in the opposite direction, marking potential entry points and triggering alerts on new bar formations when configured.

BolliToucher_003
Indicator

BolliToucher_003

iBands
BolliToucher_005
Indicator

BolliToucher_005

iBands
BolliToucher_v1
Indicator

BolliToucher_v1

iBands

This indicator identifies potential price exhaustion by detecting instances where market price interacts with Bollinger Band boundaries to signal trend reversals.

BolliToucher_v3
Indicator

BolliToucher_v3

iBands

Identifies potential trend exhaustion by detecting price breaches of the outer Bollinger Band limits followed by corrective movements.

BolliTrigger
Indicator

BolliTrigger

iBandsiMA

This indicator generates a signal line by calculating a weighted sum of Bollinger Bandwidth and a modified Percent B value to identify price momentum relative to volatility.

BollStarc-TC
Indicator

BollStarc-TC

iBandsiATRiMA

This indicator synthesizes price momentum by overlaying Keltner Channel envelopes derived from ATR and EMA with standard Bollinger Band volatility boundaries.

BollStarc-TC_Sig
Indicator

BollStarc-TC_Sig

iBandsiATRiMA

This indicator identifies high-probability trend reversals by detecting instances where price action pierces through a hybrid boundary of Bollinger Bands and STARC volatility channels.

BollStarc-TC_v1
Indicator

BollStarc-TC_v1

iBandsiATRiMA

This indicator synthesizes Bollinger Bands with Keltner-style ATR channels to provide a dual-layered visualization of market volatility and price extremes.

BollStarc-TC_v2
Indicator

BollStarc-TC_v2

iBandsiATRiMA

This indicator synchronizes Keltner Channel dynamics with Bollinger Band boundaries to provide a comprehensive visual representation of price expansion and compression.

BorChan
Indicator

BorChan

Identifies structural market pivots by locating local price extremes and determining the sequential order of fractal high-low points to establish trend directionality.

Box
Indicator

Box

This indicator projects multi-layered geometric zones and trend lines based on high/low volatility extremes to identify potential price equilibrium and structural shifts.

box10203
Indicator

box10203

This indicator maps historical price extremes and volatility zones by plotting multi-period breakout boxes based on specific session times.

Box5HML_gmt0
Indicator

Box5HML_gmt0

This indicator maps historical price extremes and median points across user-defined time windows to visualize breakout boundaries and session-based liquidity zones.

Box5HML_gmt0_AsianBreakout
Indicator

Box5HML_gmt0_AsianBreakout

Identifies historical and real-time price extremes across specific timeframes to visualize liquidity zones, session overlaps, and potential breakout levels.

Box5HML_gmt0_Trillion
Indicator

Box5HML_gmt0_Trillion

Visualizes historical and real-time price action by projecting high/low volatility zones, median levels, and open/close anchors across multi-period chronological segments.

BoxFibo
Indicator

BoxFibo

This indicator identifies specific price extremes within a predefined temporal window to generate visual boundaries and multi-level retracement zones.

Boxinglife Stochastic2
Indicator

Boxinglife Stochastic2

iStochastic

This indicator synchronizes multi-timeframe stochastic oscillators to provide visual trend momentum signals and overlay real-time velocity dynamics across diverse horizons.

BOX_5_LondonClose
Indicator

BOX_5_LondonClose

This indicator identifies historical price extremes and liquidity zones by plotting distinct high-low rectangles across predefined temporal windows, providing visual cues for breakout monitoring and median equilibrium analysis.

BO_v1
Indicator

BO_v1

iMA

The algorithm calculates the relative position of a primary smoothed average against two distinct Simple Moving Average envelopes to identify momentum shifts and trend exhaustion.

BPNN Predictor with RSI
Indicator

BPNN Predictor with RSI

iRSI

This indicator utilizes a Backpropagation Neural Network to forecast future price movements by analyzing relative RSI fluctuations across multiple Fibonacci-sequenced time delays.

BPNN Predictor with Smoothing
Indicator

BPNN Predictor with Smoothing

iMA

Utilizes a Backpropagation Neural Network (BPNN) to forecast price trajectories by processing smoothed EMA data through multi-layered neurons using Fibonacci-sequence temporal delays.

BPNN Predictor
Indicator

BPNN Predictor

This indicator utilizes a multi-layer backpropagation neural network to forecast future price points by analyzing historical volatility through Fibonacci-sequenced temporal delays.

BPS Support and Resistance 2
Indicator

BPS Support and Resistance 2

This indicator identifies significant price reversal zones by detecting local highs and lows that exceed the peak values of neighboring bars within a defined lookback window.

Indicator

BrainTrend1

iATRiStochastic
Indicator

BrainTrend1Sig write global

iATRiStochastic