bbsqueeze_dark_001
Download script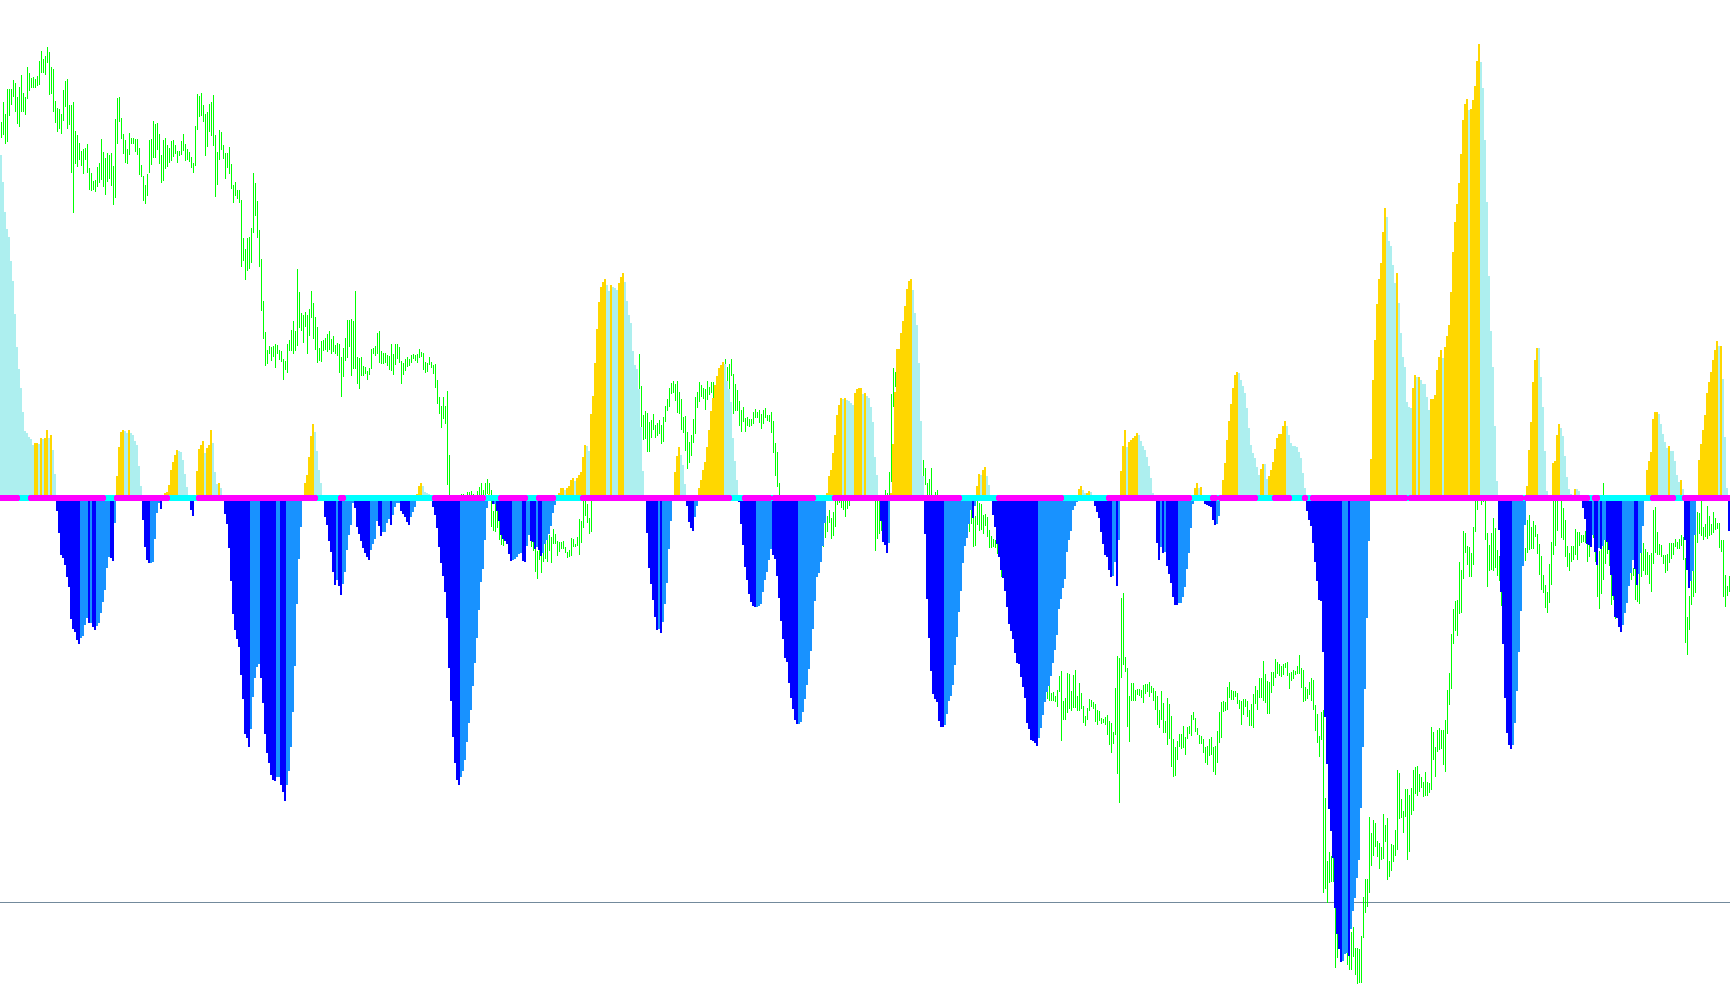
This script is designed to analyze market trends by identifying specific price movements and "squeezes"—periods where market volatility becomes unusually low, often preceding a significant breakout. It combines statistical trend analysis with volatility measurements to provide visual cues on the chart.
Core Logic Overview
The tool operates using three primary logical components:
1. Trend Direction & Momentum Tracking The script calculates a specialized "Linear Regression" value. Unlike a simple moving average, this looks at the relationship between the high and low prices of past candles relative to their closing prices.
- It identifies whether the current trend is moving upward or downward.
- It monitors the velocity of these movements. If the momentum is increasing (getting stronger) or decreasing (weakening), it categorizes these changes into different visual "bins." This allows a user to see not just where the price is going, but whether the strength of that move is currently accelerating or decelerating.
2. Volatility and the "Squeeze" Detection A major feature of this script is its ability to detect a "squeeze." It does this by comparing two different types of market variance:
- It measures the current Standard Deviation (the typical spread of price action).
- It measures the Average True Range (ATR), which represents recent volatility.
- By dividing these values against a specific factor, the script calculates a "Bollinger Squeeze" value. When this value falls below a certain threshold, it indicates that the market is becoming abnormally quiet or compressed.
3. Visual Signals The script translates the data above into three distinct types of visual information:
- Histograms: These show the current trend direction and the strength/momentum of that trend. They change style depending on whether the price action is gaining or losing steam.
- Breakout Alerts: When the "Squeeze" logic detects that volatility has reached an extreme low point, the script generates specific icons (arrows). These act as a warning that the market is "coiled" and may be about to explode in one direction or another shortly.
Summary for the User
In plain terms, this tool acts as a filter for noise. It looks for moments where the market is moving with a clear direction but very little "shaking" (volatility). By highlighting these periods of compression and showing the momentum behind the trend, it helps traders identify potential high-impact moves before they fully unfold.
//+------------------------------------------------------------------+
//|                                                    bbsqueeze.mq4 |
//|                Copyright © 2005, Nick Bilak, beluck[AT]gmail.com |
//|           enhanced a little bit by CJ Rivas, carlos[AT]vealo.com |
//+------------------------------------------------------------------+
#property copyright "Copyright © 2005, Nick Bilak"
#property link      "http://metatrader.50webs.com/"

#property indicator_separate_window
#property indicator_buffers 6
#property indicator_color1 Blue
#property indicator_color2 Red
#property indicator_color3 DarkBlue
#property indicator_color4 Maroon
#property indicator_color5 Blue
#property indicator_color6 Lime

//---- input parameters
extern int       bolPrd=20;
extern double    bolDev=2.0;
extern int       keltPrd=20;
extern double    keltFactor=1.5;
extern int       momPrd=12;
//---- buffers
double upB[];
double upB2[];
double loB[];
double loB2[];
double upK[];
double loK[];

int i,j,slippage=3;
double breakpoint=0.0;
double ema=0.0;
int peakf=0;
int peaks=0;
int valleyf=0;
int valleys=0, limit=0;
double ccis[61],ccif[61];
double delta=0;
double ugol=0;
//+------------------------------------------------------------------+
//| Custom indicator initialization function                         |
//+------------------------------------------------------------------+
int init()
  {
//---- indicators
   SetIndexStyle(0,DRAW_HISTOGRAM,EMPTY,3);
   SetIndexBuffer(0,upB);
   SetIndexEmptyValue(0,EMPTY_VALUE);

   SetIndexStyle(1,DRAW_HISTOGRAM,EMPTY,3);
   SetIndexBuffer(1,loB);
   SetIndexEmptyValue(1,EMPTY_VALUE);

   SetIndexStyle(4,DRAW_ARROW,EMPTY,2);
   SetIndexBuffer(4,upK);
   SetIndexEmptyValue(4,EMPTY_VALUE);
   SetIndexArrow(4,159);
   SetIndexStyle(5,DRAW_ARROW,EMPTY,2);
   SetIndexBuffer(5,loK);
   SetIndexEmptyValue(5,EMPTY_VALUE);
   SetIndexArrow(5,159);

   SetIndexStyle(2,DRAW_HISTOGRAM,EMPTY,3);
   SetIndexEmptyValue(2,EMPTY_VALUE);
   SetIndexBuffer(2,upB2);

   SetIndexStyle(3,DRAW_HISTOGRAM,EMPTY,3);
   SetIndexEmptyValue(3,EMPTY_VALUE);
   SetIndexBuffer(3,loB2);


//----
   return(0);
  }
//+------------------------------------------------------------------+
//| Custor indicator deinitialization function                       |
//+------------------------------------------------------------------+
int deinit()
  {
//----

//----
   return(0);
  }
//+------------------------------------------------------------------+
//| Custom indicator iteration function                              |
//+------------------------------------------------------------------+
int start()
  {
   int counted_bars=IndicatorCounted();
   int shift,limit;
   double diff,d,dPrev, std,bbs;

   if (counted_bars<0) return(-1);
   if (counted_bars>0) counted_bars--;
   limit=Bars-31;
   if(counted_bars>=31) limit=Bars-counted_bars-1;

   for (shift=limit;shift>=0;shift--)   {
      //d=iMomentum(NULL,0,momPrd,PRICE_CLOSE,shift);
      d=LinearRegressionValue(bolPrd,shift);
      dPrev=LinearRegressionValue(bolPrd,shift+1);
      if(d>0) {
         if ((dPrev>0) && (dPrev > d)){ upB2[shift]=d; upB[shift] = 0; } else { upB[shift]= d; upB2[shift] = 0; }
         //upB[shift]=0;
         loB[shift]=0;
         loB2[shift]=0;
      } else {
         if ((dPrev<0) && (dPrev < d)){ loB2[shift]=d; loB[shift] = 0; } else { loB[shift]= d; loB2[shift] = 0; }
         upB[shift]=0;
         upB2[shift]=0;
         //loB[shift]=d;
      }
		diff = iATR(NULL,0,keltPrd,shift)*keltFactor;
		std = iStdDev(NULL,0,bolPrd,MODE_SMA,0,PRICE_CLOSE,shift);
		bbs = bolDev * std / diff;
      if(bbs<1) {
         upK[shift]=0;
         loK[shift]=EMPTY_VALUE;
      } else {
         loK[shift]=0;
         upK[shift]=EMPTY_VALUE;
      }
   }
   return(0);
  }
//+------------------------------------------------------------------+


double LinearRegressionValue(int Len,int shift) {
   double SumBars = 0;
   double SumSqrBars = 0;
   double SumY = 0;
   double Sum1 = 0;
   double Sum2 = 0;
   double Slope = 0;

   SumBars = Len * (Len-1) * 0.5;
   SumSqrBars = (Len - 1) * Len * (2 * Len - 1)/6;

  for (int x=0; x<=Len-1;x++) {
   double HH = Low[x+shift];
   double LL = High[x+shift];
   for (int y=x; y<=(x+Len)-1; y++) {
     HH = MathMax(HH, High[y+shift]);
     LL = MathMin(LL, Low[y+shift]);
   }
    Sum1 += x* (Close[x+shift]-((HH+LL)/2 + iMA(NULL,0,Len,0,MODE_EMA,PRICE_CLOSE,x+shift))/2);
    SumY += (Close[x+shift]-((HH+LL)/2 + iMA(NULL,0,Len,0,MODE_EMA,PRICE_CLOSE,x+shift))/2);
  }
  Sum2 = SumBars * SumY;
  double Num1 = Len * Sum1 - Sum2;
  double Num2 = SumBars * SumBars-Len * SumSqrBars;

  if (Num2 != 0.0)  {
    Slope = Num1/Num2;
  } else {
    Slope = 0;
  }

  double Intercept = (SumY - Slope*SumBars) /Len;
  double LinearRegValue = Intercept+Slope * (Len - 1);

  return (LinearRegValue);

}
Comments