BBwithFractdev_v2
Indicator

BBwithFractdev_v2

iMA

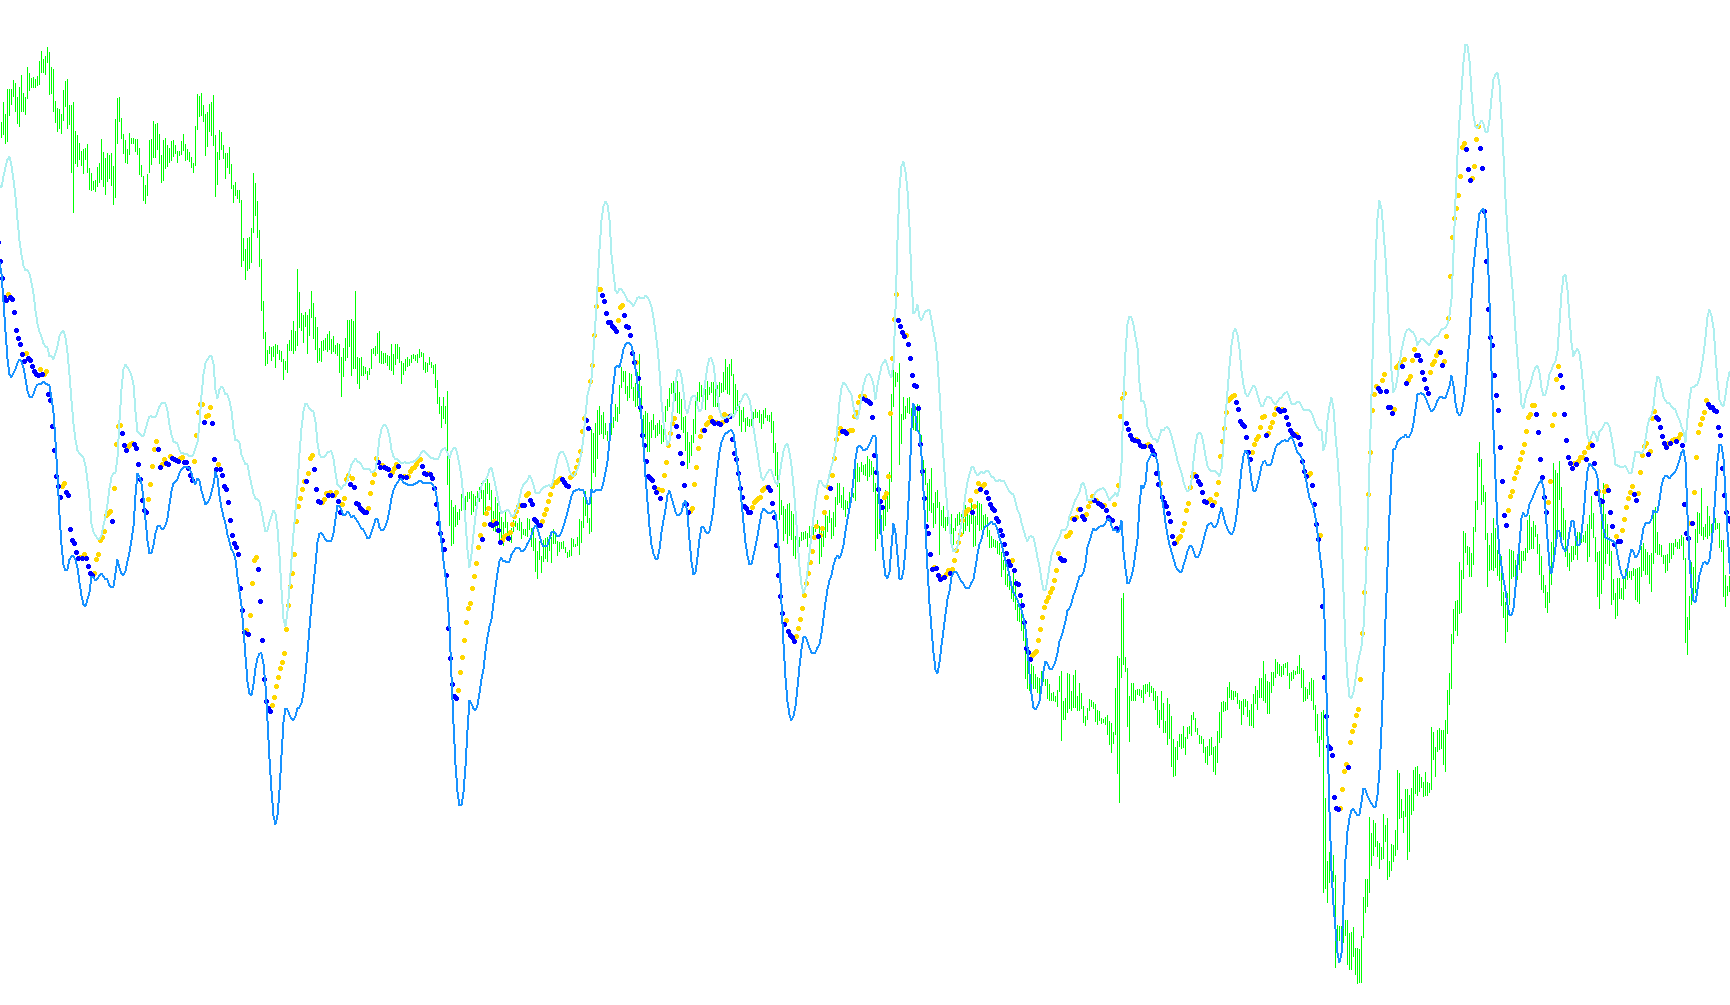
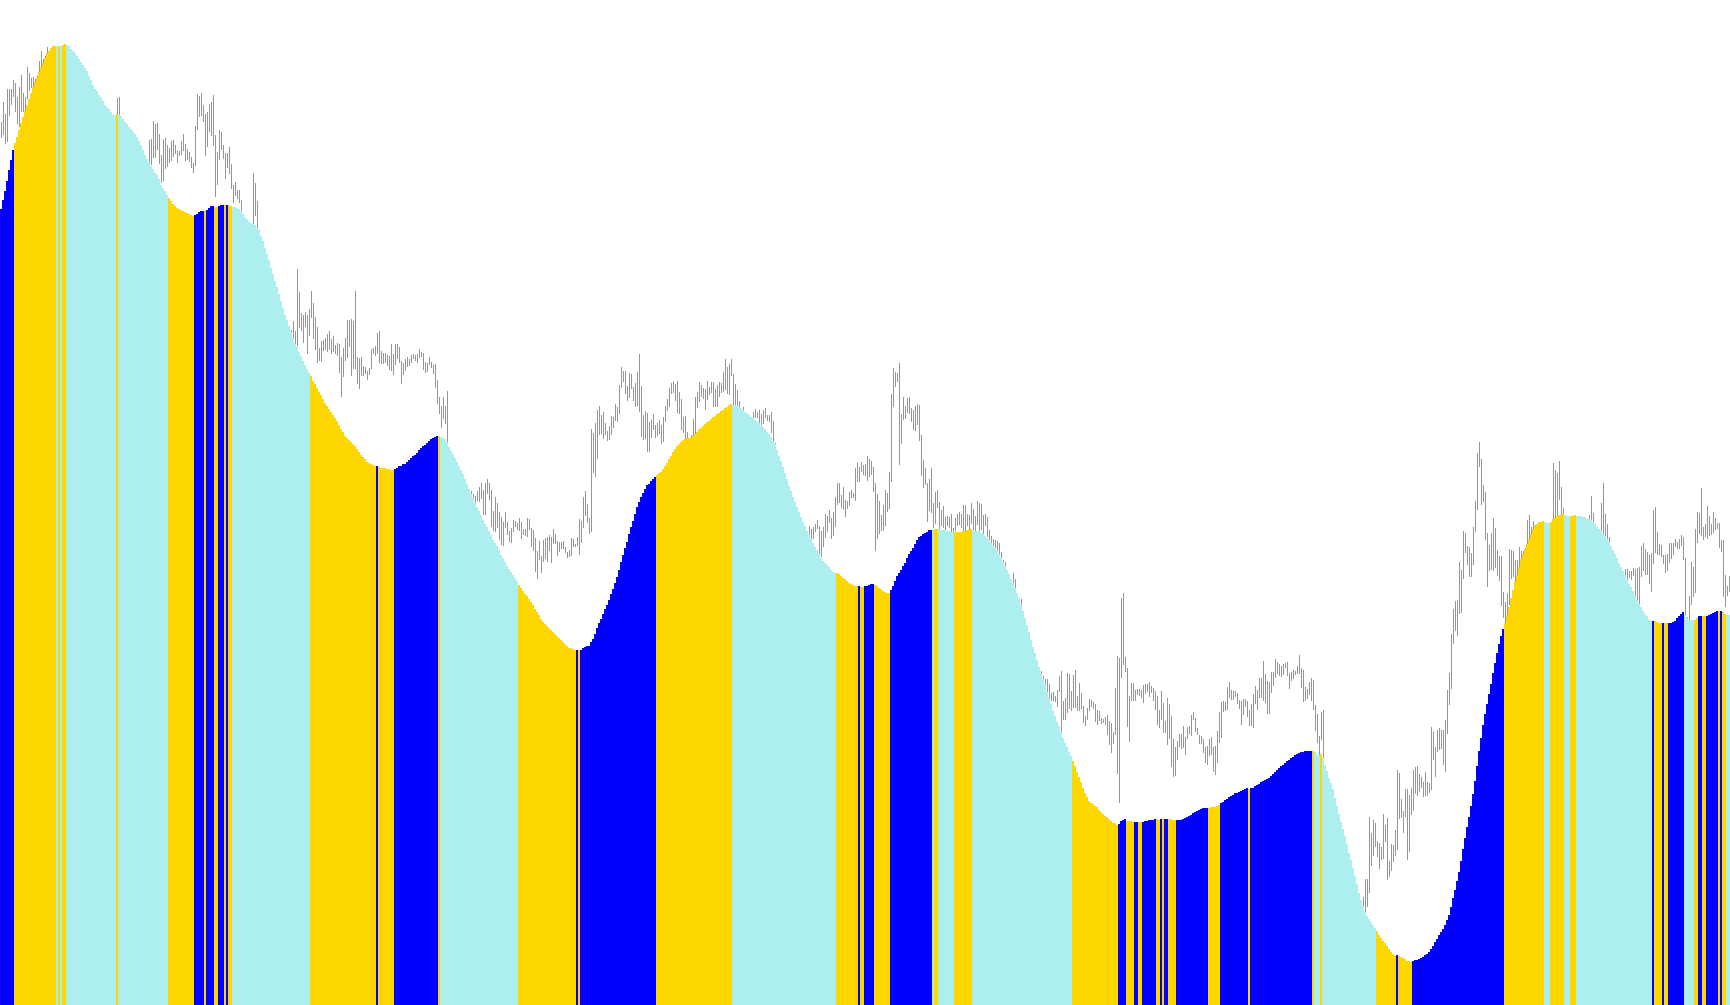
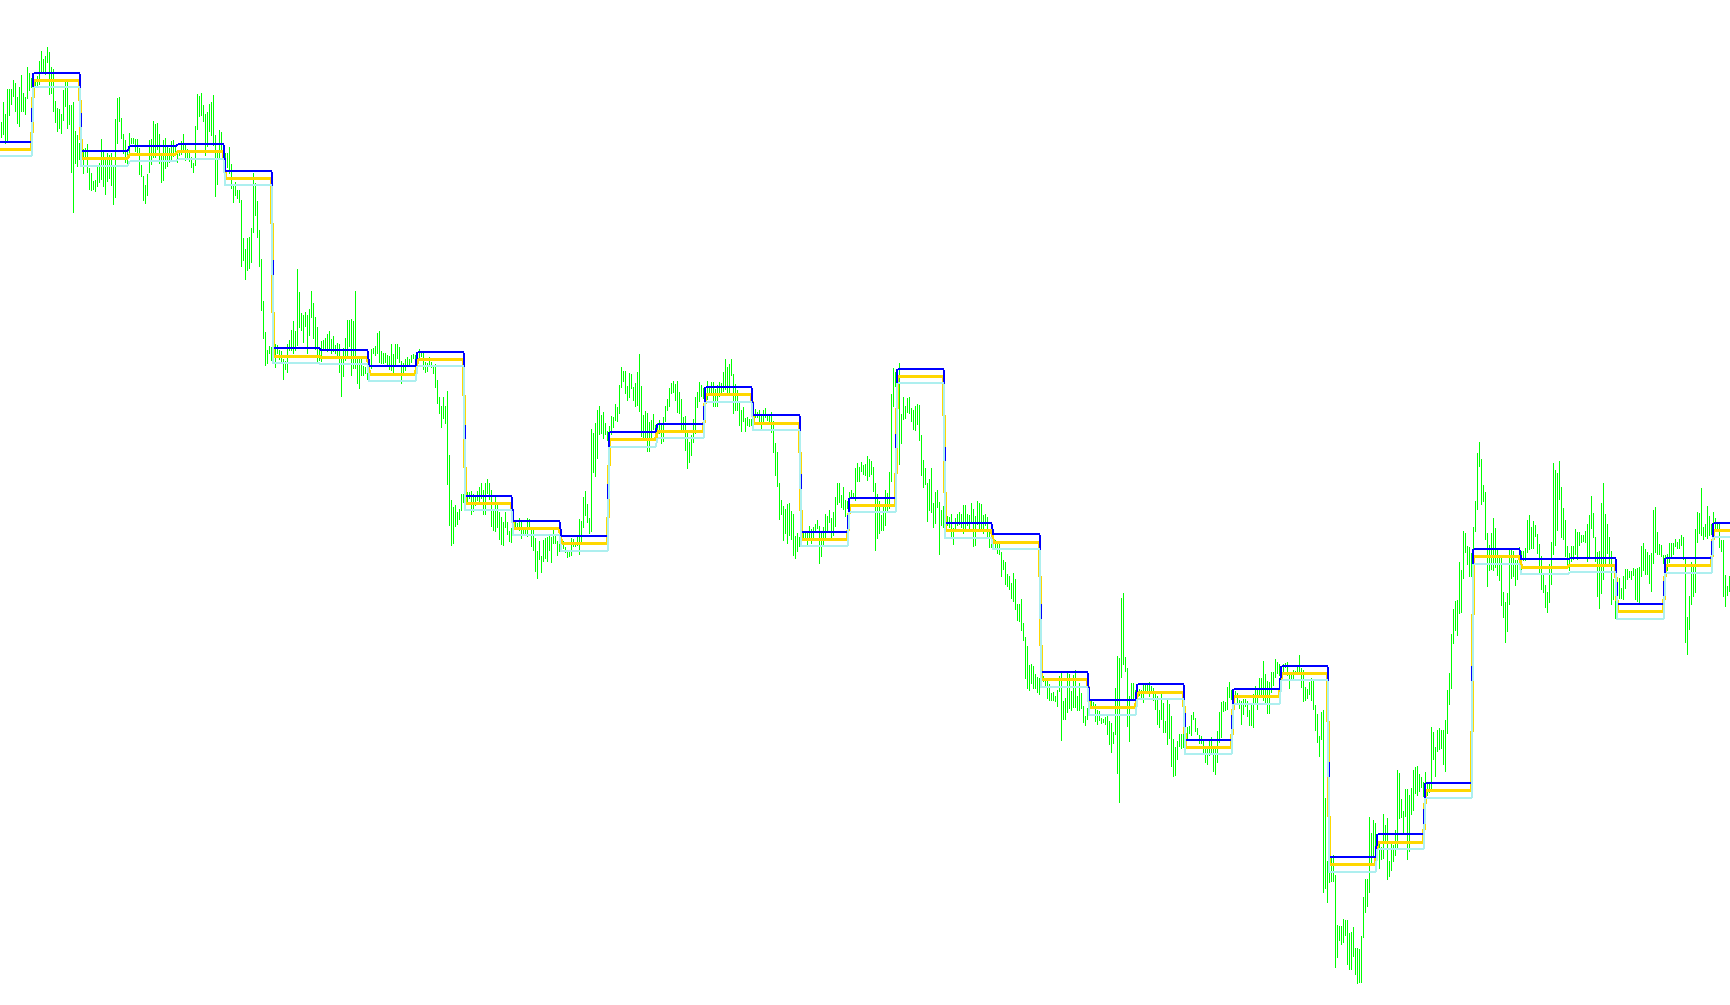
This indicator calculates a Bollinger Band variant using the Golden Ratio (2.618) as the standard deviation multiplier to identify extreme price extensions.

BB_-_HL
Indicator

BB_-_HL

iMA

This indicator calculates a dynamic trading envelope by determining the maximum squared deviation of the price range from a simple moving average to quantify extreme volatility.

BB_channels_mikko_sw
Indicator

BB_channels_mikko_sw

iBands
BB_Diff
Indicator

BB_Diff

iBands
BB_FlatSq_mtf_sw
Indicator

BB_FlatSq_mtf_sw

iATRiMAiStdDev

This indicator identifies high-volatility expansion zones by calculating price deviations from moving averages while filtering for market compression using a Bollinger Squeeze logic.

BB_MACD
Indicator

BB_MACD

iMAiMAOnArrayiStdDevOnArray

This indicator calculates the divergence between fast and slow exponential moving averages and overlays Bollinger Bands to identify trend exhaustion and momentum shifts.

BB_MACD3
Indicator

BB_MACD3

iMAiMAOnArrayiStdDevOnArray

This indicator overlays a Bollinger Band envelope onto a MACD calculation to identify volatility-adjusted trend shifts and momentum extremes.

BB_MACD3_v1
Indicator

BB_MACD3_v1

iMAiMAOnArrayiStdDevOnArray

This indicator overlays Bollinger Bands onto a MACD calculation to identify trend reversals and price momentum exhaustion through standard deviation variance.

BB_MACD_CCT
Indicator

BB_MACD_CCT

iMAiMAOnArrayiStdDevOnArray

This indicator synthesizes MACD momentum with Bollinger Band volatility bounds to visualize directional shifts and price-action extremes.

BB_MACD_v1.01
Indicator

BB_MACD_v1.01

iMAiMAOnArrayiStdDevOnArray

This indicator calculates a MACD signal and applies Bollinger Band envelopes to the momentum values to identify trend exhaustion and volatility extremes.

BB_MACD_v1.03
Indicator

BB_MACD_v1.03

iMAiMAOnArrayiStdDevOnArray

This indicator identifies trend shifts by applying Bollinger Band volatility filters to the differential momentum of Exponential Moving Averages.

BB_MACD_v1
Indicator

BB_MACD_v1

iMAiMAOnArrayiStdDevOnArray

This indicator overlays Bollinger Bands onto a MACD calculation to identify momentum shifts and volatility-adjusted trend reversals.

BB_MACD_v3
Indicator

BB_MACD_v3

iMAiMAOnArrayiStdDevOnArray

This indicator overlays a Bollinger Band volatility envelope onto the MACD momentum oscillator to identify extreme price velocity and trend exhaustion points.

BB_PRC-1
Indicator

BB_PRC-1

iBandsiMAOnArray
BB_PRC-1_v1
Indicator

BB_PRC-1_v1

iBandsiMAOnArray
BB_PRC
Indicator

BB_PRC

iBandsiMAOnArray
BB_RSI_v2_AlertEmail
Indicator

BB_RSI_v2_AlertEmail

iMA

This indicator calculates a Relative Strength Index and overlays Bollinger Bands onto it to identify extreme momentum exhaustion zones.

BB_SqueezeLRSml_4c
Indicator

BB_SqueezeLRSml_4c

iATRiMAiStdDev

This indicator identifies volatility compression by calculating the ratio between Bollinger Band deviation and Keltner Channel width while mapping price momentum via linear regression slopes.

BB_SqueezeLRSm_4c
Indicator

BB_SqueezeLRSm_4c

iATRiMAiStdDev

This indicator identifies market volatility compression by comparing Keltner Channel width against Bollinger Band standard deviation while plotting linear regression slopes to detect directional momentum shifts.

BB_Squeeze_4c_JMA
Indicator

BB_Squeeze_4c_JMA

iATRiStdDev

This indicator identifies trend exhaustion and breakout potential by calculating the ratio between Bollinger Band standard deviation and ATR-based volatility, filtered through a Jurik Moving Average linear regression.

Indicator

BB_Squeeze_Advanced_v2

iCCIiMACDiRSIiStochastic
Indicator

BB_Squeeze_Advanced_v2M

iCCIiMACDiRSIiStochastic
Indicator

BB_Squeeze_Advanced_v2M2

iCCIiMACDiRSIiStochastic
Indicator

BB_Squeeze_Advanced_v2M3

iCCIiMACDiRSIiStochastic
Indicator

BB_Squeeze_Advanced_v2M3B

iCCIiMACDiRSIiStochastic
Indicator

BB_Squeeze_Advanced_v2M3BC

iCCIiMACDiRSIiStochastic
Indicator

BB_Squeeze_Advanced_v2_v1

iCCIiMACDiRSIiStochastic
BB_Sqz_sBar_mtf_sw
Indicator

BB_Sqz_sBar_mtf_sw

iATRiStdDev

This indicator identifies periods of low market volatility by detecting instances where the Bollinger Band width contracts below a specific threshold relative to the Keltner Channel.

BDFXtrender
Indicator

BDFXtrender

iMA

This indicator utilizes a weighted price summation algorithm combined with an Exponential Moving Average crossover to identify trend momentum and directional shifts.

BearBulls
Indicator

BearBulls

iMA

This indicator quantifies market sentiment by calculating the arithmetic distance between price extremes and a multi-period exponential moving average to visualize buying and selling pressure.

BearNakedPattern1.1
Indicator

BearNakedPattern1.1

iBandsiCCIiMAOnArray
BearNakedPattern1.2
Indicator

BearNakedPattern1.2

iBandsiCCIiMAOnArray

This indicator identifies potential reversal points by detecting CCI momentum shifts against moving averages while validating price action proximity to Bollinger Band boundaries and specific volatility thresholds.

BearNakedPattern1
Indicator

BearNakedPattern1

iBandsiCCIiMAOnArray
Bears
Indicator

Bears

iMA

This indicator quantifies bearish pressure by measuring the vertical distance between the current low price and a smoothing exponential moving average.

Bears_001
Indicator

Bears_001

iMA

This indicator quantifies bearish momentum by calculating the real-time divergence between the current price floor and a smoothed exponential moving average.

Bears_mod_rickW
Indicator

Bears_mod_rickW

iMAiMAOnArray

This indicator quantifies bearish momentum by calculating the negative divergence between current low prices and an exponential moving average, smoothed by a secondary simple moving average.

Bear_Bulls_Power
Indicator

Bear_Bulls_Power

iMA

This indicator quantifies market dominance by calculating the average distance between price extremes and an Exponential Moving Average to visualize bullish or bearish momentum shifts.

Beginner
Indicator

Beginner

This indicator identifies potential trend reversals by monitoring price breaches of a volatility-adjusted threshold calculated from high and low extremes within a sliding window.

BeginnerAlert
Indicator

BeginnerAlert

This indicator identifies potential trend reversals by detecting price breaches of the high-low range extremes relative to a weighted volatility buffer.

BeginnerAlert_v2
Indicator

BeginnerAlert_v2

This indicator identifies trend reversals by detecting when price action breaches a specific percentage threshold of the recent high-low range, augmented by a dynamic volatility multiplier.

BenchStringArraySort
Indicator

BenchStringArraySort

This script extracts strings from a CSV file into a dynamic array, organizes them lexicographically using a recursive quicksort algorithm, and exports the ordered data to a new destination file.

BenOpenLines
Indicator

BenOpenLines

The logic identifies price extremes within specific hourly cycles to project linear volatility boundaries relative to the opening price.

Beno_System
Indicator

Beno_System

This indicator identifies potential trend reversals by detecting specific sequences of descending highs and ascending lows combined with relative price level breakthroughs.

BetterVolume 1.4
Indicator

BetterVolume 1.4

The indicator categorizes trading volume by correlating price range expansion and relative intensity to identify climax movements, high-churn activity, and neutral liquidity zones.

BetterVolume ChartBars part1 1.4
Indicator

BetterVolume ChartBars part1 1.4

This indicator identifies price exhaustion points by correlating relative volume against price range expansion to detect significant supply and demand imbalances.

BetterVolume ChartBars part2 1.4
Indicator

BetterVolume ChartBars part2 1.4

Identifies significant market activity by calculating the ratio of volume to price range to detect high-intensity churning and climax exhaustion points.

Better_H1
Indicator

Better_H1

iMA

This indicator synchronizes and plots Simple Moving Average values from M5, H1, and H4 timeframes onto a single chart to visualize cross- khung trend alignment.

Better_H1_1
Indicator

Better_H1_1

iMA

This indicator synchronizes and plots moving average values from the H1 timeframe onto the current chart to visualize higher-level trend dynamics.

Better_H1_2
Indicator

Better_H1_2

iMA

This indicator visualizes the synchronization of Simple Moving Averages across the M5, H1, and H4 timeframes to identify high-level trend alignment.

Better_H1_diff
Indicator

Better_H1_diff

iMA

This indicator calculates and visualizes the dynamic variance between three distinct Simple Moving Average lengths (5, 10, and 15) across various higher timeframes to identify momentum shifts.