BBands_Stop_v2
Download script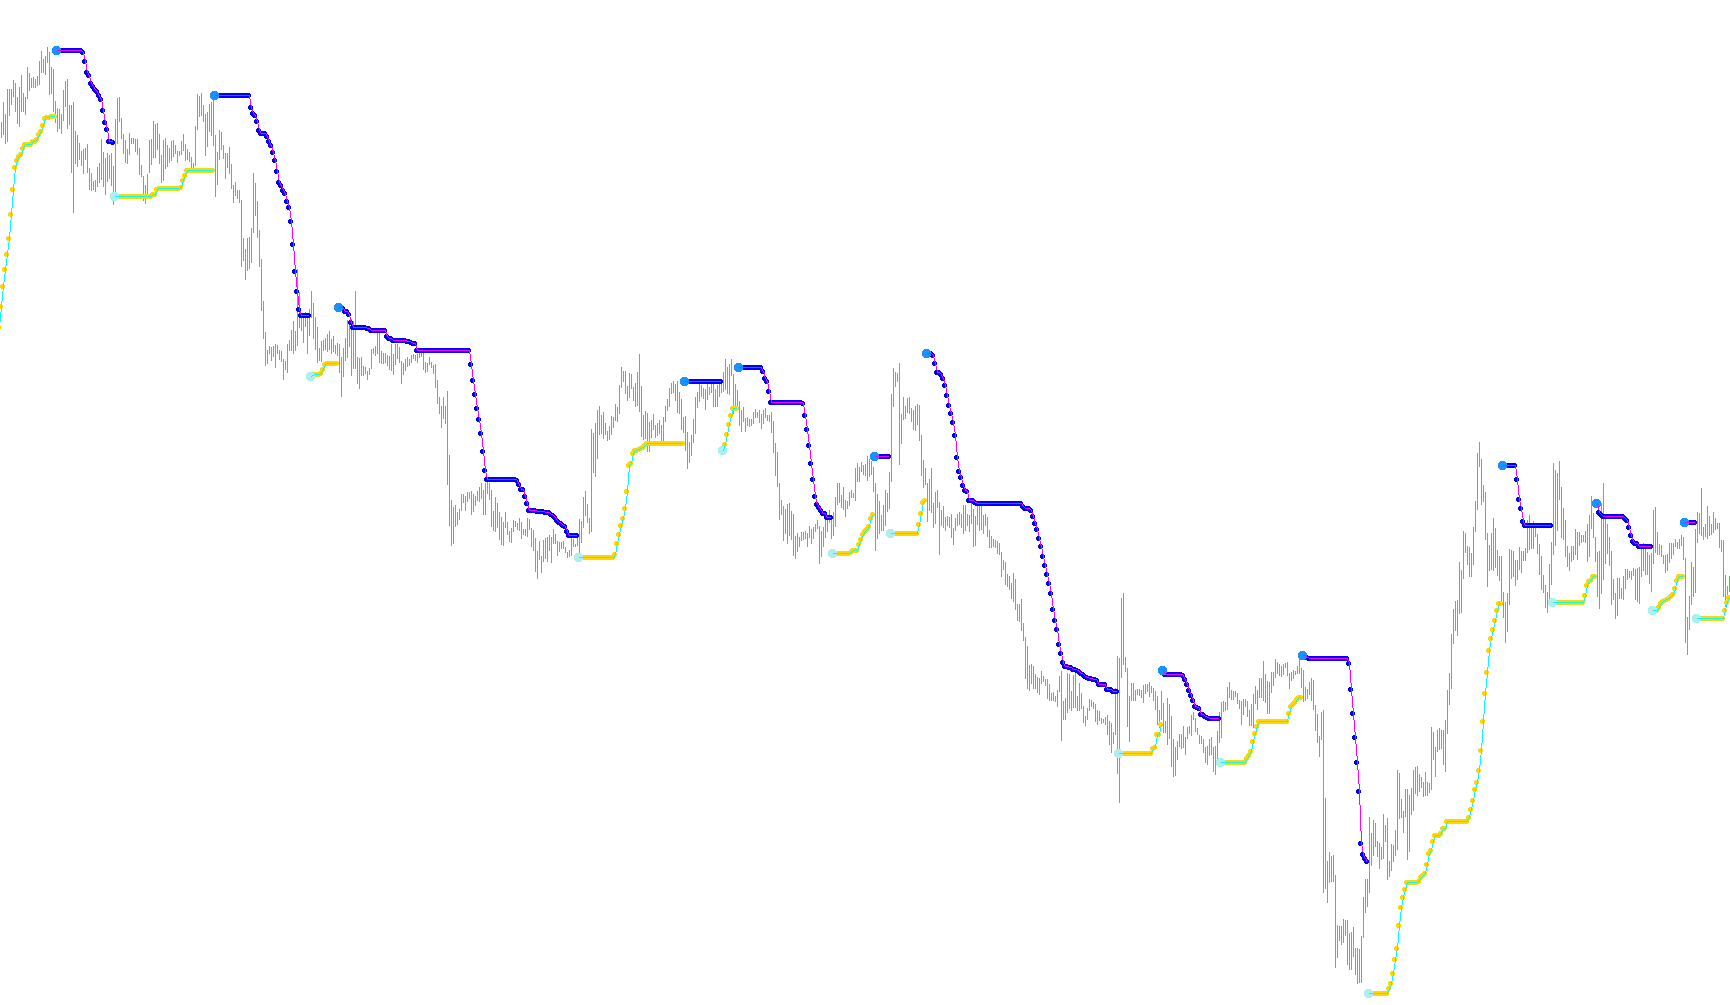
This script is a specialized technical analysis tool designed to identify market trends and provide dynamic "stop-loss" levels based on the Bollinger Bands indicator. Rather than simply showing where the price is currently moving, it focuses on identifying the boundaries of a trend and marking specific points where a trader might consider exiting a position.
Core Logic Overview
The tool operates by analyzing the relationship between the current market price and the upper and lower volatility bands (Bollinger Bands). It essentially looks for "breakout" moments to determine which direction the market is heading and then calculates a trailing safety line.
How the Analysis Works
- Trend Detection: The script monitors when the price closes above the upper volatility band or below the lower volatility band. These actions serve as triggers to define whether the market is in an "Up Trend" or a "Down Trend."
- Trailing Boundaries: Once a trend is established, the tool tracks the highest and lowest points reached during that movement. It ensures that these boundaries only move in a way that favors the trader (e.g., in an uptrend, it looks for new lows; in a downtrend, it looks for new highs).
- Risk Adjustment: The logic includes a "Money Risk" factor. This allows the script to mathematically offset the calculated stop levels, providing a customizable cushion between the current price and the suggested exit point based on your specific risk tolerance.
Visual Signals and Outputs
The tool provides three distinct types of visual information on the chart:
- Trend Lines: Depending on your settings, it can draw continuous lines that act as a visual "floor" during an uptrend or a "ceiling" during a downtrend. These lines represent the calculated safety levels that follow the price movement.
- Entry/Exit Signals: The script uses specific icons (arrows) to highlight the exact moment the trend flips or a new significant price level is confirmed. This helps distinguish between a continuous move and a new trend beginning.
- Customizable Visibility: The logic allows you to toggle between seeing just the safety lines, just the entry/exit signals, or both simultaneously, allowing you to tailor the visual layout to your personal trading style.
Summary for the User
Essentially, this tool filters out market noise by focusing on high-volatility breakouts. It identifies the direction of a trend and automatically calculates a trailing "stop" level that follows the price. As the price moves in your favor, the script updates these levels, helping you stay in profitable trades while providing a clear visual cue of where the trend might be ending or reversing.
//+------------------------------------------------------------------+
//|                                               BBands_Stop_v1.mq4 |
//|                           Copyright © 2006, TrendLaboratory Ltd. |
//|            http://finance.groups.yahoo.com/group/TrendLaboratory |
//|                                       E-mail: igorad2004@list.ru |
//+------------------------------------------------------------------+
#property copyright "Copyright © 2006, TrendLaboratory Ltd."
#property link      "http://finance.groups.yahoo.com/group/TrendLaboratory"

#property indicator_chart_window
#property indicator_buffers 6
#property indicator_color1 Chartreuse
#property indicator_color2 Orange
#property indicator_color3 Chartreuse
#property indicator_color4 Orange
#property indicator_color5 Chartreuse
#property indicator_color6 Orange
//---- input parameters
extern int    Length=20;      // Bollinger Bands Period
extern int    Deviation=2;    // Deviation
extern double MoneyRisk=1.00; // Offset Factor
 int    Signal=1;       // Display signals mode: 1-Signals & Stops; 0-only Stops; 2-only Signals;
 int    Line=1;         // Display line mode: 0-no,1-yes
 int    Nbars=1000;
//---- indicator buffers
double UpTrendBuffer[];
double DownTrendBuffer[];
double UpTrendSignal[];
double DownTrendSignal[];
double UpTrendLine[];
double DownTrendLine[];
//+------------------------------------------------------------------+
//| Custom indicator initialization function                         |
//+------------------------------------------------------------------+
  int init()
  {
   string short_name;
//---- indicator line

   SetIndexBuffer(0,UpTrendBuffer);
   SetIndexBuffer(1,DownTrendBuffer);
   SetIndexBuffer(2,UpTrendSignal);
   SetIndexBuffer(3,DownTrendSignal);
   SetIndexBuffer(4,UpTrendLine);
   SetIndexBuffer(5,DownTrendLine);
   SetIndexStyle(0,DRAW_ARROW);
   SetIndexStyle(1,DRAW_ARROW);
   SetIndexStyle(2,DRAW_ARROW);
   SetIndexStyle(3,DRAW_ARROW);
   SetIndexStyle(4,DRAW_LINE);
   SetIndexStyle(5,DRAW_LINE);
   SetIndexArrow(0,159);
   SetIndexArrow(1,159);
   SetIndexArrow(2,108);
   SetIndexArrow(3,108);
   IndicatorDigits(MarketInfo(Symbol(),MODE_DIGITS));
//---- name for DataWindow and indicator subwindow label
   short_name="BBands Stop("+Length+","+Deviation+")";
   IndicatorShortName(short_name);
   SetIndexLabel(0,"UpTrend Stop");
   SetIndexLabel(1,"DownTrend Stop");
   SetIndexLabel(2,"UpTrend Signal");
   SetIndexLabel(3,"DownTrend Signal");
   SetIndexLabel(4,"UpTrend Line");
   SetIndexLabel(5,"DownTrend Line");
//----
   SetIndexDrawBegin(0,Length);
   SetIndexDrawBegin(1,Length);
   SetIndexDrawBegin(2,Length);
   SetIndexDrawBegin(3,Length);
   SetIndexDrawBegin(4,Length);
   SetIndexDrawBegin(5,Length);
//----
   return(0);
  }

//+------------------------------------------------------------------+
//| Bollinger Bands_Stop_v1                                             |
//+------------------------------------------------------------------+
int start()
  {
   int    limit;
   int    counted_bars=IndicatorCounted();
   //---- last counted bar will be recounted
   if(counted_bars>0) counted_bars--;

   int    i,shift,trend;
   double smax[25000],smin[25000],bsmax[25000],bsmin[25000];
   limit=Bars-counted_bars;
   if (limit < Nbars) limit = Nbars;

   for (shift=limit;shift>=0;shift--)
   {
   UpTrendBuffer[shift]=0;
   DownTrendBuffer[shift]=0;
   UpTrendSignal[shift]=0;
   DownTrendSignal[shift]=0;
   UpTrendLine[shift]=EMPTY_VALUE;
   DownTrendLine[shift]=EMPTY_VALUE;
   }

   for (shift=limit-Length-1;shift>=0;shift--)
   {
     smax[shift]=iBands(NULL,0,Length,Deviation,0,PRICE_CLOSE,MODE_UPPER,shift);
	  smin[shift]=iBands(NULL,0,Length,Deviation,0,PRICE_CLOSE,MODE_LOWER,shift);

	  if (Close[shift]>smax[shift+1]) trend=1;
	  if (Close[shift]<smin[shift+1]) trend=-1;

	  if(trend>0 && smin[shift]<smin[shift+1]) smin[shift]=smin[shift+1];
	  if(trend<0 && smax[shift]>smax[shift+1]) smax[shift]=smax[shift+1];

	  bsmax[shift]=smax[shift]+0.5*(MoneyRisk-1)*(smax[shift]-smin[shift]);
	  bsmin[shift]=smin[shift]-0.5*(MoneyRisk-1)*(smax[shift]-smin[shift]);

	  if(trend>0 && bsmin[shift]<bsmin[shift+1]) bsmin[shift]=bsmin[shift+1];
	  if(trend<0 && bsmax[shift]>bsmax[shift+1]) bsmax[shift]=bsmax[shift+1];

	  if (trend>0)
	  {
	     if (Signal>0 && UpTrendBuffer[shift+1]==-1.0)
	     {
	     UpTrendSignal[shift]=bsmin[shift];
	     UpTrendBuffer[shift]=bsmin[shift];
	     if(Line>0) UpTrendLine[shift]=bsmin[shift];
	     }
	     else
	     {
	     UpTrendBuffer[shift]=bsmin[shift];
	     if(Line>0) UpTrendLine[shift]=bsmin[shift];
	     UpTrendSignal[shift]=-1;
	     }
	  if (Signal==2) UpTrendBuffer[shift]=0;
	  DownTrendSignal[shift]=-1;
	  DownTrendBuffer[shift]=-1.0;
	  DownTrendLine[shift]=EMPTY_VALUE;
	  }
	  if (trend<0)
	  {
	  if (Signal>0 && DownTrendBuffer[shift+1]==-1.0)
	     {
	     DownTrendSignal[shift]=bsmax[shift];
	     DownTrendBuffer[shift]=bsmax[shift];
	     if(Line>0) DownTrendLine[shift]=bsmax[shift];
	     }
	     else
	     {
	     DownTrendBuffer[shift]=bsmax[shift];
	     if(Line>0)DownTrendLine[shift]=bsmax[shift];
	     DownTrendSignal[shift]=-1;
	     }
	  if (Signal==2) DownTrendBuffer[shift]=0;
	  UpTrendSignal[shift]=-1;
	  UpTrendBuffer[shift]=-1.0;
	  UpTrendLine[shift]=EMPTY_VALUE;
	  }

	 }
	return(0);
 }
Comments