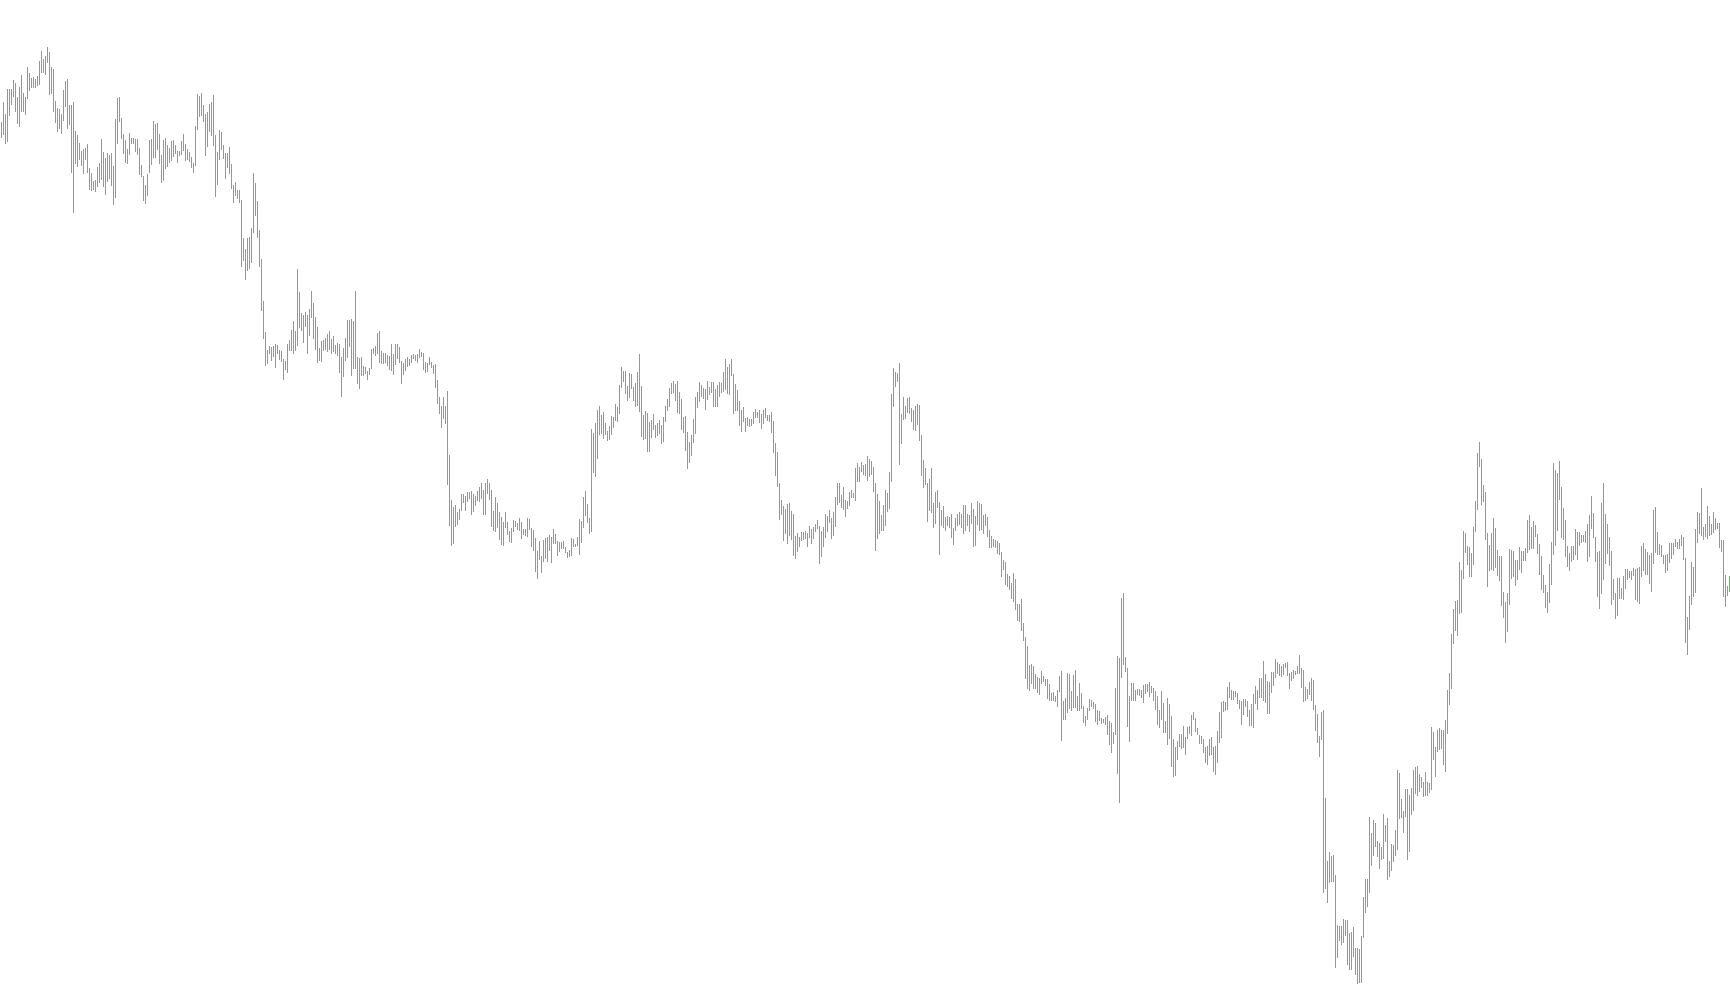
This tool is designed to help traders identify market trends and determine specific price levels where a trend might be considered "broken" or "exhausted." It achieves this by building upon the popular Bollinger Bands technical indicator, adding a layer of logic that identifies significant shifts in price momentum.
Core Logic Overview
The script functions by analyzing two main components: the standard movement of the Bollinger Bands and the direction of the current market trend. Here is a breakdown of how it processes this information:
Trend Identification The tool first monitors whether the market is moving in an upward or downward direction. It looks for specific "breakout" moments where the price closes outside the established boundaries of the Bollinger Bands.
- If the price breaks above the upper band, it registers an upward trend.
- If the price breaks below the lower band, it registers a downward trend.
Dynamic Stop Level Calculation Once a trend is established, the script calculates a "Stop" level. Unlike standard indicators that might move wildly with every small price tick, this logic includes a stabilization feature:
- The Safety Buffer: It uses a custom risk factor (MoneyRisk) to create an offset from the bands. This ensures the calculated stop levels are mathematically balanced relative to the width of the current market volatility.
- The "Ratchet" Effect: To prevent the stop levels from moving in a way that would trap a trader during minor fluctuations, the script uses a locking mechanism. In an uptrend, for example, the stop level can only move upward; it will never drop lower than its previous value. Conversely, in a downtrend, the stop level can only move downward; it will never rise higher than its previous value.
Visual Signals and Customization The script translates these mathematical calculations into visual cues on your chart:
- Trend Lines: It can draw continuous lines that represent the current "safety" level for both upward and downward movements.
- Entry/Exit Signals: Depending on your settings, it can place specific markers (arrows) on the chart to highlight exactly where a new trend has been confirmed or where a stop level has been triggered.
Summary of Use
Essentially, this script acts as a trend-following guide that "locks in" progress. It identifies when a trend starts, calculates a dynamic safety boundary based on market volatility, and ensures that those boundaries only move in your favor as the trend matures, helping to filter out market noise and provide clearer signals for potential trade management.
//+------------------------------------------------------------------+
//|                                               BBands_Stop_v1.mq4 |
//|                           Copyright © 2006, TrendLaboratory Ltd. |
//|            http://finance.groups.yahoo.com/group/TrendLaboratory |
//|                                       E-mail: igorad2004@list.ru |
//+------------------------------------------------------------------+
#property copyright "Copyright © 2006, TrendLaboratory Ltd."
#property link      "http://finance.groups.yahoo.com/group/TrendLaboratory"

#property indicator_chart_window
#property indicator_buffers 6
#property indicator_color1 Chartreuse
#property indicator_color2 Orange
#property indicator_color3 Chartreuse
#property indicator_color4 Orange
#property indicator_color5 Chartreuse
#property indicator_color6 Orange
//---- input parameters
extern int    Length=20;      // Bollinger Bands Period
extern double    Deviation=2;    // Deviation
extern double MoneyRisk=1.00; // Offset Factor
extern int    Signal=1;       // Display signals mode: 1-Signals & Stops; 0-only Stops; 2-only Signals;
extern int    Line=1;         // Display line mode: 0-no,1-yes
extern int    Nbars=1000;
//---- indicator buffers
double UpTrendBuffer[];
double DownTrendBuffer[];
double UpTrendSignal[];
double DownTrendSignal[];
double UpTrendLine[];
double DownTrendLine[];
//+------------------------------------------------------------------+
//| Custom indicator initialization function                         |
//+------------------------------------------------------------------+
  int init()
  {
   string short_name;
//---- indicator line

   SetIndexBuffer(0,UpTrendBuffer);
   SetIndexBuffer(1,DownTrendBuffer);
   SetIndexBuffer(2,UpTrendSignal);
   SetIndexBuffer(3,DownTrendSignal);
   SetIndexBuffer(4,UpTrendLine);
   SetIndexBuffer(5,DownTrendLine);
   SetIndexStyle(0,DRAW_ARROW);
   SetIndexStyle(1,DRAW_ARROW);
   SetIndexStyle(2,DRAW_ARROW);
   SetIndexStyle(3,DRAW_ARROW);
   SetIndexStyle(4,DRAW_LINE);
   SetIndexStyle(5,DRAW_LINE);
   SetIndexArrow(0,159);
   SetIndexArrow(1,159);
   SetIndexArrow(2,108);
   SetIndexArrow(3,108);
   IndicatorDigits(MarketInfo(Symbol(),MODE_DIGITS));
//---- name for DataWindow and indicator subwindow label
   short_name="BBands Stop("+Length+","+Deviation+")";
   IndicatorShortName(short_name);
   SetIndexLabel(0,"UpTrend Stop");
   SetIndexLabel(1,"DownTrend Stop");
   SetIndexLabel(2,"UpTrend Signal");
   SetIndexLabel(3,"DownTrend Signal");
   SetIndexLabel(4,"UpTrend Line");
   SetIndexLabel(5,"DownTrend Line");
//----
   SetIndexDrawBegin(0,Length);
   SetIndexDrawBegin(1,Length);
   SetIndexDrawBegin(2,Length);
   SetIndexDrawBegin(3,Length);
   SetIndexDrawBegin(4,Length);
   SetIndexDrawBegin(5,Length);
//----
   return(0);
  }

//+------------------------------------------------------------------+
//| Bollinger Bands_Stop_v1                                             |
//+------------------------------------------------------------------+
int start()
  {
   int    i,shift,trend;
   double smax[25000],smin[25000],bsmax[25000],bsmin[25000];

   for (shift=Nbars;shift>=0;shift--)
   {
   UpTrendBuffer[shift]=0;
   DownTrendBuffer[shift]=0;
   UpTrendSignal[shift]=0;
   DownTrendSignal[shift]=0;
   UpTrendLine[shift]=EMPTY_VALUE;
   DownTrendLine[shift]=EMPTY_VALUE;
   }

   for (shift=Nbars-Length-1;shift>=0;shift--)
   {
     smax[shift]=iBands(NULL,0,Length,Deviation,0,PRICE_CLOSE,MODE_UPPER,shift);
	  smin[shift]=iBands(NULL,0,Length,Deviation,0,PRICE_CLOSE,MODE_LOWER,shift);

	  if (Close[shift]>smax[shift+1]) trend=1;
	  if (Close[shift]<smin[shift+1]) trend=-1;

	  if(trend>0 && smin[shift]<smin[shift+1]) smin[shift]=smin[shift+1];
	  if(trend<0 && smax[shift]>smax[shift+1]) smax[shift]=smax[shift+1];

	  bsmax[shift]=smax[shift]+0.5*(MoneyRisk-1)*(smax[shift]-smin[shift]);
	  bsmin[shift]=smin[shift]-0.5*(MoneyRisk-1)*(smax[shift]-smin[shift]);

	  if(trend>0 && bsmin[shift]<bsmin[shift+1]) bsmin[shift]=bsmin[shift+1];
	  if(trend<0 && bsmax[shift]>bsmax[shift+1]) bsmax[shift]=bsmax[shift+1];

	  if (trend>0)
	  {
	     if (Signal>0 && UpTrendBuffer[shift+1]==-1.0)
	     {
	     UpTrendSignal[shift]=bsmin[shift];
	     UpTrendBuffer[shift]=bsmin[shift];
	     if(Line>0) UpTrendLine[shift]=bsmin[shift];
	     }
	     else
	     {
	     UpTrendBuffer[shift]=bsmin[shift];
	     if(Line>0) UpTrendLine[shift]=bsmin[shift];
	     UpTrendSignal[shift]=-1;
	     }
	  if (Signal==2) UpTrendBuffer[shift]=0;
	  DownTrendSignal[shift]=-1;
	  DownTrendBuffer[shift]=-1.0;
	  DownTrendLine[shift]=EMPTY_VALUE;
	  }
	  if (trend<0)
	  {
	  if (Signal>0 && DownTrendBuffer[shift+1]==-1.0)
	     {
	     DownTrendSignal[shift]=bsmax[shift];
	     DownTrendBuffer[shift]=bsmax[shift];
	     if(Line>0) DownTrendLine[shift]=bsmax[shift];
	     }
	     else
	     {
	     DownTrendBuffer[shift]=bsmax[shift];
	     if(Line>0)DownTrendLine[shift]=bsmax[shift];
	     DownTrendSignal[shift]=-1;
	     }
	  if (Signal==2) DownTrendBuffer[shift]=0;
	  UpTrendSignal[shift]=-1;
	  UpTrendBuffer[shift]=-1.0;
	  UpTrendLine[shift]=EMPTY_VALUE;
	  }

	 }
	return(0);
 }
Comments