bbsqueeze1_v1
Download script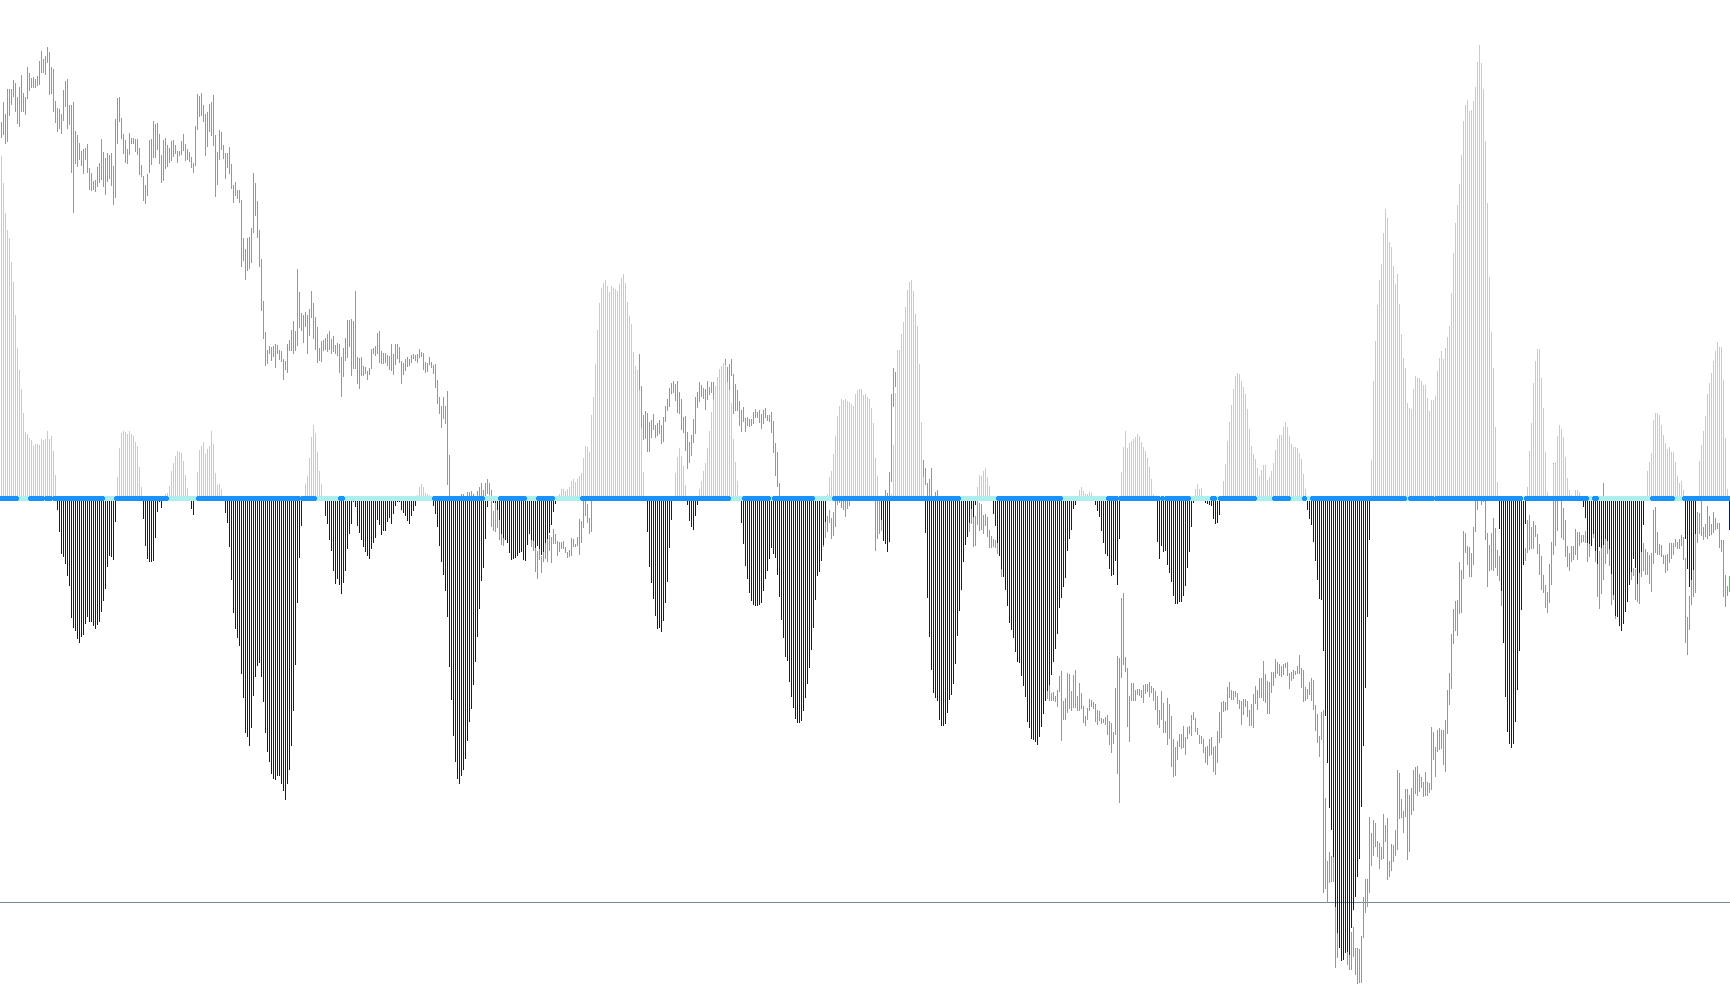
This technical script functions as a specialized market analysis tool designed to identify two specific trading conditions: trend direction and market squeeze (volatility compression). It processes historical price data to provide visual cues on the trading platform, helping users distinguish between active trends and periods of unusual calm.
Core Logic Components
The indicator operates by processing three distinct types of mathematical data simultaneously:
1. Trend Identification (Linear Regression)
Instead of simply looking at whether the price is "going up" or "down" based on the last candle, the script uses a Linear Regression model. It calculates a mathematical "line of best fit" over a specific period of time. By analyzing the relationship between recent highs, lows, and moving averages, it determines the underlying slope of the market.
- If the calculated trend is positive, the tool identifies upward momentum.
- If the trend is negative, it identifies downward momentum.
2. Volatility Measurement (ATR & Standard Deviation)
To understand the "mood" of the market, the script monitors how much the price fluctuates compared to its average movement. It uses two primary metrics:
- Average True Range (ATR): This measures the typical distance between highs and lows.
- Standard Deviation: This measures how much the price deviates from its average price.
3. The "Squeeze" Detection
The unique logic of this script lies in how it combines the data above to detect a Bollinger Squeeze. It calculates a ratio: it takes the market's standard deviation and divides it by its actual volatility (the ATR).
When this ratio falls below a specific threshold, it signals that the market is "squeezing"—meaning price movement is becoming abnormally tight or compressed. In trading terms, this often suggests that a period of low volatility is ending and a significant breakout (in either direction) may be imminent.
Visual Output
The script communicates these findings to the user through different visual markers:
- Histograms: These provide a clear visual representation of the current trend direction based on the regression analysis.
- Arrows: These serve as specific alerts for "Squeeze" conditions, highlighting moments where the market's volatility has compressed significantly enough to warrant the user's attention.
Summary for the Trader
In essence, this tool acts as a filter. It helps you see where the price is heading (the trend) while simultaneously warning you when the market is "holding its breath" (the squeeze). By identifying these compressed periods, traders can better prepare for the explosive movements that often follow periods of high-pressure, low-volatility consolidation.
/*-----------------------------+
|			       |
| Shared by www.Aptrafx.com    |
|			       |
+------------------------------*/

//+------------------------------------------------------------------+
//|                                                    bbsqueeze.mq4 |
//|                Copyright © 2005, Nick Bilak, beluck[AT]gmail.com |
//+------------------------------------------------------------------+
#property copyright "Copyright © 2005, Nick Bilak"
#property link      "http://metatrader.50webs.com/"

#property indicator_separate_window
#property indicator_buffers 4
#property indicator_color1 Lime
#property indicator_color2 Red
#property indicator_color3 Magenta
#property indicator_color4 Aqua
//---- input parameters
extern int       bolPrd=20;
extern double    bolDev=2.0;
extern int       keltPrd=20;
extern double    keltFactor=1.5;
extern int       momPrd=12;
//---- buffers
double upB[];
double loB[];
double upK[];
double loK[];

int i,j,slippage=3;
double breakpoint=0.0;
double ema=0.0;
int peakf=0;
int peaks=0;
int valleyf=0;
int valleys=0, limit=0;
double ccis[61],ccif[61];
double delta=0;
double ugol=0;
//+------------------------------------------------------------------+
//| Custom indicator initialization function                         |
//+------------------------------------------------------------------+
int init()
  {
//---- indicators
   SetIndexStyle(0,DRAW_HISTOGRAM);
   SetIndexBuffer(0,upB);
   SetIndexEmptyValue(0,EMPTY_VALUE);
   SetIndexStyle(1,DRAW_HISTOGRAM);
   SetIndexBuffer(1,loB);
   SetIndexEmptyValue(1,EMPTY_VALUE);

   SetIndexStyle(2,DRAW_ARROW);
   SetIndexBuffer(2,upK);
   SetIndexEmptyValue(2,EMPTY_VALUE);
   SetIndexArrow(2,159);
   SetIndexStyle(3,DRAW_ARROW);
   SetIndexBuffer(3,loK);
   SetIndexEmptyValue(3,EMPTY_VALUE);
   SetIndexArrow(3,159);
//----
   return(0);
  }
//+------------------------------------------------------------------+
//| Custor indicator deinitialization function                       |
//+------------------------------------------------------------------+
int deinit()
  {
//----

//----
   return(0);
  }
//+------------------------------------------------------------------+
//| Custom indicator iteration function                              |
//+------------------------------------------------------------------+
int start()
  {
   int counted_bars=IndicatorCounted();
   int shift,limit;
   double diff,d,std,bbs;

   if (counted_bars<0) return(-1);
   if (counted_bars>0) counted_bars--;
   limit=Bars-31;
   if(counted_bars>=31) limit=Bars-counted_bars-1;

   for (shift=limit;shift>=0;shift--)   {
      //d=iMomentum(NULL,0,momPrd,PRICE_CLOSE,shift);
      d=LinearRegressionValue(bolPrd,shift);
      if(d>0) {
         upB[shift]=d;
         loB[shift]=0;
      } else {
         upB[shift]=0;
         loB[shift]=d;
      }
		diff = iATR(NULL,0,keltPrd,shift)*keltFactor;
		std = iStdDev(NULL,0,bolPrd,MODE_SMA,0,PRICE_CLOSE,shift);
		bbs = bolDev * std / diff;
      if(bbs<1) {
         upK[shift]=0;
         loK[shift]=EMPTY_VALUE;
      } else {
         loK[shift]=0;
         upK[shift]=EMPTY_VALUE;
      }
   }
   return(0);
  }
//+------------------------------------------------------------------+


double LinearRegressionValue(int Len,int shift) {
   double SumBars = 0;
   double SumSqrBars = 0;
   double SumY = 0;
   double Sum1 = 0;
   double Sum2 = 0;
   double Slope = 0;

   SumBars = Len * (Len-1) * 0.5;
   SumSqrBars = (Len - 1) * Len * (2 * Len - 1)/6;

  for (int x=0; x<=Len-1;x++) {
   double HH = Low[x+shift];
   double LL = High[x+shift];
   for (int y=x; y<=(x+Len)-1; y++) {
     HH = MathMax(HH, High[y+shift]);
     LL = MathMin(LL, Low[y+shift]);
   }
    Sum1 += x* (Close[x+shift]-((HH+LL)/2 + iMA(NULL,0,Len,0,MODE_EMA,PRICE_CLOSE,x+shift))/2);
    SumY += (Close[x+shift]-((HH+LL)/2 + iMA(NULL,0,Len,0,MODE_EMA,PRICE_CLOSE,x+shift))/2);
  }
  Sum2 = SumBars * SumY;
  double Num1 = Len * Sum1 - Sum2;
  double Num2 = SumBars * SumBars-Len * SumSqrBars;

  if (Num2 != 0.0)  {
    Slope = Num1/Num2;
  } else {
    Slope = 0;
  }

  double Intercept = (SumY - Slope*SumBars) /Len;
  //debugPrintln(Intercept+" : "+Slope);
  double LinearRegValue = Intercept+Slope * (Len - 1);

  return (LinearRegValue);

}
Comments