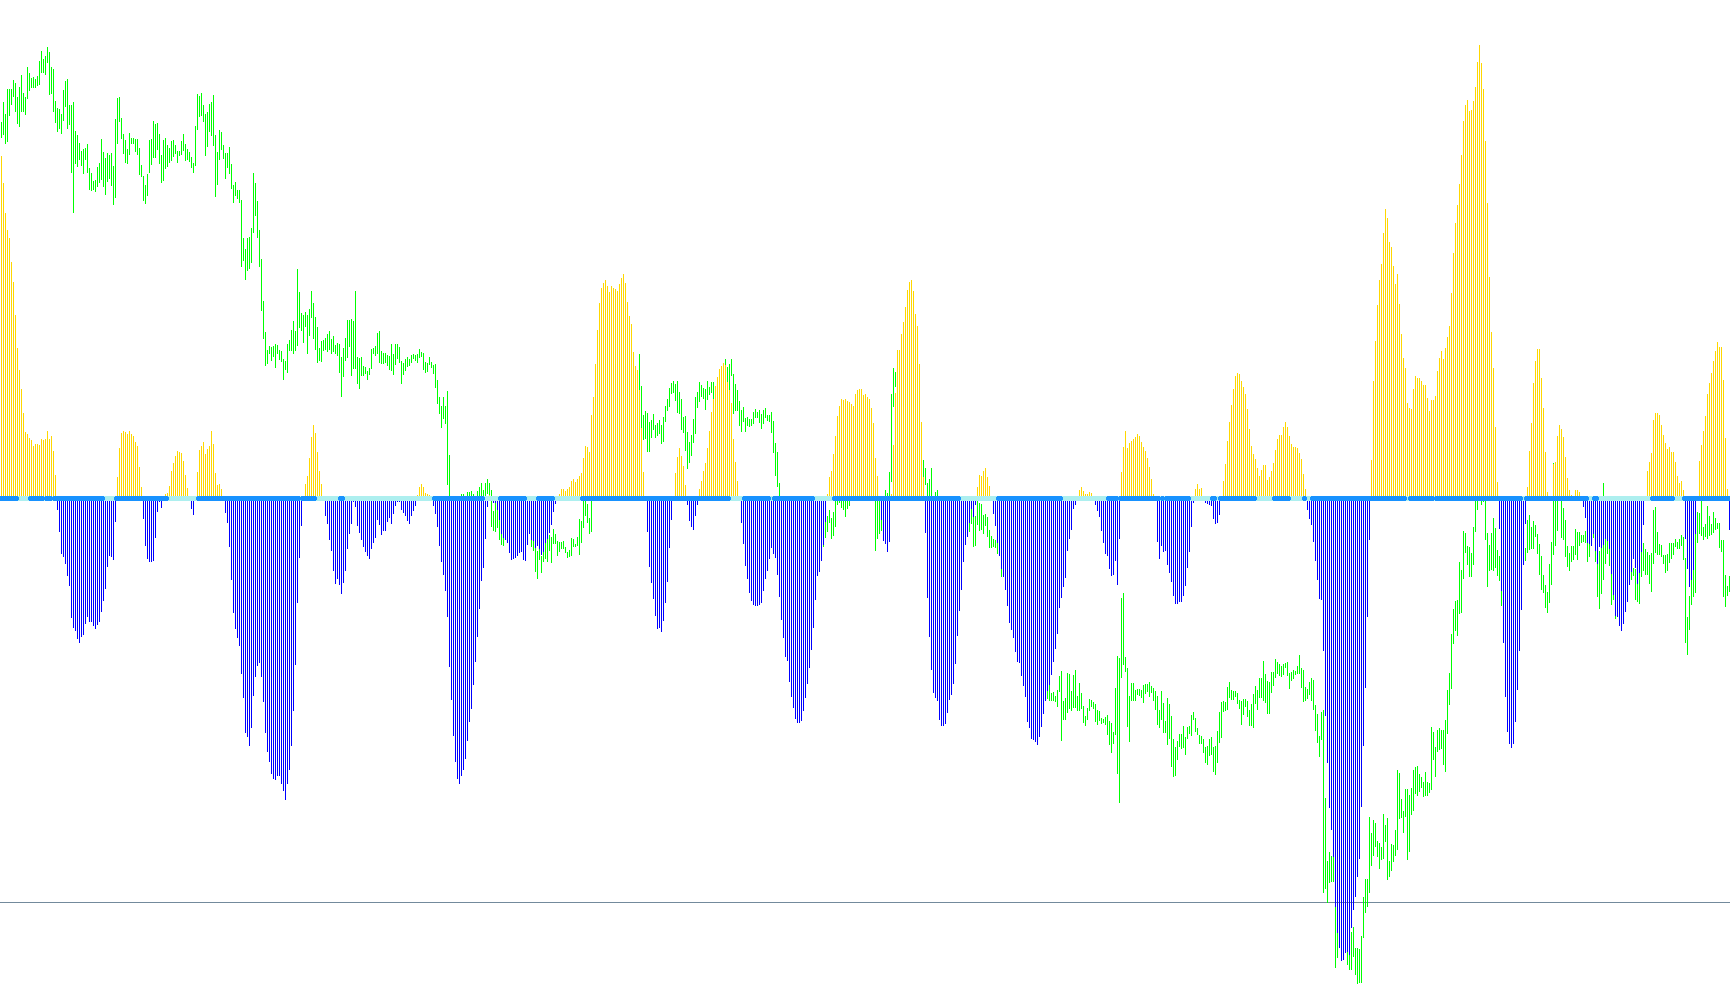
This technical indicator is designed to analyze market conditions by identifying periods of "compression" and directional momentum. It works by evaluating the relationship between price movement, volatility, and historical trends to provide a visual signal of when the market is becoming squeezed or beginning to breakout.
Core Logic Overview
The script operates through three primary analytical layers:
1. Trend Directional Analysis The tool calculates a specific linear regression value based on the recent history of price action. Unlike standard moving averages, this calculation looks at the relationship between the high and low prices relative to an exponential average.
- If the resulting value is positive, it indicates upward momentum (visualized as a green histogram).
- If the value is negative, it indicates downward momentum (visualized as a red histogram).
2. Volatility and Squeeze Measurement The indicator measures "market tightness" by comparing two different types of volatility:
- It assesses the Average True Range (ATR) to determine the standard movement of price.
- It calculates the Standard Deviation to understand how much the price is fluctuating from its average path.
- By dividing the standard deviation by the average range and multiplying it by a user-defined factor, the script determines a "Squeeze Factor."
3. Breakout Signaling The primary goal of this logic is to identify when the market is "squeezed"—a state where volatility is extremely low and prices are moving in a very narrow range.
- When the calculated squeeze factor falls below a specific threshold, it suggests that the market is coiling like a spring.
- When the market breaks out of this compressed state, the script generates visual markers (arrows) on the chart. These signals act as alerts for potential price expansions, indicating that the period of low-volatility "quiet" is ending and a significant move may be beginning.
Summary for Traders
In practical terms, this tool helps filter out market noise. It identifies zones where the market is trading in a very tight, sideways fashion (the squeeze) and provides visual cues to alert you when that pressure is releasing into a new trend. It combines directional momentum with volatility filtering to help identify high-probability entry points following periods of consolidation.
/*-----------------------------+
|			       |
| Shared by www.Aptrafx.com    |
|			       |
+------------------------------*/

//+------------------------------------------------------------------+
//|                                                    bbsqueeze.mq4 |
//|                Copyright © 2005, Nick Bilak, beluck[AT]gmail.com |
//+------------------------------------------------------------------+
#property copyright "Copyright © 2005, Nick Bilak"
#property link      "http://metatrader.50webs.com/"

#property indicator_separate_window
#property indicator_buffers 4
#property indicator_color1 Lime
#property indicator_color2 Red
#property indicator_color3 Magenta
#property indicator_color4 Aqua
//---- input parameters
extern int       bolPrd=20;
extern double    bolDev=2.0;
extern int       keltPrd=20;
extern double    keltFactor=1.5;
extern int       momPrd=12;
//---- buffers
double upB[];
double loB[];
double upK[];
double loK[];

int i,j,slippage=3;
double breakpoint=0.0;
double ema=0.0;
int peakf=0;
int peaks=0;
int valleyf=0;
int valleys=0, limit=0;
double ccis[61],ccif[61];
double delta=0;
double ugol=0;
//+------------------------------------------------------------------+
//| Custom indicator initialization function                         |
//+------------------------------------------------------------------+
int init()
  {
//---- indicators
   SetIndexStyle(0,DRAW_HISTOGRAM);
   SetIndexBuffer(0,upB);
   SetIndexEmptyValue(0,EMPTY_VALUE);
   SetIndexStyle(1,DRAW_HISTOGRAM);
   SetIndexBuffer(1,loB);
   SetIndexEmptyValue(1,EMPTY_VALUE);

   SetIndexStyle(2,DRAW_ARROW);
   SetIndexBuffer(2,upK);
   SetIndexEmptyValue(2,EMPTY_VALUE);
   SetIndexArrow(2,159);
   SetIndexStyle(3,DRAW_ARROW);
   SetIndexBuffer(3,loK);
   SetIndexEmptyValue(3,EMPTY_VALUE);
   SetIndexArrow(3,159);
//----
   return(0);
  }
//+------------------------------------------------------------------+
//| Custor indicator deinitialization function                       |
//+------------------------------------------------------------------+
int deinit()
  {
//----

//----
   return(0);
  }
//+------------------------------------------------------------------+
//| Custom indicator iteration function                              |
//+------------------------------------------------------------------+
int start()
  {
   int counted_bars=IndicatorCounted();
   int shift,limit;
   double diff,d,std,bbs;

   if (counted_bars<0) return(-1);
   if (counted_bars>0) counted_bars--;
   limit=Bars-31;
   if(counted_bars>=31) limit=Bars-counted_bars-1;

   for (shift=limit;shift>=0;shift--)   {
      //d=iMomentum(NULL,0,momPrd,PRICE_CLOSE,shift);
      d=LinearRegressionValue(bolPrd,shift);
      if(d>0) {
         upB[shift]=d;
         loB[shift]=0;
      } else {
         upB[shift]=0;
         loB[shift]=d;
      }
		diff = iATR(NULL,0,keltPrd,shift)*keltFactor;
		std = iStdDev(NULL,0,bolPrd,MODE_SMA,0,PRICE_CLOSE,shift);
		bbs = bolDev * std / diff;
      if(bbs<1) {
         upK[shift]=0;
         loK[shift]=EMPTY_VALUE;
      } else {
         loK[shift]=0;
         upK[shift]=EMPTY_VALUE;
      }
   }
   return(0);
  }
//+------------------------------------------------------------------+


double LinearRegressionValue(int Len,int shift) {
   double SumBars = 0;
   double SumSqrBars = 0;
   double SumY = 0;
   double Sum1 = 0;
   double Sum2 = 0;
   double Slope = 0;

   SumBars = Len * (Len-1) * 0.5;
   SumSqrBars = (Len - 1) * Len * (2 * Len - 1)/6;

  for (int x=0; x<=Len-1;x++) {
   double HH = Low[x+shift];
   double LL = High[x+shift];
   for (int y=x; y<=(x+Len)-1; y++) {
     HH = MathMax(HH, High[y+shift]);
     LL = MathMin(LL, Low[y+shift]);
   }
    Sum1 += x* (Close[x+shift]-((HH+LL)/2 + iMA(NULL,0,Len,0,MODE_EMA,PRICE_CLOSE,x+shift))/2);
    SumY += (Close[x+shift]-((HH+LL)/2 + iMA(NULL,0,Len,0,MODE_EMA,PRICE_CLOSE,x+shift))/2);
  }
  Sum2 = SumBars * SumY;
  double Num1 = Len * Sum1 - Sum2;
  double Num2 = SumBars * SumBars-Len * SumSqrBars;

  if (Num2 != 0.0)  {
    Slope = Num1/Num2;
  } else {
    Slope = 0;
  }

  double Intercept = (SumY - Slope*SumBars) /Len;
  //debugPrintln(Intercept+" : "+Slope);
  double LinearRegValue = Intercept+Slope * (Len - 1);

  return (LinearRegValue);

}
Comments