BBandWidthRatio_v1
Download script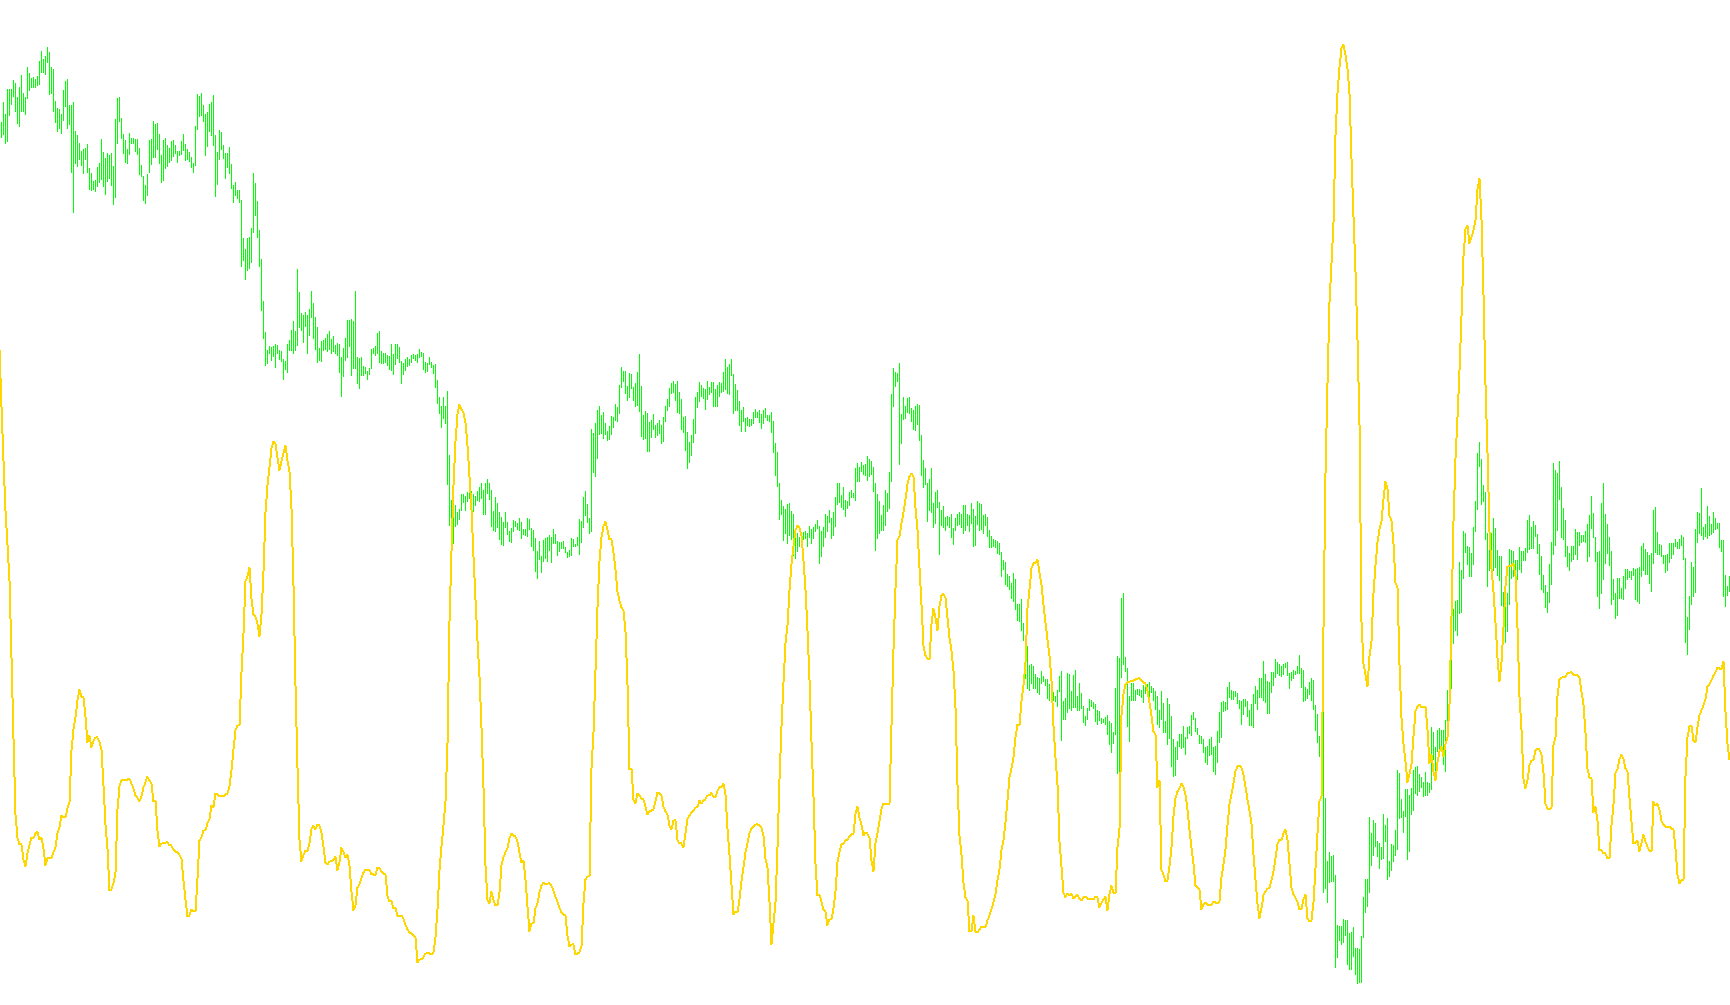
This tool is designed to provide traders with a visual representation of market volatility relative to the price movement. It specifically focuses on calculating and displaying a "Width Ratio," which helps in identifying how much the price is expanding or contracting compared to its average trend.
How the Logic Works
1. Establishing a Baseline (Moving Average) The script begins by looking at a specific number of recent candles (set by the user as the Period). It calculates a simple moving average, which acts as the "center line" or the equilibrium point of the current price action. This helps the tool understand where the price is generally trending.
2. Measuring Price Volatility (Standard Deviation) Beyond just finding the average, the script analyzes how far individual prices stray from that average. It calculates the "Standard Deviation"—a mathematical measure of spread. By understanding this spread, the tool can determine if the market is currently in a period of high intensity (large price swings) or low intensity (tight, stable movement).
3. Defining the Boundaries The logic uses these calculations to simulate an invisible "envelope" around the price. It determines an upper and lower boundary based on the user's chosen deviation level. The wider this envelope becomes, the more volatile the market is considered to be.
4. Calculating the Width Ratio Instead of simply showing you how wide the market is, the script performs a specific calculation: it takes the total width of that invisible envelope and divides it by the average price.
What This Means for the Trader
The final output displayed on your chart is a single line representing this Width Ratio.
- When the line moves up: It indicates that the market's volatility is increasing relative to its price. This often suggests a breakout or a significant expansion in market activity.
- When the line moves down: It indicates that the market is "squeezing" or becoming more consolidated. The price movements are tightening, which can sometimes precede a period of low-activity ranging or a buildup of energy before a potential move.
In essence, this tool simplifies complex volatility math into a single, readable line, allowing you to see at a glance whether the market is expanding or contracting in real-time.
/*-----------------------------+
|			       |
| Shared by www.Aptrafx.com    |
|			       |
+------------------------------*/

//+------------------------------------------------------------------+
//|                                              BBandWidthRatio.mq4 |
//|                                                             Maji |
//+------------------------------------------------------------------+
#property copyright "Maji"
#property link      "None"

#property indicator_separate_window
#property indicator_buffers 1
#property indicator_color1 Blue

//---- input parameters
extern int       BB_Period=20;
extern double    Deviation=2.0;

double buf1[];
//double buf2[];
//double buf3[];
//double buf4[];


//+------------------------------------------------------------------+
//| Custom indicator initialization function                         |
//+------------------------------------------------------------------+
int init()
  {
   SetIndexStyle(0, DRAW_LINE, EMPTY, 2);
   IndicatorDigits(MarketInfo(Symbol(), MODE_DIGITS));
   SetIndexDrawBegin(0,BB_Period);
   SetIndexLabel(0,"BBandWidthRatio");
   SetIndexBuffer(0, buf1);
   return(0);
  }
//+------------------------------------------------------------------+
//| Custom indicator deinitialization function                       |
//+------------------------------------------------------------------+
int deinit()
  {
//----

//----
   return(0);
  }
//+------------------------------------------------------------------+
//| Custom indicator iteration function                              |
//+------------------------------------------------------------------+
int start()
  {
   int i, j;
   double ave, sko, sum;
   int counted_bars=IndicatorCounted();
   double MA, Up, Dn;

   if(Bars<=BB_Period) return(0);

   i=Bars-BB_Period;
   if(counted_bars>BB_Period) i=Bars-counted_bars-1;


   if (Bars<=BB_Period) return;

   for (i=Bars-BB_Period; i>=0; i--)
   {
//    buf2[i] = iMA(NULL,0,BB_Period,0,MODE_SMA,PRICE_CLOSE,i);
    MA = iMA(NULL,0,BB_Period,0,MODE_SMA,PRICE_CLOSE,i);
    sum = 0;
    for (j=0; j<BB_Period; j++) sum+=Close[i+j];
    ave = sum / BB_Period;
    sum = 0;
    for (j=0; j<BB_Period; j++) sum+=(Close[i+j]-ave)*(Close[i+j]-ave);
    sko = MathSqrt(sum / BB_Period);
//    buf4[i] = buf2[i]+(Deviation*sko);
//    buf3[i] = buf2[i]-(Deviation*sko);
    Up = MA+(Deviation*sko);
    Dn = MA-(Deviation*sko);
//    buf1[i] = 2*(Deviation*sko)/buf2[i];
    buf1[i] = 2*(Deviation*sko)/MA;

   }

    return(0);

  }
//+------------------------------------------------------------------+
Comments