BBandWidthRatio_alert_v03
Download script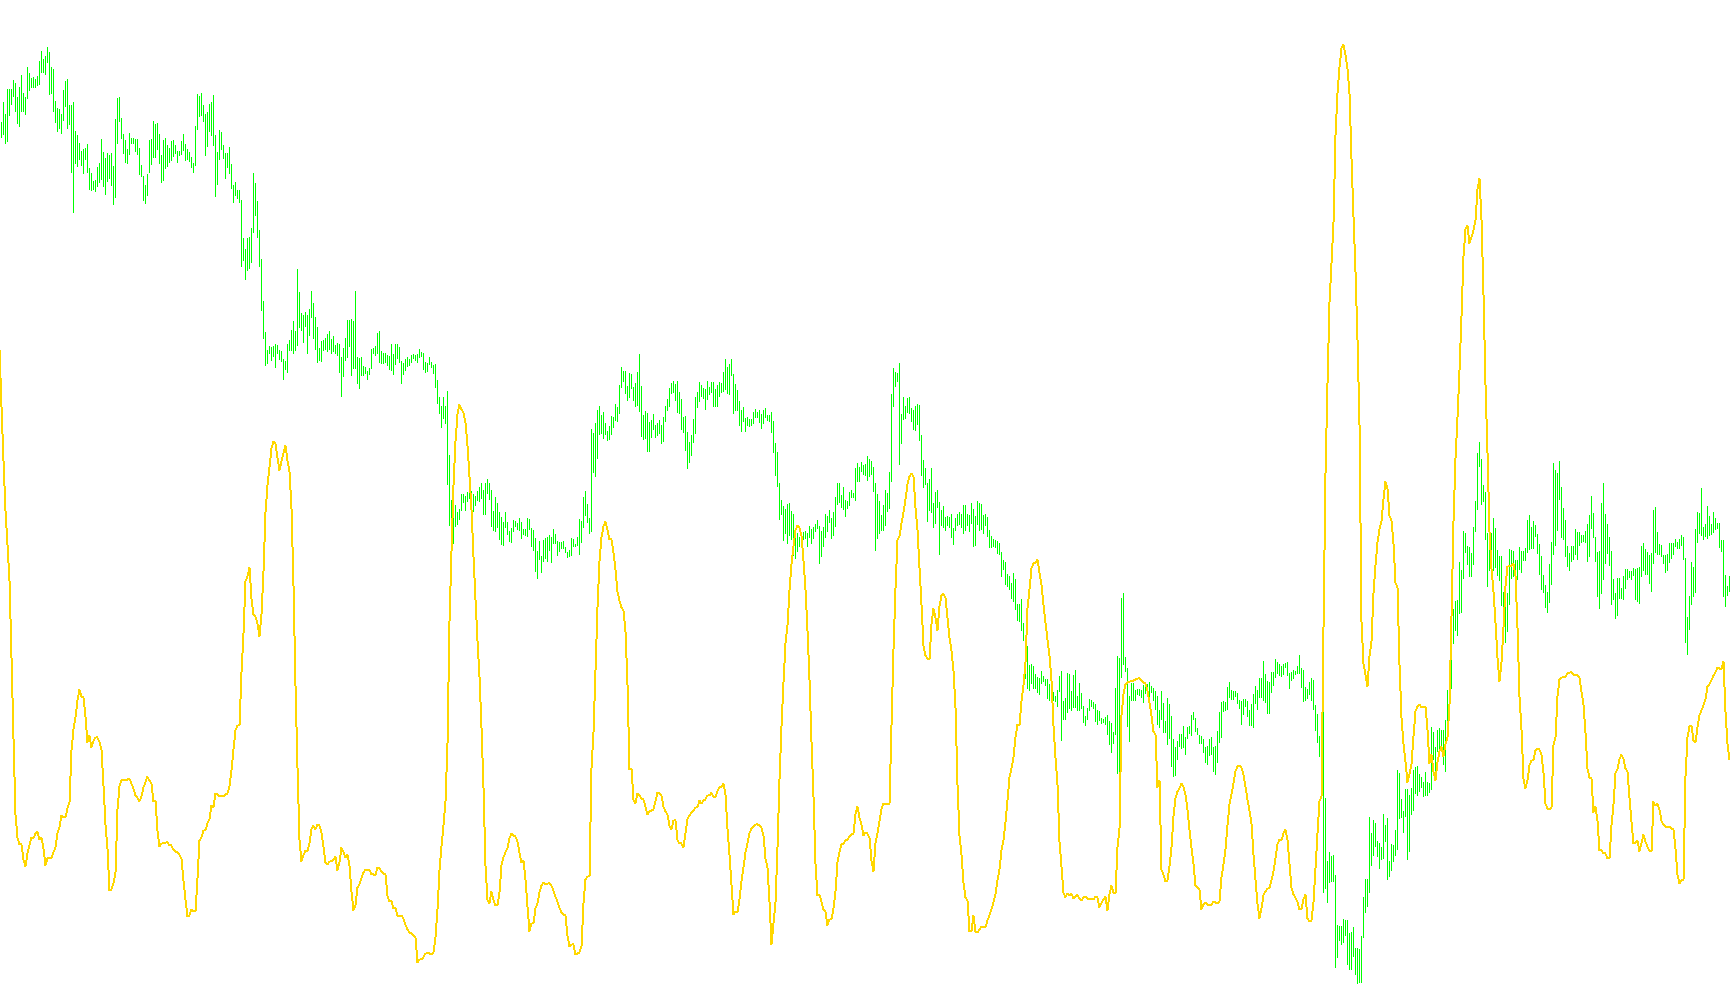
This tool is designed to analyze market volatility by measuring the relative width of Bollinger Bands compared to the current price movement. It helps traders identify periods where the market may be becoming unusually compressed or "squeezed," which often precedes significant price action.
How it Works
The logic follows a specific three-step process to interpret market behavior:
1. Calculating Market Volatility The script looks at a specific number of recent historical candles (defined by the Period). It calculates a Moving Average—which represents the "fair value" of the price—and determines the standard deviation, which measures how much the price is currently swinging away from that average.
2. Determining the Bandwidth Ratio Rather than simply showing you the width of the Bollinger Bands on your chart, this script converts that information into a specialized ratio. It calculates the distance between the upper and lower bands and divides it by the Moving Average.
- The Goal: This provides a standardized "Volatility Score." By converting the width into a ratio, the tool allows you to see if the market is tightening relative to its own history, regardless of whether the actual price is high or low.
3. Identifying Squeeze Opportunities The script compares this Volatility Score against a user-defined threshold.
- When the ratio falls below your chosen threshold, it indicates that the Bollinger Bands are tightening significantly (a "squeeze").
- The indicator provides visual feedback on a separate window to help you see these moments clearly.
Alerts and Notifications
To ensure you don't have to watch the chart constantly, the script includes an automated notification system. You can configure it to trigger two types of alerts:
- Visual Pop-ups: A text alert will appear on your screen when the market hits the squeeze threshold.
- Audio Alerts: An audible sound file can play to notify you of the price action in real-time.
The system is designed with "smart" logic to prevent notification spam; it tracks whether it has already alerted you for a specific squeeze, ensuring you only get notified once until the market expands again and resets.
//+------------------------------------------------------------------+
//|                                              BBandWidthRatio.mq4 |
//|                                                             Maji |
//+------------------------------------------------------------------+
//alertbyAkuma99FF
#property copyright "Maji"
#property link      "None"

#property indicator_separate_window
#property indicator_buffers 1
#property indicator_color1 Blue

//---- input parameters
extern int       BB_Period=20;
extern double    Deviation=2.0;
extern double    threshold=0.02;
extern int        delay=0;
extern bool       alertBox=false;
extern bool       audioAlert=false;

double buf1[];
//double buf2[];
//double buf3[];
//double buf4[];
bool alerted = false;
//+------------------------------------------------------------------+
//| Custom indicator initialization function                         |
//+------------------------------------------------------------------+
int init()
  {
   SetIndexStyle(0, DRAW_LINE, EMPTY, 2);
   IndicatorDigits(MarketInfo(Symbol(), MODE_DIGITS));
   SetIndexDrawBegin(0,BB_Period);
   SetIndexLabel(0,"BBandWidthRatio");
   SetIndexBuffer(0, buf1);

   SetLevelValue(0,threshold);

   return(0);
  }
//+------------------------------------------------------------------+
//| Custom indicator deinitialization function                       |
//+------------------------------------------------------------------+
int deinit()
  {
//----

//----
   return(0);
  }
//+------------------------------------------------------------------+
//| Custom indicator iteration function                              |
//+------------------------------------------------------------------+
int start()
  {
   int i, j;
   double ave, sko, sum;
   int counted_bars=IndicatorCounted();
   double MA, Up, Dn;

   if(Bars<=BB_Period) return(0);

   i=Bars-BB_Period;
   if(counted_bars>BB_Period) i=Bars-counted_bars-1;


   if (Bars<=BB_Period) return;

   for (i=Bars-BB_Period; i>=0; i--)
   {
//    buf2[i] = iMA(NULL,0,BB_Period,0,MODE_SMA,PRICE_CLOSE,i);
    MA = iMA(NULL,0,BB_Period,0,MODE_SMA,PRICE_CLOSE,i);
    sum = 0;
    for (j=0; j<BB_Period; j++) sum+=Close[i+j];
    ave = sum / BB_Period;
    sum = 0;
    for (j=0; j<BB_Period; j++) sum+=(Close[i+j]-ave)*(Close[i+j]-ave);
    sko = MathSqrt(sum / BB_Period);
//    buf4[i] = buf2[i]+(Deviation*sko);
//    buf3[i] = buf2[i]-(Deviation*sko);
    Up = MA+(Deviation*sko);
    Dn = MA-(Deviation*sko);
//    buf1[i] = 2*(Deviation*sko)/buf2[i];

    buf1[i] = 2*(Deviation*sko)/MA;


      // start edit | added by Akuma99 (http://www.beginnertrader.com)

      if (buf1[i+delay] <= threshold && alerted == false) {
         if (alertBox == true && i == 0) Alert("BBandWidthRatio warning for ", Symbol(), " on M", Period(), " chart!");
         if (audioAlert == true && i == 0) PlaySound("alert.wav");
         alerted = true;
      }

      if (alerted == true && buf1[0] > threshold) {
         alerted = false;
      }

      // end edit

   }

    return(0);

  }
//+------------------------------------------------------------------+
Comments