Barishpolets Channels v1.0.P_v2
Indicator

Barishpolets Channels v1.0.P_v2

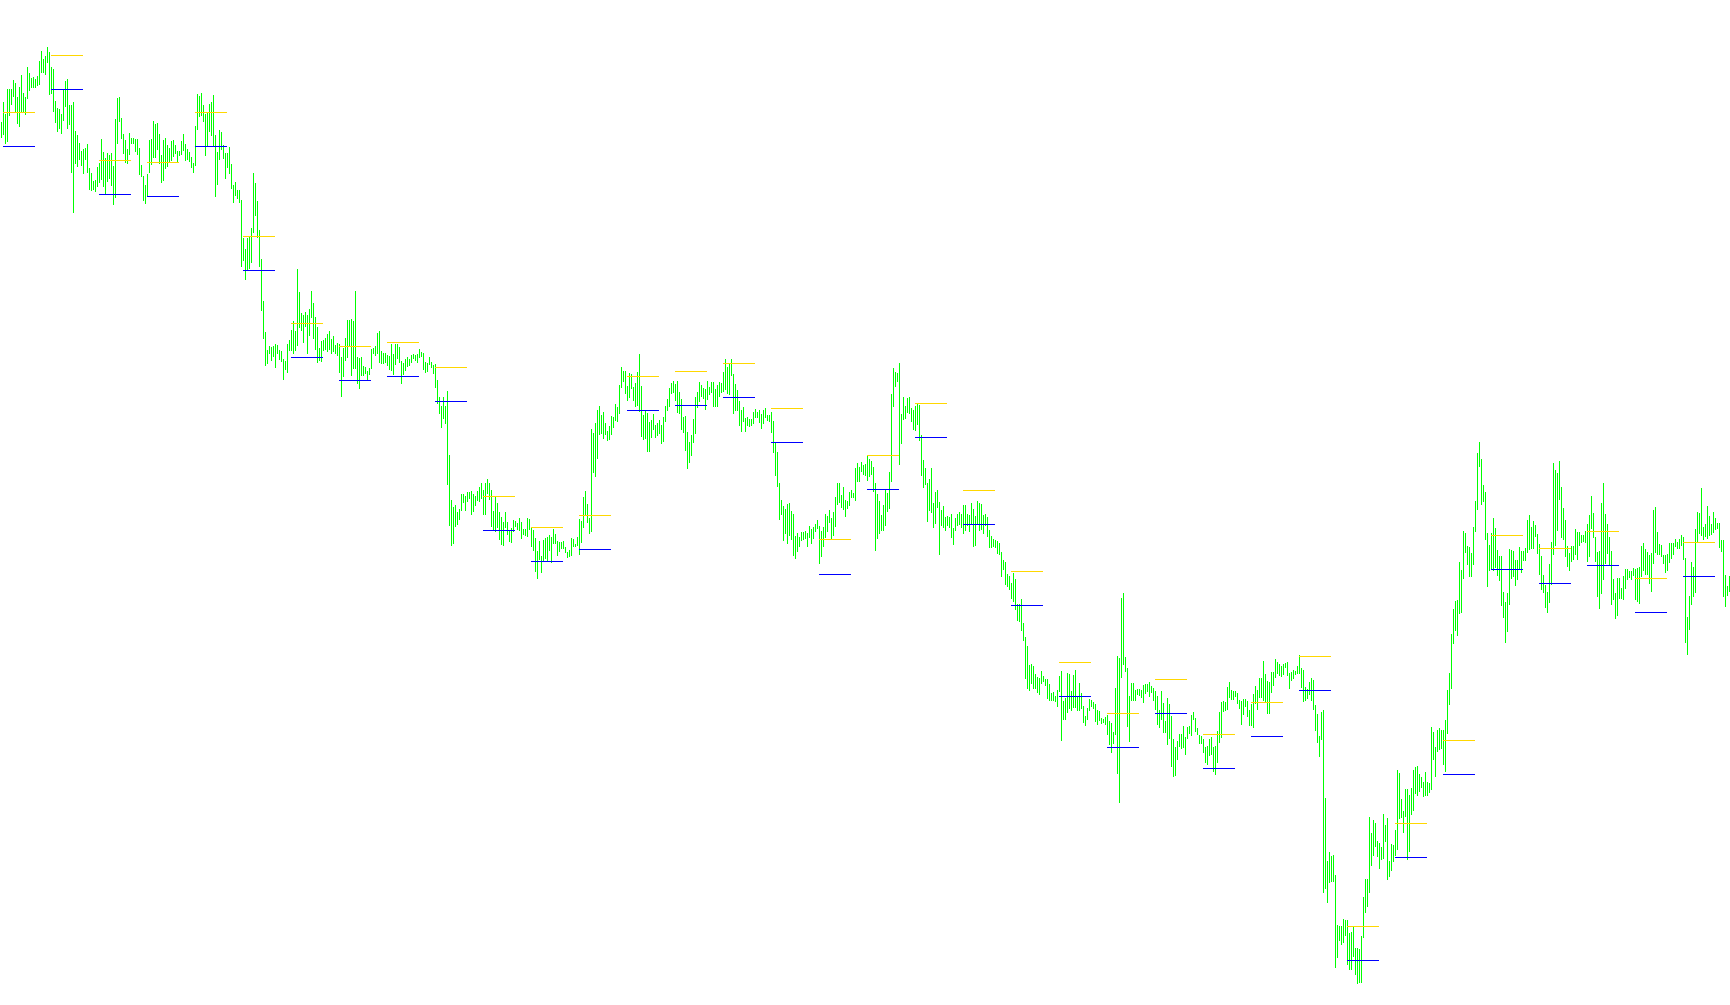
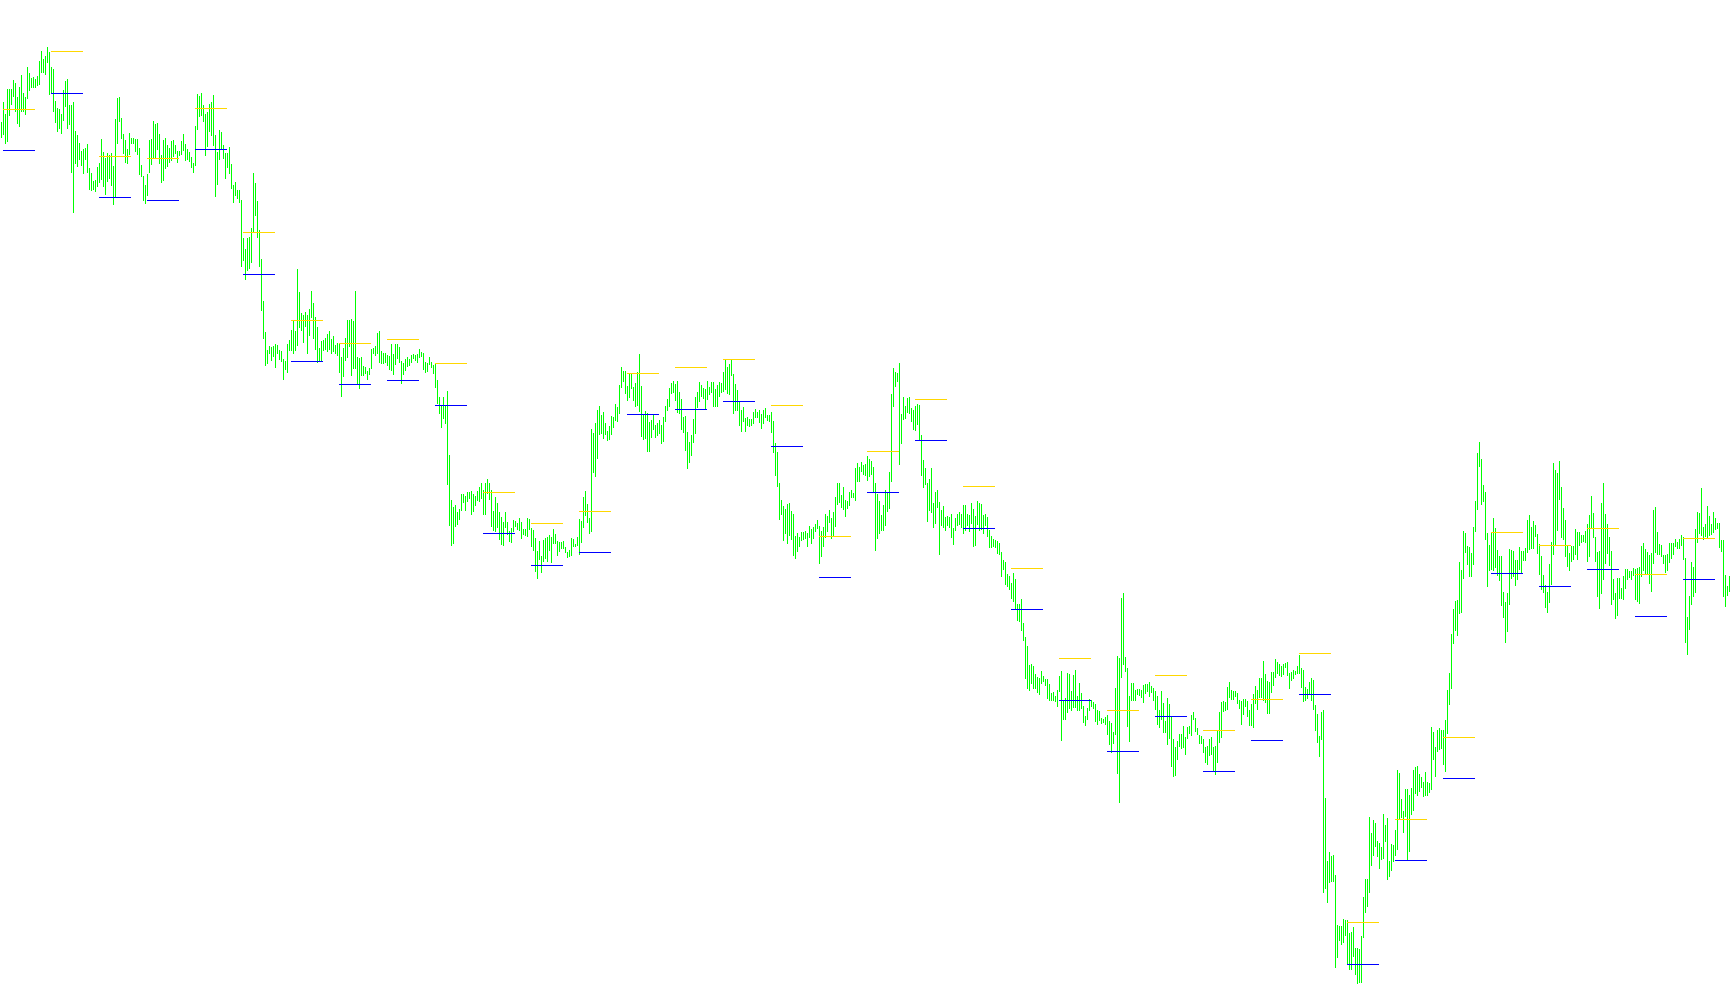
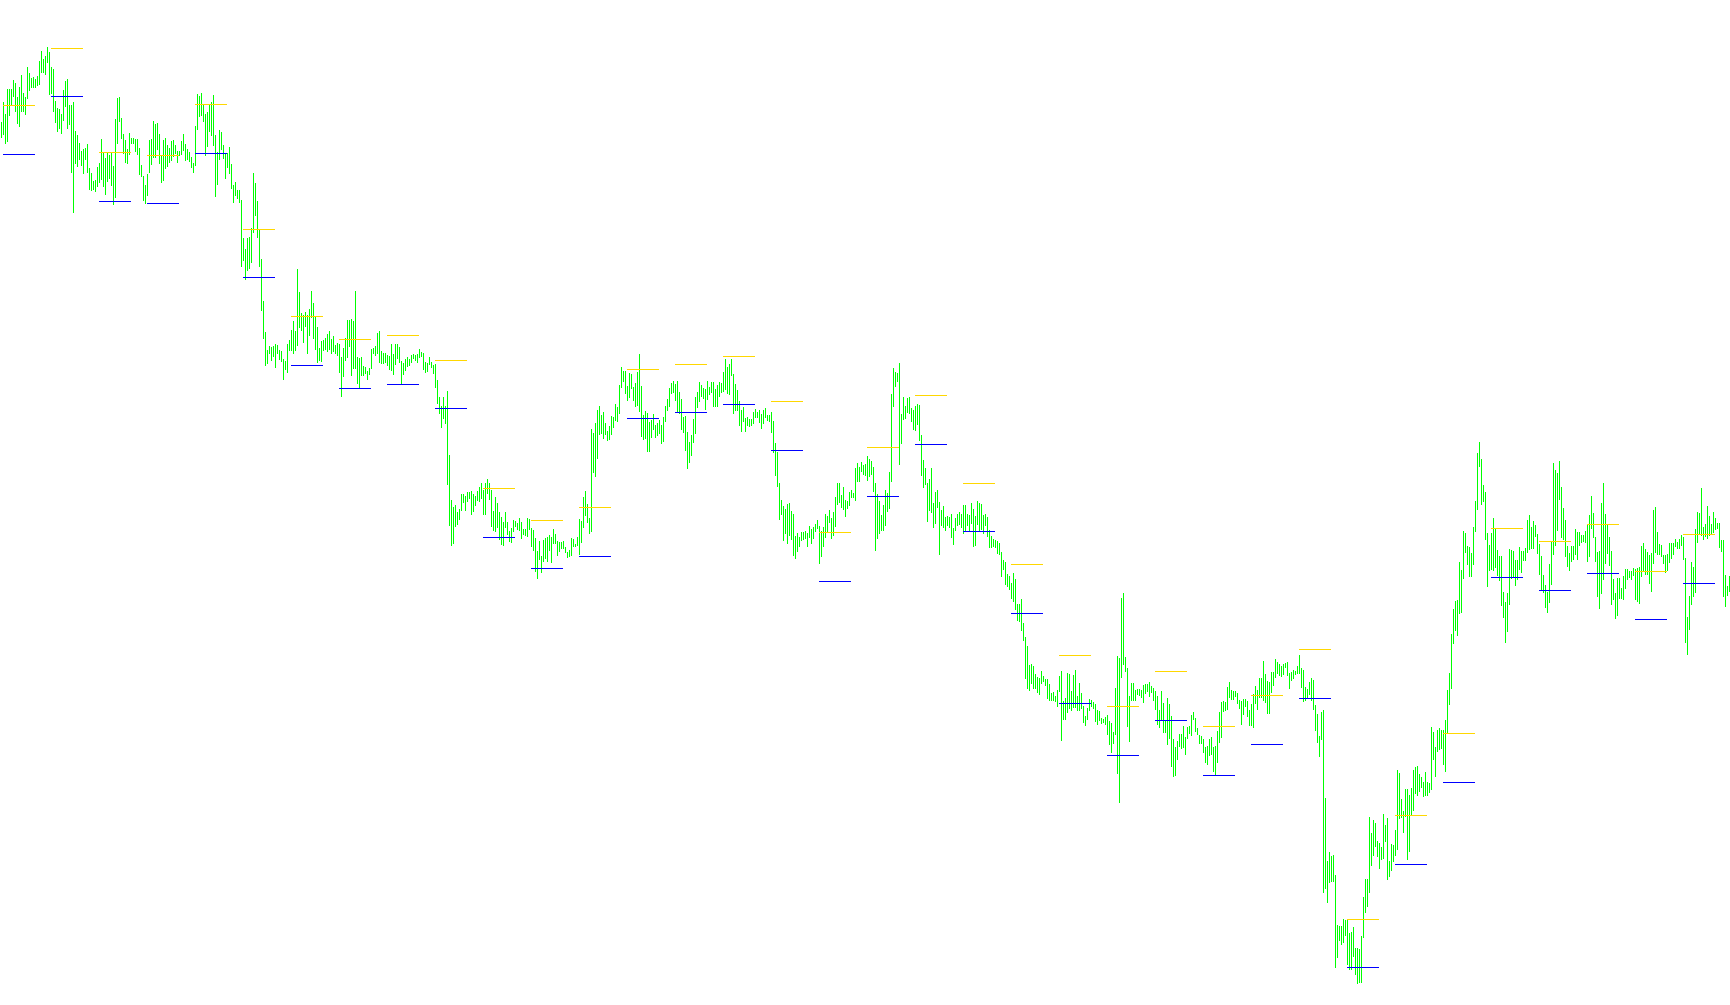
This indicator identifies trend dynamics by projecting linear channels based on recursive fractal pivot points and calculating equidistant equilibrium zones.

Barishpoltz Channel Fractals(Fix)
Indicator

Barishpoltz Channel Fractals(Fix)

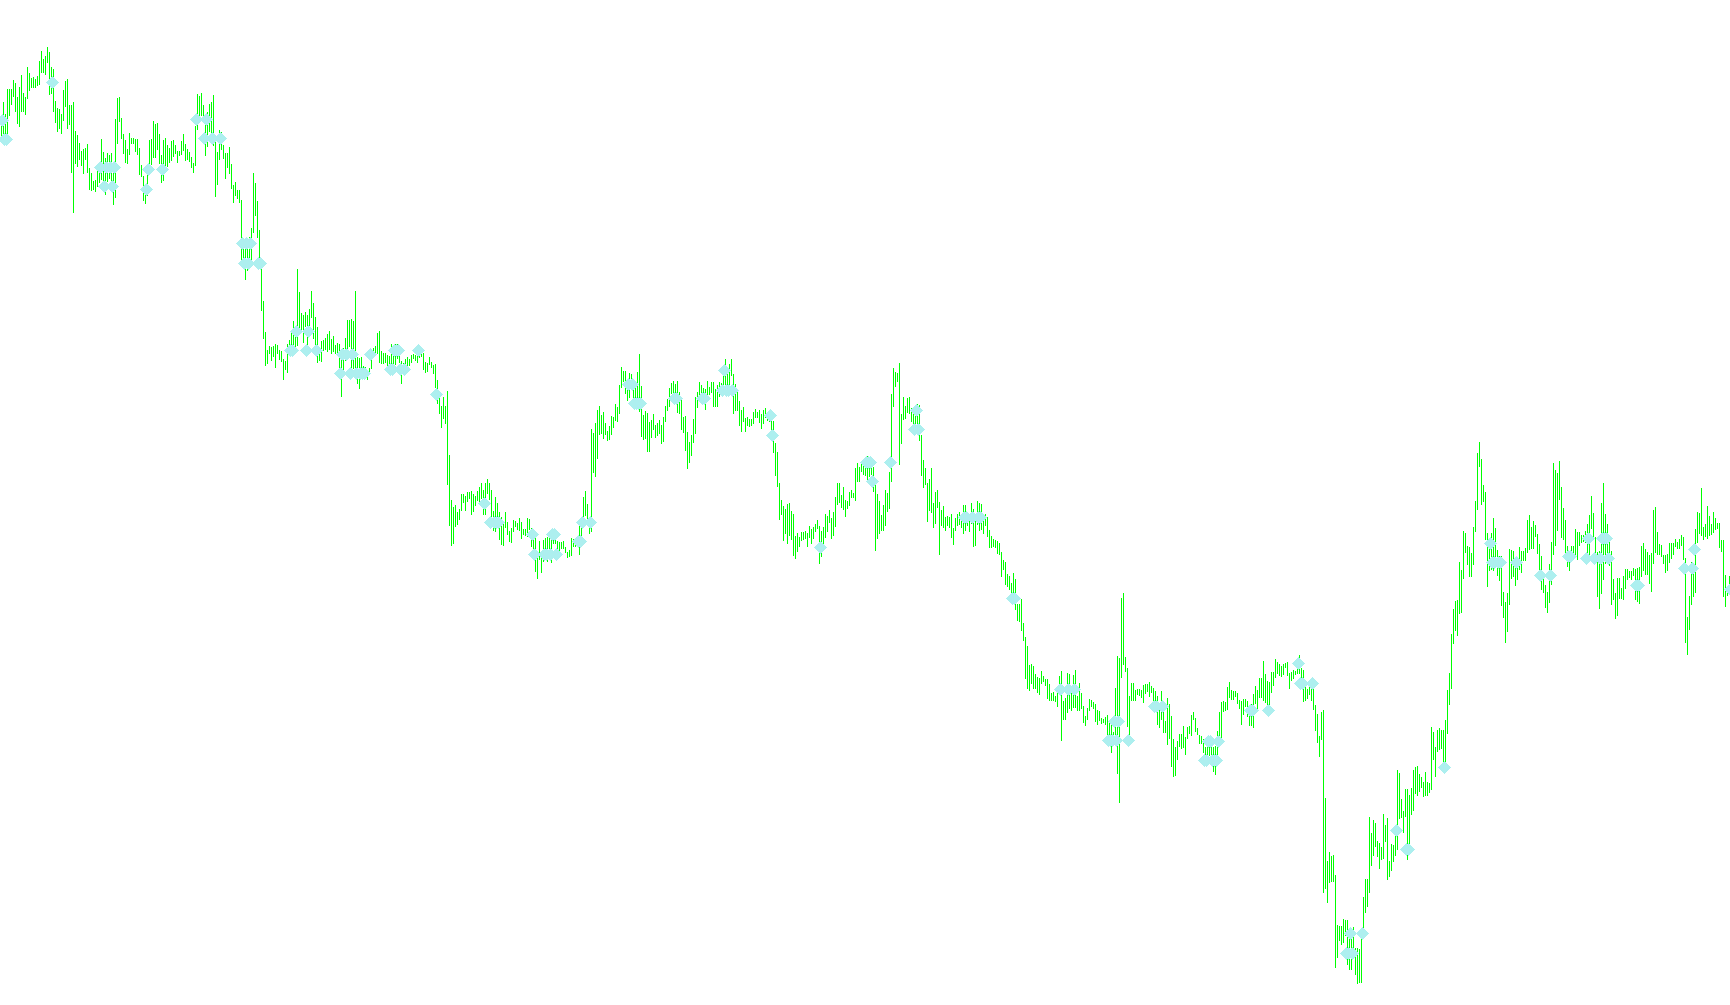
This indicator dynamically maps price boundaries by identifying valid fractal peaks and troughs to construct structural channels while filtering out noise via geometric overlap validation.

BarRange
Indicator

BarRange

This indicator quantifies individual candle price expansion by calculating the absolute distance between session highs and lows, projecting these numerical values directly onto the chart's lower boundaries.

BarRange2
Indicator

BarRange2

Identifies and displays the absolute point distance between high and low price extremes on each historical candle.

Indicator

Barros Swing

BarsC-O
Indicator

BarsC-O

This indicator identifies potential reversal points by detecting price candles whose real bodies exceed a predefined point-based threshold relative to the previous price action.

BarSize
Indicator

BarSize

iMA

This indicator identifies and plots candles whose price range exceeds the moving average of historical high-low spreads to highlight significant momentum shifts.

BarTimer
Indicator

BarTimer

This indicator visually renders the elapsed time progress of the current price candle as a percentage and segmented countdown string.

BarTimer_v1
Indicator

BarTimer_v1

This visual overlay calculates and displays the real-time progression of the current price bar by rendering a dynamic progress string and percentage completion based on period duration.

Indicator

bar_close_alarm_V1

Indicator

bar_close_alarm_V1_001

Bar_ytg_Alert_New_Bar
Indicator

Bar_ytg_Alert_New_Bar

This script monitors the temporal progression of price action to trigger instantaneous audible and visual notifications upon the emergence of a new candle.

Indicator

Base64

Basket2
Indicator

Basket2

This script dynamically generates a weighted synthetic price history by mathematically blending the OHLCV data of two distinct currency symbols into a single unified file.

basketEUR
Indicator

basketEUR

This indicator synthesizes price action from a basket of Euro-correlated pairs to generate smoothed Heiken Ashi components for trend identification.

Indicator

Basket_Profit_Alert2

Indicator

Basket_Profit_Alert2[1]

Indicator

Basket_Profit_Alert2[1]_v1

BAT ATR v1
Indicator

BAT ATR v1

iATR

This indicator dynamically plots support and resistance levels by calculating price offsets based on Average True Range volatility to capture trailing trend momentum.

BaterloutzSimmetric
Indicator

BaterloutzSimmetric

This algorithm employs a dual-pass recursive smoothing technique using trigonometric coefficients to generate a low-latency, high-precision trend signal.

BatFink (Home Line)
Indicator

BatFink (Home Line)

Identifies and projects high and low price extremes across specific time-based volatility windows to establish dynamic support and resistance levels.

BatFink (Line 1 and 2)
Indicator

BatFink (Line 1 and 2)

Dynamically maps and projects price extremes from predefined hourly windows across different time zones to establish automated supply and demand boundaries.

BatFink (StopLoss A)
Indicator

BatFink (StopLoss A)

Identifies specific intra-day volatility zones by calculating price extremes across predefined time blocks and projecting subsequent boundary offsets.

BatFink (StopLoss B)
Indicator

BatFink (StopLoss B)

Identifies specific price boundaries by calculating rolling highs and lows across multi-zone time intervals adjusted for global offsets.

BatFink (Target 1)
Indicator

BatFink (Target 1)

Dynamically identifies historical price extrema across specific time windows to project expanded support and resistance zones based on user-defined pip offsets.

BatFink (Target 2)
Indicator

BatFink (Target 2)

This indicator identifies specific intraday volatility windows to project dynamically adjusted price corridors based on historical opening and closing extremes.

BatFink (Target 3)
Indicator

BatFink (Target 3)

This indicator identifies specific time-based price corridors by calculating high and low extremes across predefined chronological intervals to project dynamic entry zones.

BatFink (Target 4)
Indicator

BatFink (Target 4)

This indicator dynamically identifies and plots price boundaries based on specific historical time segments within a day, projecting entry zones adjusted by a fixed pip offset.

Batfink Clock[1]
Indicator

Batfink Clock[1]

This indicator synchronizes and displays real-time clock data across multiple global financial hubs including London, Tokyo, New York, and GMT based on broker offset adjustments.

BatFink Daily High-Low
Indicator

BatFink Daily High-Low

This indicator identifies and plots the previous day's high and low price levels onto the current intraday chart to establish key structural boundaries.

Indicator

BatFink Month High-Low[1]

BatFink Pattern Recognition
Indicator

BatFink Pattern Recognition

This indicator systematically scans historical and real-time price action to detect and label specific bullish and bearish candlestick formations based on open, high, low, and close price relationships.

Batfink Signal (Line 1 and 2)
Indicator

Batfink Signal (Line 1 and 2)

This indicator identifies intraday liquidity thresholds by projecting price boundaries from specific time windows and signaling entry alerts when market action breaches these dynamically calculated levels.

Batfink Signal (Stoploss A)
Indicator

Batfink Signal (Stoploss A)

This indicator identifies specific price breakouts by dynamically projecting high and low volatility zones derived from predefined historical time segments across different timezones.

Batfink Signal (Stoploss B)
Indicator

Batfink Signal (Stoploss B)

Identifies dynamic support and resistance levels by calculating price extremes across specific hourly windows and generating alerts on subsequent pips-based breaches.

Batfink Signal (Target 1)
Indicator

Batfink Signal (Target 1)

Identifies expansionary price action by detecting breaches of volatility zones calculated from specific time-bound trading sessions.

Batfink Signal (Target 2)
Indicator

Batfink Signal (Target 2)

This indicator identifies specific price volatility zones based on pre-defined intraday time blocks and triggers visual alerts when the market breaks outside of these dynamically calculated bounds.

Batfink Signal (Target 3)
Indicator

Batfink Signal (Target 3)

This indicator identifies institutional supply and demand zones by calculating price extremes across specific time windows and plotting breakout signals when market price breaches defined pip-based buffers.

Batfink Signal (Target 4)
Indicator

Batfink Signal (Target 4)

This indicator identifies specific price breakout signals by monitoring volatility zones established during predefined temporal windows and alerting on expansion beyond a set pip distance.

BatFink Trend Change Indicator Alert
Indicator

BatFink Trend Change Indicator Alert

This indicator quantifies price velocity using a weighted normalized range calculation transformed through a logarithmic scale to identify directional shifts.

BatFink Trend Change Indicator
Indicator

BatFink Trend Change Indicator

This indicator identifies structural shifts by calculating a smoothed price-to-range ratio transformed through a logarithmic scale to detect trend reversals.

BatMA
Indicator

BatMA

This indicator provides a versatile technical analysis tool that calculates five distinct types of moving averages—SMA, EMA, SMMA, LWMA, and BatEMA—based on user-defined weighted methodologies.

Indicator

BatMA_23poleGF

iMA
BatMA_MAx23poleGF
Indicator

BatMA_MAx23poleGF

iMA

This indicator applies a multi-pole Gaussian smoothing algorithm to standard moving average data to reduce noise and enhance price signal clarity.

BatMA_v1
Indicator

BatMA_v1

This indicator provides a versatile toolkit for calculating five distinct moving average types including SMA, EMA, SMMA, LWMA, and BatMA to analyze price momentum.

BAT_ATRv1
Indicator

BAT_ATRv1

iATR

This indicator dynamically tracks price momentum by calculating asymmetrical support and resistance boundaries based on the Average True Range to lock in profits during trending moves.

BB - HL
Indicator

BB - HL

iMA

This indicator dynamically constructs price boundaries by calculating standard deviations derived from the maximum squared variance between high and low extremes relative to a moving average.

BB - HL_v1
Indicator

BB - HL_v1

iMA

This indicator constructs dynamic volatility bands by calculating the maximum squared difference between price extremes and a median-based moving average.

BBand Stop Alert
Indicator

BBand Stop Alert

iBands
BBands Stops Bar
Indicator

BBands Stops Bar

iBands