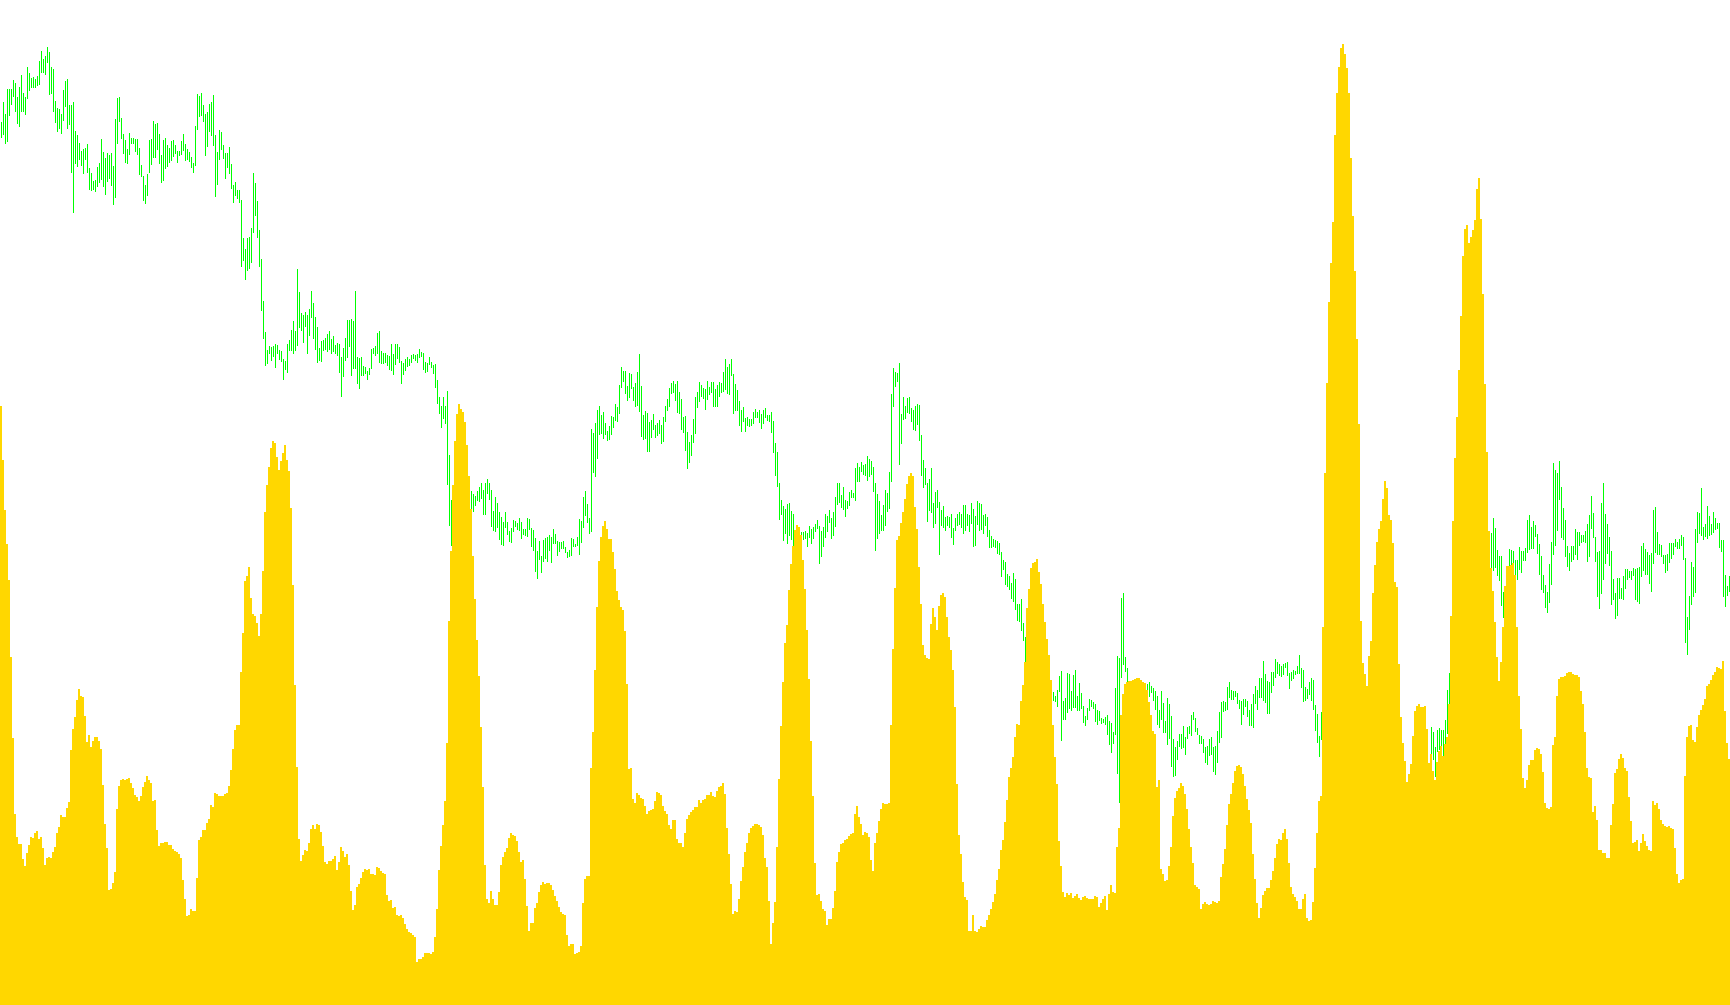
This technical indicator is designed to measure and visualize the relative "expansion" or "contraction" of market volatility. Instead of showing you the raw price of an asset, it provides a specialized ratio that helps identify periods of high activity compared to the prevailing average.
Core Logic & Methodology
The script operates by analyzing the relationship between three primary mathematical components:
1. The Moving Average (The Baseline) The tool first establishes a steady baseline by calculating a Simple Moving Average (SMA) over a specific number of bars (default is 20). This represents the "middle" price level of the market during that period.
2. Standard Deviation (The Volatility Measurement) Next, the logic calculates the "Standard Deviation." In simple terms, this measures how much the actual price swings away from the baseline average. If the price stays very close to the average, the deviation is low; if the price makes large, aggressive swings, the deviation is high.
3. The Bandwidth Ratio (The Final Calculation) Unlike standard Bollinger Bands—which show you the visual "envelope" of price—this script calculates a unique ratio. It takes the total width of that volatility envelope (the distance between the upper and lower bounds) and divides it by the average price.
What this means for the user
The result is displayed as a histogram in a separate window on your chart. Here is how to interpret the logic:
- High Ratio Values: When the histogram spikes, it indicates that the market's current volatility is significantly larger than usual relative to its price. This often suggests a "breakout" phase or a period of intense price discovery.
- Low Ratio Values: When the histogram stays low and compressed, it indicates a "consolidation" phase where the market is moving sideways with very little variance.
By using this ratio, the tool effectively "normalizes" the data. This allows you to see volatility clearly regardless of whether the asset price is very high or very low, making it easier to spot significant movements across different types of charts.
//+------------------------------------------------------------------+
//|                                              BBandWidthRatio.mq4 |
//|                                                             Maji |
//+------------------------------------------------------------------+
#property copyright "Maji"
#property link      "None"

#property indicator_separate_window
#property indicator_buffers 1
#property indicator_color1 Blue

//---- input parameters
extern int       BB_Period=20;
extern double    Deviation=2.0;

double buf1[];
//double buf2[];
//double buf3[];
//double buf4[];


//+------------------------------------------------------------------+
//| Custom indicator initialization function                         |
//+------------------------------------------------------------------+
int init()
  {
   SetIndexStyle(0, DRAW_HISTOGRAM, EMPTY, 2);
   IndicatorDigits(MarketInfo(Symbol(), MODE_DIGITS));
   SetIndexDrawBegin(0,BB_Period);
   SetIndexLabel(0,"BBandWidthRatio");
   SetIndexBuffer(0, buf1);
   return(0);
  }
//+------------------------------------------------------------------+
//| Custom indicator deinitialization function                       |
//+------------------------------------------------------------------+
int deinit()
  {
//----

//----
   return(0);
  }
//+------------------------------------------------------------------+
//| Custom indicator iteration function                              |
//+------------------------------------------------------------------+
int start()
  {
   int i, j;
   double ave, sko, sum;
   int counted_bars=IndicatorCounted();
   double MA, Up, Dn;

   if(Bars<=BB_Period) return(0);

   i=Bars-BB_Period;
   if(counted_bars>BB_Period) i=Bars-counted_bars-1;


   if (Bars<=BB_Period) return;

   for (i=Bars-BB_Period; i>=0; i--)
   {
//    buf2[i] = iMA(NULL,0,BB_Period,0,MODE_SMA,PRICE_CLOSE,i);
    MA = iMA(NULL,0,BB_Period,0,MODE_SMA,PRICE_CLOSE,i);
    sum = 0;
    for (j=0; j<BB_Period; j++) sum+=Close[i+j];
    ave = sum / BB_Period;
    sum = 0;
    for (j=0; j<BB_Period; j++) sum+=(Close[i+j]-ave)*(Close[i+j]-ave);
    sko = MathSqrt(sum / BB_Period);
//    buf4[i] = buf2[i]+(Deviation*sko);
//    buf3[i] = buf2[i]-(Deviation*sko);
    Up = MA+(Deviation*sko);
    Dn = MA-(Deviation*sko);
//    buf1[i] = 2*(Deviation*sko)/buf2[i];
    buf1[i] = 2*(Deviation*sko)/MA;

   }

    return(0);

  }
//+------------------------------------------------------------------+
Comments