AwesomeFxTradera
Indicator

AwesomeFxTradera

iMA

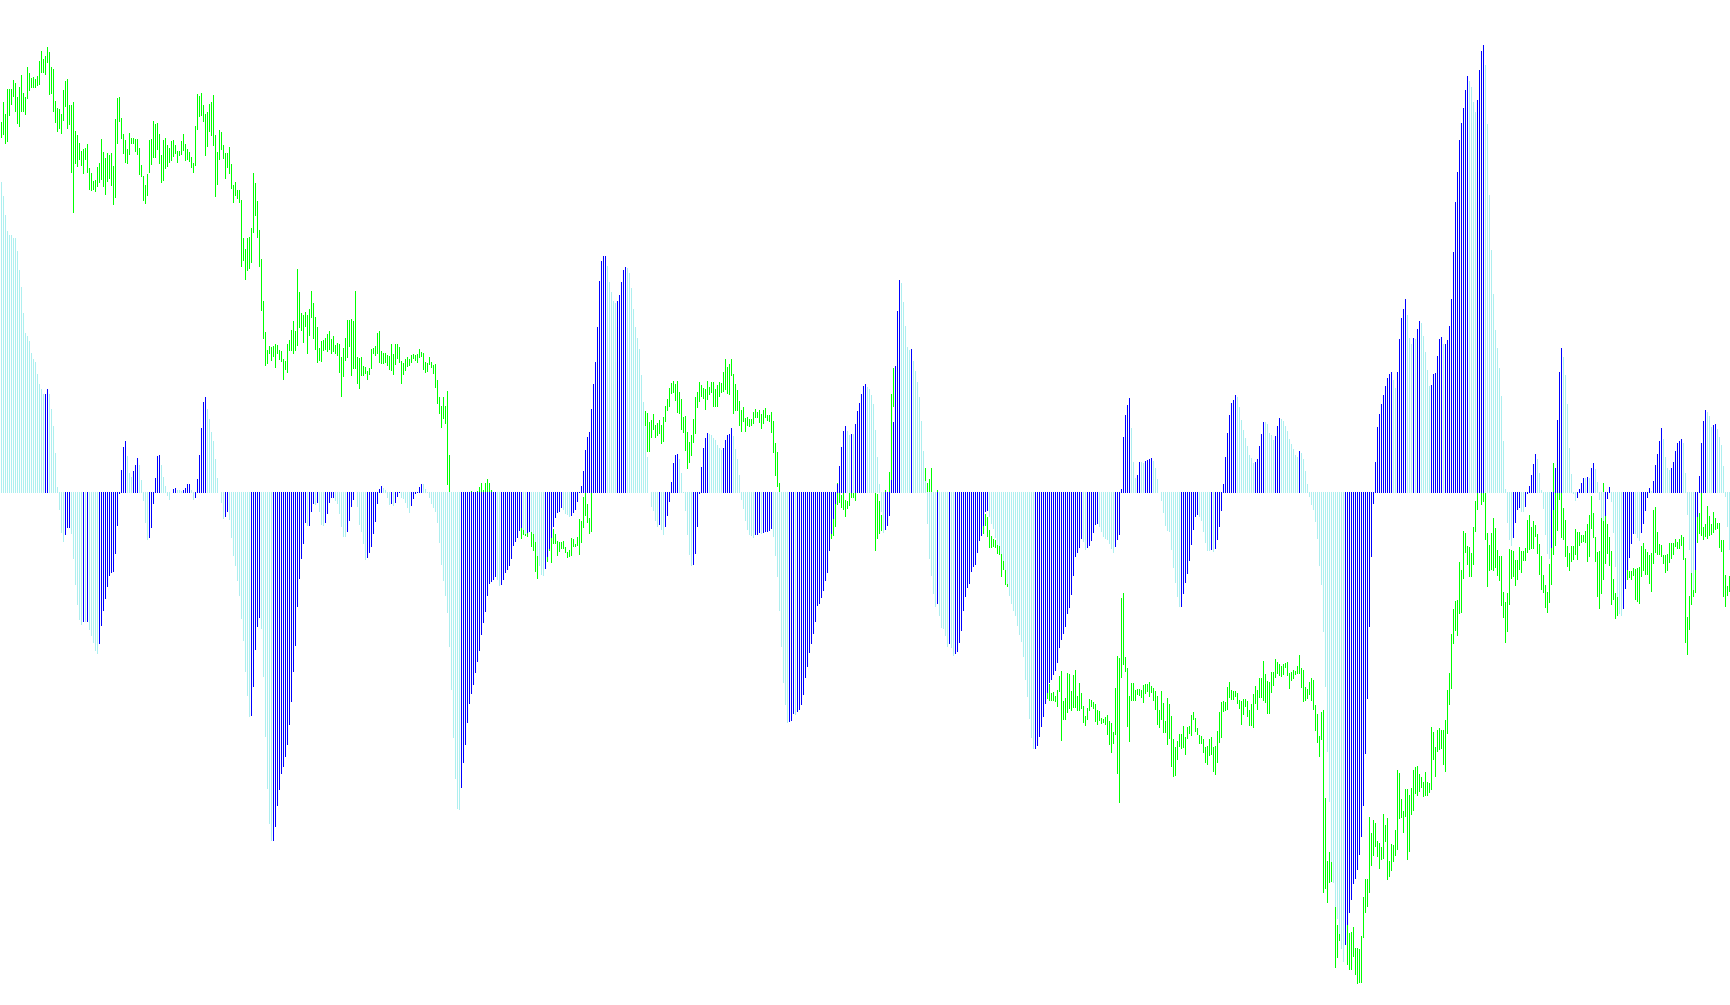
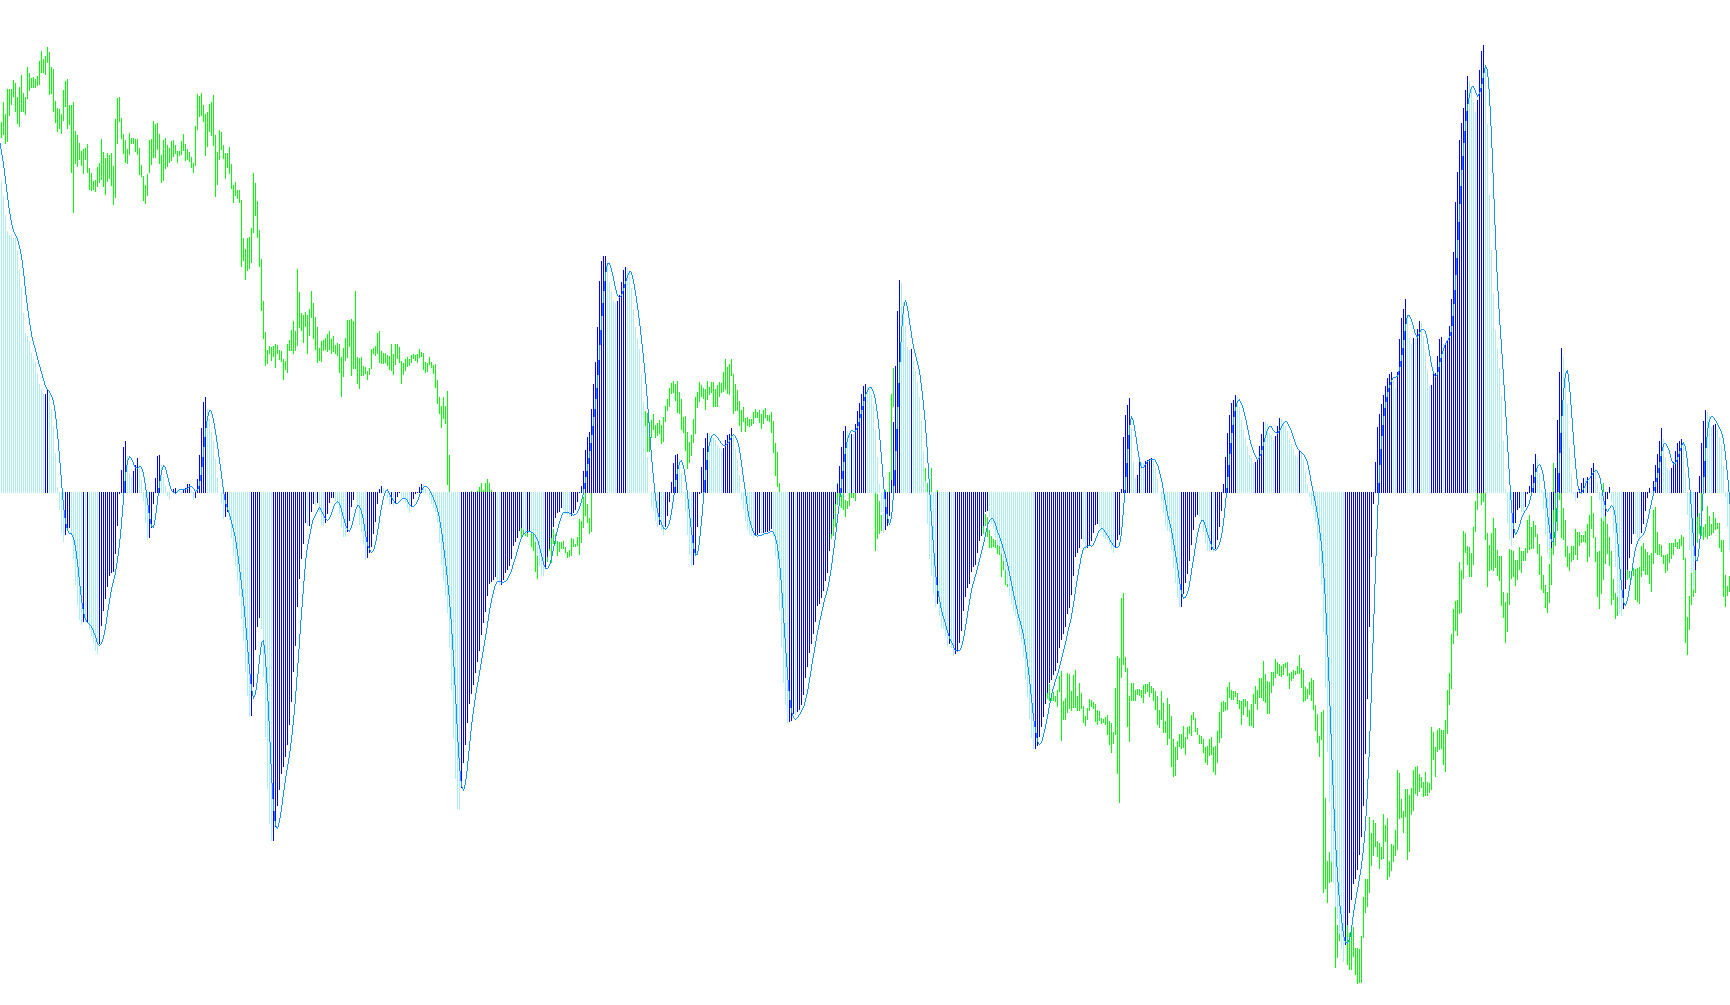
This indicator visualizes the directional velocity of price momentum by calculating the differential between two exponential moving averages and segregating them into contrasting histogram bars.
Awesome_(AO)_mtf
Indicator

Awesome_(AO)_mtf

iMA

This indicator calculates the difference between two simple moving averages across specific higher timeframes to visualize momentum shifts via a dual-color histogram.

Awesome_001
Indicator

Awesome_001

iMA

This indicator quantifies market momentum by calculating the variance between two simple moving averages and visualizing directional shifts through a dual-color histogram.

Awesome_Signal
Indicator

Awesome_Signal

iMAiMAOnArray

This indicator calculates the momentum differential between simple and weighted moving averages to generate visual histograms and a smoothed signal line for trend exhaustion identification.

Awesome_Signal_v1
Indicator

Awesome_Signal_v1

iMAiMAOnArray

This indicator calculates the differential between dual moving averages to identify momentum shifts and visualizes price velocity through histogram peaks and a smoothed signal line.

Awesome_v1
Indicator

Awesome_v1

iMA

The logic calculates the difference between two simple moving averages to visualize price momentum shifts and trend exhaustion through a dual-colored histogram.

awesome_v2
Indicator

awesome_v2

iMA

This indicator quantifies price velocity by calculating the difference between 5-period and 34-period simple moving averages, visualized as a dual-colored momentum histogram.

Awesome_v3
Indicator

Awesome_v3

iMA

This indicator calculates the difference between two simple moving averages to visualize price momentum and identifies directional shifts through color-coded histogram bars.

awo Holidays
Indicator

awo Holidays

Dynamically visualizes market sessions by plotting trend lines and on-screen text to distinguish between standard trading days, weekends, and specific regional holidays sourced from external data.

Axel-Pivot
Indicator

Axel-Pivot

This indicator dynamically calculates and renders distinct Pivot Point levels for Asia, Europe, and USA sessions by aggregating historical highs, lows, and closing prices from specific chronological windows.

azzx_larry6
Indicator

azzx_larry6

This indicator identifies and visualizes hierarchical market extrema by recursively filtering sequential price peaks and troughs to construct optimized multi-layer zigzag trajectories.

A_GMMA Long
Indicator

A_GMMA Long

iMA

This indicator visualizes a sequence of eight Exponential Moving Averages with decreasing periods to identify trend momentum and structural density.

A_GMMA Short
Indicator

A_GMMA Short

iMA

This indicator plots eight distinct Exponential Moving Averages of varying periods to visualize price momentum and trend convergence.

a_Nina
Indicator

a_Nina

This indicator synthesizes signals from the 'aNina' external logic across specific timeframe shifts to project directional buy and sell markers based on historical price boundaries.

a_Nina_v1
Indicator

a_Nina_v1

This indicator captures and projects directional buy and sell signals from a higher timeframe onto the current chart by interfacing with the 'aNina' custom logic.

a_ZZ
Indicator

a_ZZ

This indicator identifies structural swing points and detects momentum-driven breakouts by comparing real-time price action against historical fractal peaks and troughs.

B&WImp-T01
Indicator

B&WImp-T01

The algorithm quantifies cumulative bullish and bearish price action over a defined lookback period, applying an exponential moving average filter to extract smoothed momentum trends.

Indicator

b-clock modified LA Silver

Indicator

b-clock modified LA Silver_v1

Indicator

b-clock modified

Indicator

b-clock modified_v1

b-clock modified_v2
Indicator

b-clock modified_v2

Calculates and displays the precise remaining temporal duration until the current candlestick expires.

Indicator

b-clock

Indicator

b-clockL_mtf

Indicator

b-clockN_mtf

Indicator

b-clock_(h-m-s)

Indicator

b-clock_modified

Indicator

b-clock_TRO_MODIFIED_VERSION

BagavinoBar
Indicator

BagavinoBar

iRSI

This MetaTrader indicator displays directional arrows based on RSI values calculated across multiple user-defined timeframes, visually indicating potential trend alignment or divergence.

Ball
Indicator

Ball

iMA

This indicator calculates the relative position of price action within Bollinger Bands to quantify momentum intensity and proximity to historical volatility boundaries.

Bal_Eq_Ind
Indicator

Bal_Eq_Ind

This indicator reconstructs a retroactive growth curve by calculating fluctuating floating profits and cumulative realized gains from historical trade data.

Bal_Eq_Ind_v1
Indicator

Bal_Eq_Ind_v1

This indicator reconstructs and visualizes the chronological progression of account balance and floating equity by calculating cumulative profits from historical trades and active positions.

Bands Level
Indicator

Bands Level

iMA

This indicator calculates rolling standard deviations from a Simple Moving Average to project upper and lower price boundaries with real-time horizontal level synchronization.

Bands+Fibo_True
Indicator

Bands+Fibo_True

iATRiMA

This indicator dynamically maps price action by projecting multiple Fibonacci-weighted expansion levels based on the Average True Range around a Simple Moving Average.

Bands
Indicator

Bands

iMA

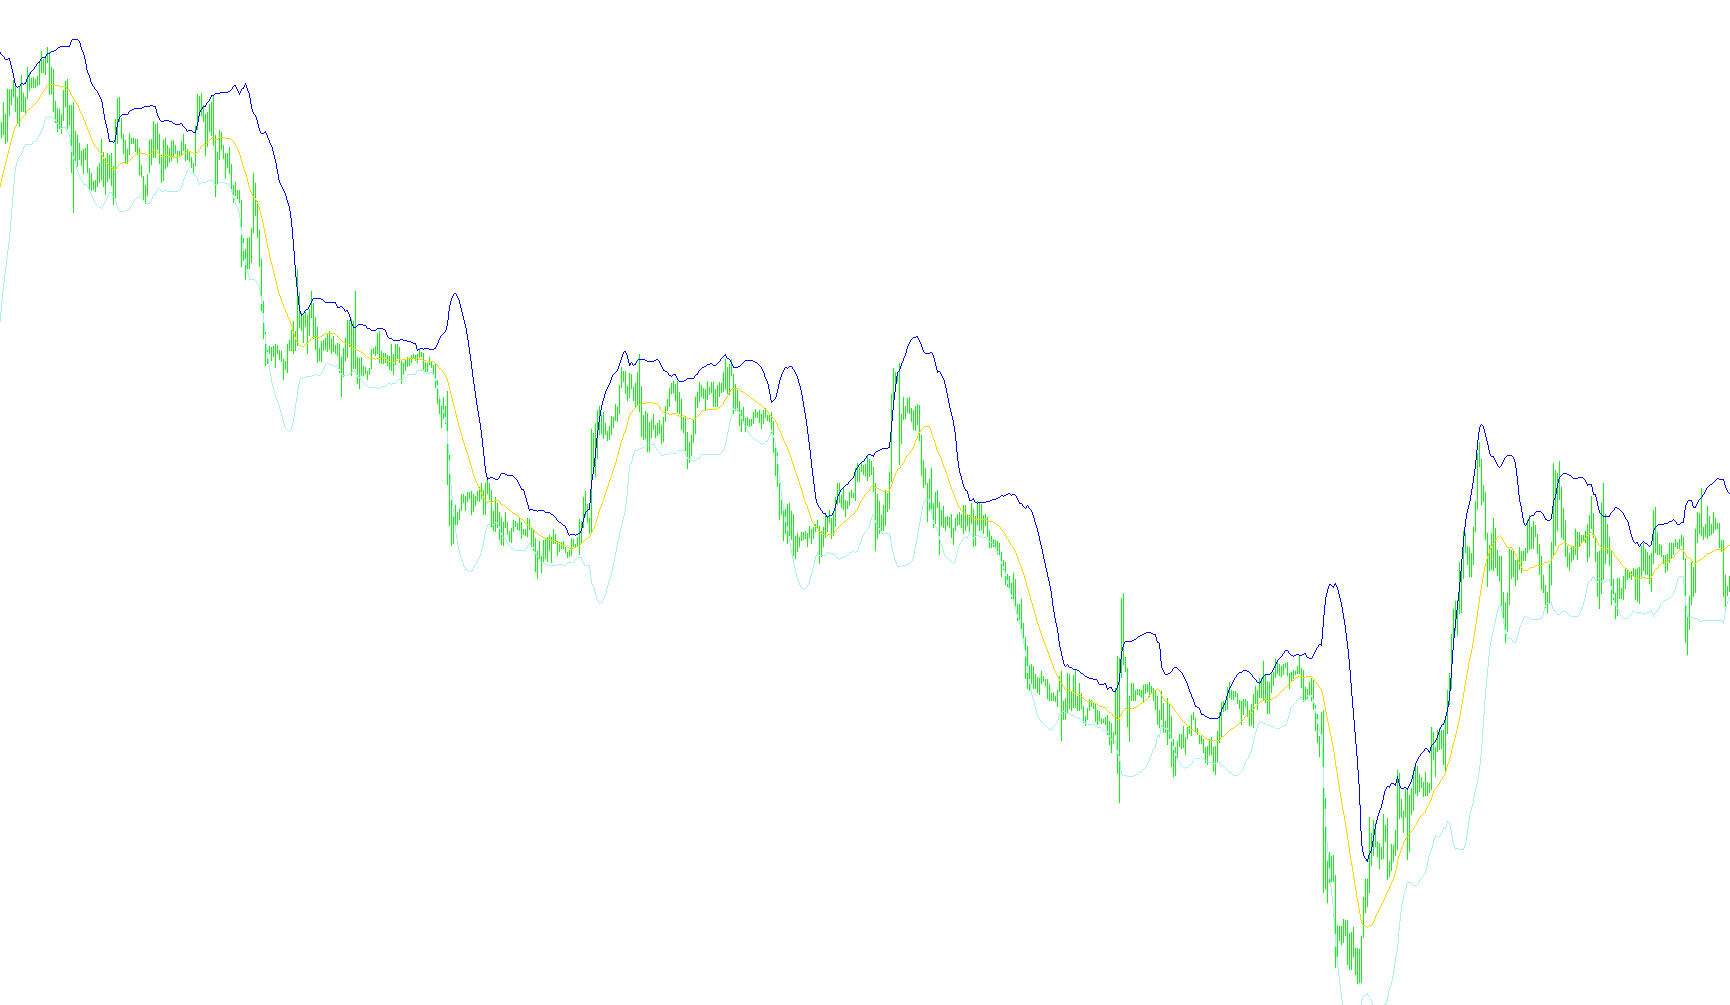
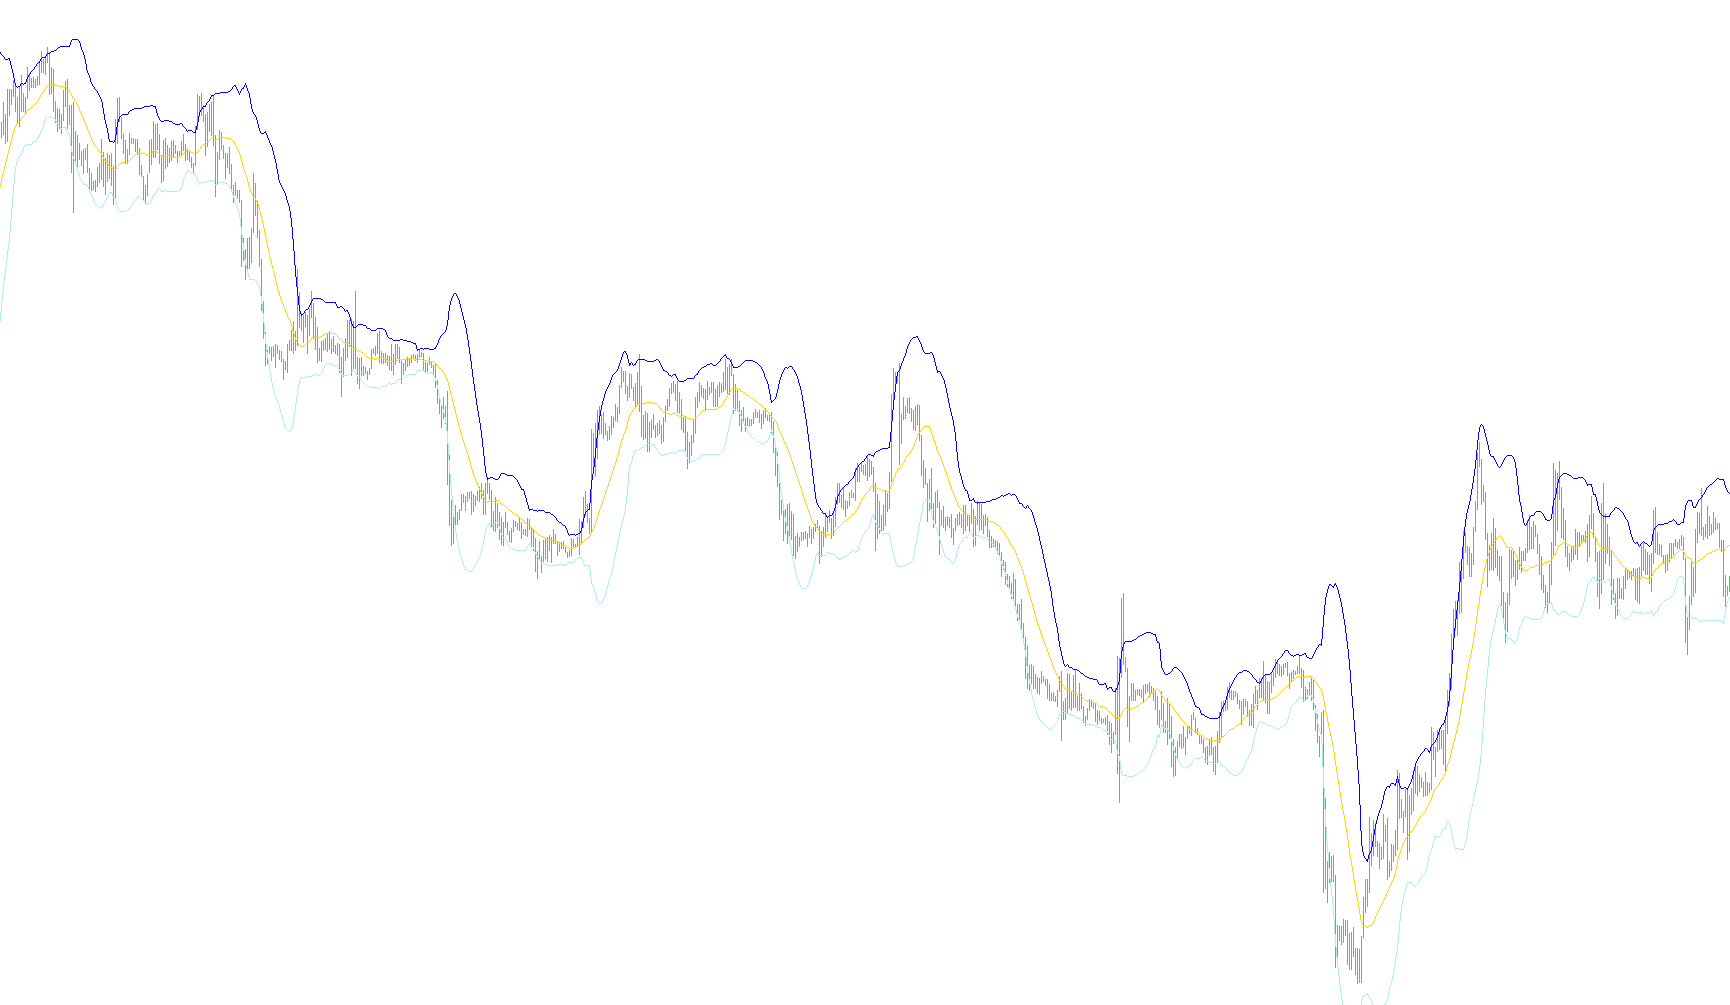
This indicator calculates a central simple moving average and projects upper and lower boundaries based on the geometric variance of price action over a specified period.

BandsBandwidth
Indicator

BandsBandwidth

iMA

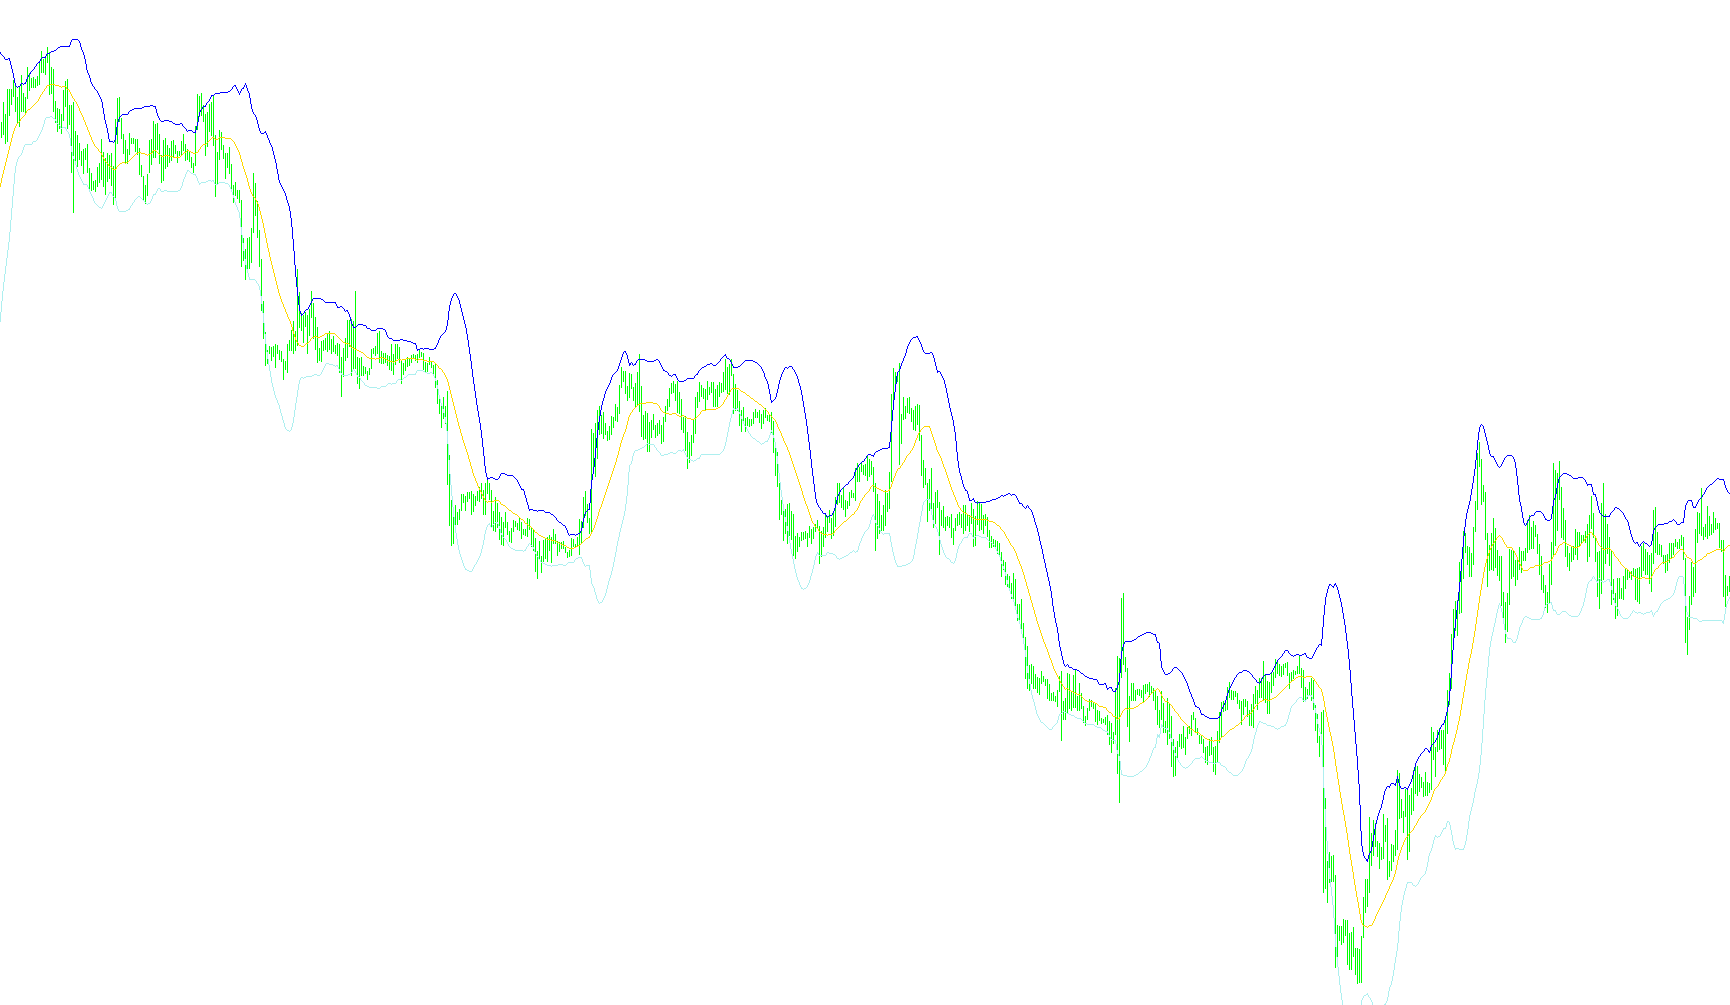
This indicator quantifies market volatility by calculating the absolute distance between upper and lower Bollinger Bands and normalizing the result into a numerical breadth value.

BandsBandwidth2
Indicator

BandsBandwidth2

iMA

This indicator quantifies market volatility by calculating the mathematical spread between upper and lower Bollinger Band boundaries as a localized numerical value.

BandsLSMA_v1
Indicator

BandsLSMA_v1

This indicator calculates a linear regression-based moving average as the baseline to generate volatility bands based on standard deviation variance.

BandsLSMA_v2
Indicator

BandsLSMA_v2

This indicator calculates a least squares moving average as a central trend line and establishes dynamic boundaries based on the standard deviation of price variance.

BandsMA
Indicator

BandsMA

iMA

This indicator calculates dynamic price envelopes by applying selectable moving average types—including Linear Regression—to determine standard deviation bands around a central trendline.

BandsMA2dev
Indicator

BandsMA2dev

iMA

This indicator calculates multi-layered volatility bands based on customizable moving average types, including Least Squares and Linear Regression, to identify price extremes.

BandsMA_2dev
Indicator

BandsMA_2dev

iMA

This indicator calculates dual volatility envelopes based on customizable moving averages—including SMA, EMA, SMMA, LWMA, and LSMA—applied to multiple price types with user-defined standard deviation offsets.

Bands_001
Indicator

Bands_001

iMA

This indicator calculates a central moving average and projects upper and lower boundaries based on the standard deviation of price fluctuations over a specific period.

Bands_v1
Indicator

Bands_v1

iMA

Calculates dynamic price boundaries by layering standard deviation variance over a simple moving average to identify extreme market extremes.

Bands_v2
Indicator

Bands_v2

iMA

This indicator maps price fluctuations by calculating a simple moving average baseline complemented by dynamic standard deviation boundaries to identify extreme market extremes.

Bands_v3
Indicator

Bands_v3

iMA

This indicator calculates a rolling simple moving average and constructs upper and lower boundaries based on the standard deviation of price variance over a specified timeframe.

Indicator

Bandwidth Indicator

iBands
barComplete
Indicator

barComplete

Dynamically renders a real-time geometric representation of the elapsed duration relative to the current candlestick's total timeframe.

Barishpolets Channels v1.0.P
Indicator

Barishpolets Channels v1.0.P

This indicator identifies significant price peaks and troughs using fractal analysis to project dynamic trend channels with symmetrical opposition lines.

Barishpolets Channels v1.0.P_v1
Indicator

Barishpolets Channels v1.0.P_v1

This indicator identifies geometric price channels by calculating the slope between sequential fractal extremes and projecting symmetrical trendlines to visualize support and resistance corridors.