bbsqueeze1
Download script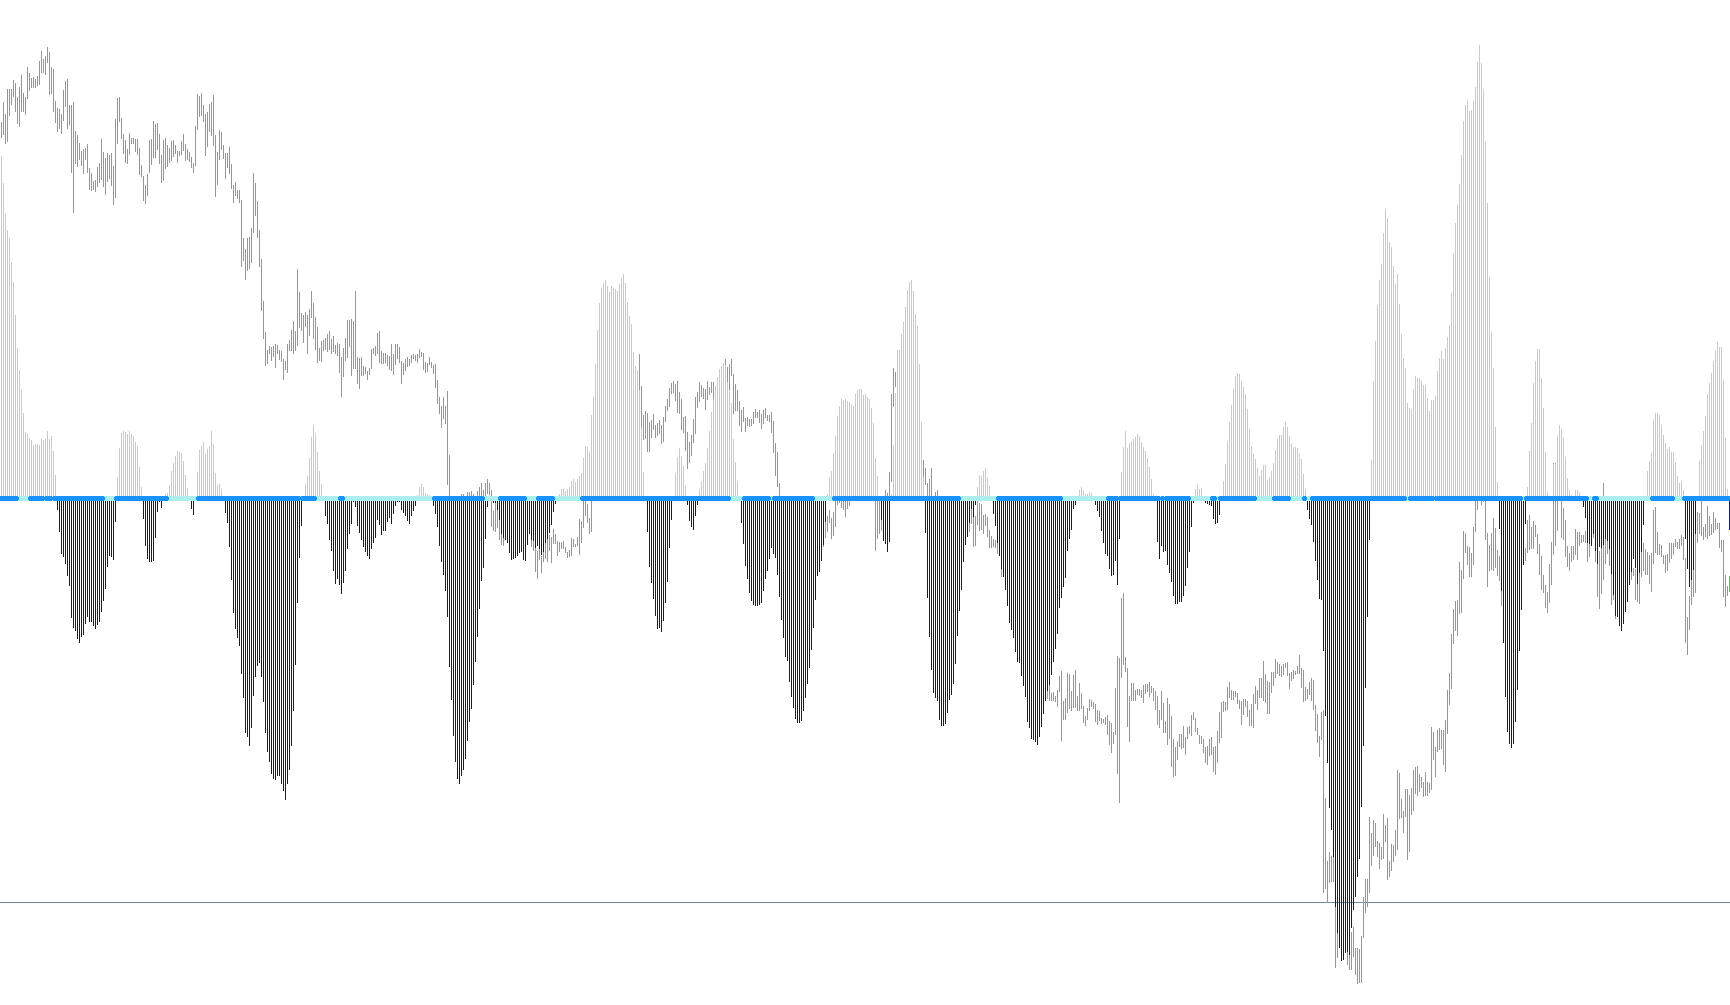
This tool is designed to help traders identify market trends and potential "squeezes"—periods where price action becomes unusually compressed before a significant breakout. It functions by analyzing price movement through two primary lenses: directional momentum and volatility compression.
Core Logic Overview
The script operates by calculating two distinct sets of data that work together to provide a clearer picture of the market's behavior:
1. Trend Direction (The Histogram) The indicator uses a specialized version of "Linear Regression" to determine whether the current price trend is moving upward or downward.
- Instead of looking at simple price points, it calculates a mathematical average of the price relative to its high and low extremes over a specific timeframe.
- Visual Representation: When the calculation results in a positive value, it indicates an upward bias (shown as a green histogram). When negative, it indicates a downward bias (shown as a red histogram).
2. Volatility & Squeeze Detection (The Signals) While the histogram shows you which way the "wind is blowing," the secondary logic identifies when that wind is about to pick up speed. It does this by comparing two different measures of market movement:
- It looks at the Standard Deviation (the typical spread of price movement).
- It compares this against the Average True Range (the actual distance between high and low prices) modified by a specific multiplier.
By dividing these two values, the script creates a "Squeeze" ratio.
- Low Volatility: When the market is moving in a very tight, compressed range (a "squeeze"), the indicator triggers a visual cue.
- Signal Logic: The script uses specific markers (arrows) to highlight these moments of compression. These signals suggest that the market is building potential energy, which may precede a sharp move in either direction.
Summary for Traders
Essentially, this script helps you filter out the "noise" of the market. It provides a visual map of the current trend via the histogram while simultaneously alerting you to periods where price action is becoming overly compressed. By watching where the signals appear relative to the histogram's color, traders can better anticipate high-momentum breakouts in either the bullish or bearish direction.
//+------------------------------------------------------------------+
//|                                                    bbsqueeze.mq4 |
//|                Copyright © 2005, Nick Bilak, beluck[AT]gmail.com |
//+------------------------------------------------------------------+
#property copyright "Copyright © 2005, Nick Bilak"
#property link      "http://metatrader.50webs.com/"

#property indicator_separate_window
#property indicator_buffers 4
#property indicator_color1 Lime
#property indicator_color2 Red
#property indicator_color3 Magenta
#property indicator_color4 Aqua
//---- input parameters
extern int       bolPrd=20;
extern double    bolDev=2.0;
extern int       keltPrd=20;
extern double    keltFactor=1.5;
extern int       momPrd=12;
//---- buffers
double upB[];
double loB[];
double upK[];
double loK[];

int i,j,slippage=3;
double breakpoint=0.0;
double ema=0.0;
int peakf=0;
int peaks=0;
int valleyf=0;
int valleys=0, limit=0;
double ccis[61],ccif[61];
double delta=0;
double ugol=0;
//+------------------------------------------------------------------+
//| Custom indicator initialization function                         |
//+------------------------------------------------------------------+
int init()
  {
//---- indicators
   SetIndexStyle(0,DRAW_HISTOGRAM);
   SetIndexBuffer(0,upB);
   SetIndexEmptyValue(0,EMPTY_VALUE);
   SetIndexStyle(1,DRAW_HISTOGRAM);
   SetIndexBuffer(1,loB);
   SetIndexEmptyValue(1,EMPTY_VALUE);

   SetIndexStyle(2,DRAW_ARROW);
   SetIndexBuffer(2,upK);
   SetIndexEmptyValue(2,EMPTY_VALUE);
   SetIndexArrow(2,159);
   SetIndexStyle(3,DRAW_ARROW);
   SetIndexBuffer(3,loK);
   SetIndexEmptyValue(3,EMPTY_VALUE);
   SetIndexArrow(3,159);
//----
   return(0);
  }
//+------------------------------------------------------------------+
//| Custor indicator deinitialization function                       |
//+------------------------------------------------------------------+
int deinit()
  {
//----

//----
   return(0);
  }
//+------------------------------------------------------------------+
//| Custom indicator iteration function                              |
//+------------------------------------------------------------------+
int start()
  {
   int counted_bars=IndicatorCounted();
   int shift,limit;
   double diff,d,std,bbs;

   if (counted_bars<0) return(-1);
   if (counted_bars>0) counted_bars--;
   limit=Bars-31;
   if(counted_bars>=31) limit=Bars-counted_bars-1;

   for (shift=limit;shift>=0;shift--)   {
      //d=iMomentum(NULL,0,momPrd,PRICE_CLOSE,shift);
      d=LinearRegressionValue(bolPrd,shift);
      if(d>0) {
         upB[shift]=d;
         loB[shift]=0;
      } else {
         upB[shift]=0;
         loB[shift]=d;
      }
		diff = iATR(NULL,0,keltPrd,shift)*keltFactor;
		std = iStdDev(NULL,0,bolPrd,MODE_SMA,0,PRICE_CLOSE,shift);
		bbs = bolDev * std / diff;
      if(bbs<1) {
         upK[shift]=0;
         loK[shift]=EMPTY_VALUE;
      } else {
         loK[shift]=0;
         upK[shift]=EMPTY_VALUE;
      }
   }
   return(0);
  }
//+------------------------------------------------------------------+


double LinearRegressionValue(int Len,int shift) {
   double SumBars = 0;
   double SumSqrBars = 0;
   double SumY = 0;
   double Sum1 = 0;
   double Sum2 = 0;
   double Slope = 0;

   SumBars = Len * (Len-1) * 0.5;
   SumSqrBars = (Len - 1) * Len * (2 * Len - 1)/6;

  for (int x=0; x<=Len-1;x++) {
   double HH = Low[x+shift];
   double LL = High[x+shift];
   for (int y=x; y<=(x+Len)-1; y++) {
     HH = MathMax(HH, High[y+shift]);
     LL = MathMin(LL, Low[y+shift]);
   }
    Sum1 += x* (Close[x+shift]-((HH+LL)/2 + iMA(NULL,0,Len,0,MODE_EMA,PRICE_CLOSE,x+shift))/2);
    SumY += (Close[x+shift]-((HH+LL)/2 + iMA(NULL,0,Len,0,MODE_EMA,PRICE_CLOSE,x+shift))/2);
  }
  Sum2 = SumBars * SumY;
  double Num1 = Len * Sum1 - Sum2;
  double Num2 = SumBars * SumBars-Len * SumSqrBars;

  if (Num2 != 0.0)  {
    Slope = Num1/Num2;
  } else {
    Slope = 0;
  }

  double Intercept = (SumY - Slope*SumBars) /Len;
  //debugPrintln(Intercept+" : "+Slope);
  double LinearRegValue = Intercept+Slope * (Len - 1);

  return (LinearRegValue);

}
Comments