bbsqueezemodified
Download script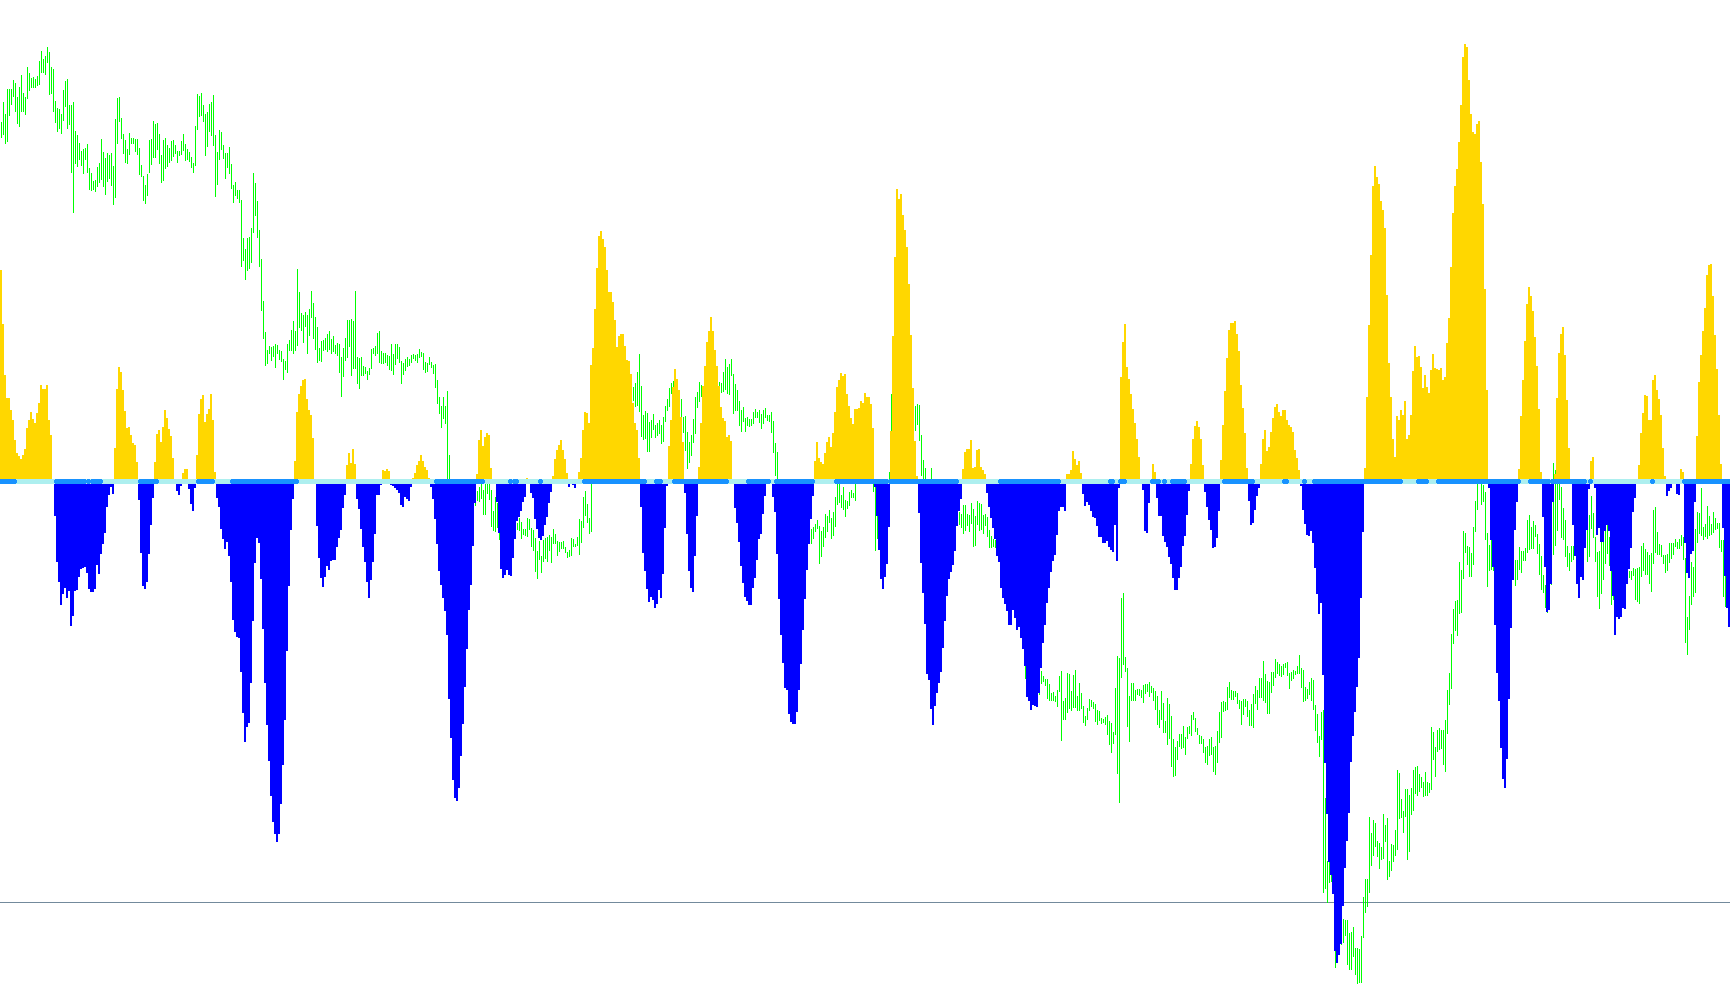
This script is designed to identify specific market conditions where price action suggests an impending move, specifically by monitoring the relationship between market momentum and volatility. It acts as a visual aid on your trading platform to highlight periods of "squeezes"—times when market activity becomes tightly compressed before potentially breaking out in a significant direction.
How the Logic Works
The script operates by analyzing two primary components of the market: Momentum and Volatility.
1. Momentum Tracking (The Trend Foundation) The tool first calculates a customized linear regression value. Instead of just looking at where the price is currently, it evaluates the "slope" of the price movement over a specific period. This helps the script understand the underlying direction of the market.
- If the momentum is positive, the script recognizes an upward bias.
- If the momentum is negative, it recognizes a downward bias. These values are visualized as histograms on your chart to show you the strength and direction of the current move.
2. The "Squeeze" Detection (The Volatility Filter) The core intelligence of this script lies in how it compares volatility against standard deviation. It uses three specific variables:
- Average True Range (ATR): To measure the current "breathing room" or movement of the price.
- Standard Deviation: To measure how much the price is deviating from its average.
- Bollinger Band Logic: It uses these figures to calculate a "BB Squeeze" ratio.
When the market becomes extremely quiet and the price starts moving within a very tight, consistent range (the squeeze), the script detects that the volatility is dropping relative to the standard deviation.
3. Visual Signals The script translates these complex calculations into simple visual cues:
- Histograms: These show you the filtered momentum of the market, helping you see if the "wind" is blowing up or down.
- Arrows: The script places specific markers (arrows) on the chart to alert you when the squeeze conditions are met. These act as indicators that the market is compressed and may be preparing for a breakout.
Summary for the Trader
Think of this tool as a "pressure gauge." It monitors the price to see when it is being squeezed into a tight space. When the pressure builds up (the squeeze), the script highlights these areas, allowing you to identify potential zones where the market might soon "explode" in either direction once the compression releases.
//+------------------------------------------------------------------+
//|                                                    bbsqueeze.mq4 |
//|                Copyright © 2005, Nick Bilak, beluck[AT]gmail.com
//| squeeze modified by maumax AKA foreverold                                      |
//+------------------------------------------------------------------+
#property copyright "Copyright © 2005, Nick Bilak"
#property link      "http://metatrader.50webs.com/"
string t;

#property indicator_separate_window
#property indicator_buffers 4
#property indicator_color1 Lime
#property indicator_color2 Red
#property indicator_color3 Magenta
#property indicator_color4 White//Aqua
//---- input parameters
extern int       bolPrd=20;
extern double    bolDev=2.0;
extern int       keltPrd=18;//20
extern double    keltFactor=1.8;//1.5
extern int       momPrd=14;//12
//---- buffers
double upB[];
double loB[];
double upK[];
double loK[];

int i,j,slippage=3;
double breakpoint=0.0;
double ema=0.0;
int peakf=0;
int peaks=0;
int valleyf=0;
int valleys=0, limit=0;
double ccis[61],ccif[61];
double delta=0;
double ugol=0;
//+------------------------------------------------------------------+
//| Custom indicator initialization function                         |
//+------------------------------------------------------------------+
int init()
  {

//---- indicators
   SetIndexStyle(0,DRAW_HISTOGRAM,0,2);
   SetIndexBuffer(0,upB);
   SetIndexEmptyValue(0,EMPTY_VALUE);
   SetIndexStyle(1,DRAW_HISTOGRAM,0,2);
   SetIndexBuffer(1,loB);
   SetIndexEmptyValue(1,EMPTY_VALUE);

   SetIndexStyle(2,DRAW_ARROW);
   SetIndexBuffer(2,upK);
   SetIndexEmptyValue(2,EMPTY_VALUE);
   SetIndexArrow(2,159);
   SetIndexStyle(3,DRAW_ARROW);
   SetIndexBuffer(3,loK);
   SetIndexEmptyValue(3,EMPTY_VALUE);
   SetIndexArrow(3,159);
//----
   return(0);
  }
//+------------------------------------------------------------------+
//| Custor indicator deinitialization function                       |
//+------------------------------------------------------------------+
int deinit()
  {
   int shift=0;
//---- TODO: add your code here
   for (shift=0;shift<=Bars-1;shift++)
   {
      ObjectDelete("vline1"+Time[shift]);
      ObjectDelete("vline2"+Time[shift]);
      }

//----

//----
   return(0);
  }
//+------------------------------------------------------------------+
//| Custom indicator iteration function                              |
//+------------------------------------------------------------------+
int start()
  {
   int counted_bars=IndicatorCounted();
   int shift,limit;
   double diff,d,std,bbs;

   if (counted_bars<0) return(-1);
   if (counted_bars>0) counted_bars--;
   limit=Bars-31;
   if(counted_bars>=31) limit=Bars-counted_bars-1;

   for (shift=limit;shift>=0;shift--)   {
      //d=iMomentum(NULL,0,momPrd,PRICE_CLOSE,shift);
      d=LinearRegressionValue(momPrd,shift);
      if(d>0) {
         upB[shift]=d;
         loB[shift]=0;

      } else {
         upB[shift]=0;
         loB[shift]=d;


      }
		diff = iATR(NULL,0,keltPrd,shift)*keltFactor;
		std = iStdDev(NULL,0,bolPrd,MODE_SMA,0,PRICE_CLOSE,shift);
		bbs = bolDev * std / diff;
      if(bbs<1) {
         upK[shift]=0;
         loK[shift]=EMPTY_VALUE;


      } else {
         loK[shift]=0;
         upK[shift]=EMPTY_VALUE;

    }
   }


   return(0);
  }


//+------------------------------------------------------------------+


double LinearRegressionValue(int Len,int shift) {
   double SumBars = 0;
   double SumSqrBars = 0;
   double SumY = 0;
   double Sum1 = 0;
   double Sum2 = 0;
   double Slope = 0;

   SumBars = Len * (Len-1) * 0.5;
   SumSqrBars = (Len - 1) * Len * (2 * Len - 1)/6;

  for (int x=0; x<=Len-1;x++) {
   double HH = Low[x+shift];
   double LL = High[x+shift];
   for (int y=x; y<=(x+Len)-1; y++) {
     HH = MathMax(HH, High[y+shift]);


     LL = MathMin(LL, Low[y+shift]);


   }
    Sum1 += x* (Close[x+shift]-((HH+LL)/2 + iMA(NULL,0,Len,0,MODE_EMA,PRICE_CLOSE,x+shift))/2);
    SumY += (Close[x+shift]-((HH+LL)/2 + iMA(NULL,0,Len,0,MODE_EMA,PRICE_CLOSE,x+shift))/2);
  }
  Sum2 = SumBars * SumY;
  double Num1 = Len * Sum1 - Sum2;
  double Num2 = SumBars * SumBars-Len * SumSqrBars;

  if (Num2 != 0.0)  {
    Slope = Num1/Num2;
  } else {
    Slope = 0;
  }

  double Intercept = (SumY - Slope*SumBars) /Len;
  //debugPrintln(Intercept+" : "+Slope);
  double LinearRegValue = Intercept+Slope * (Len - 1);

  return (LinearRegValue);

}
Comments