bbsqueeze_dark
Download script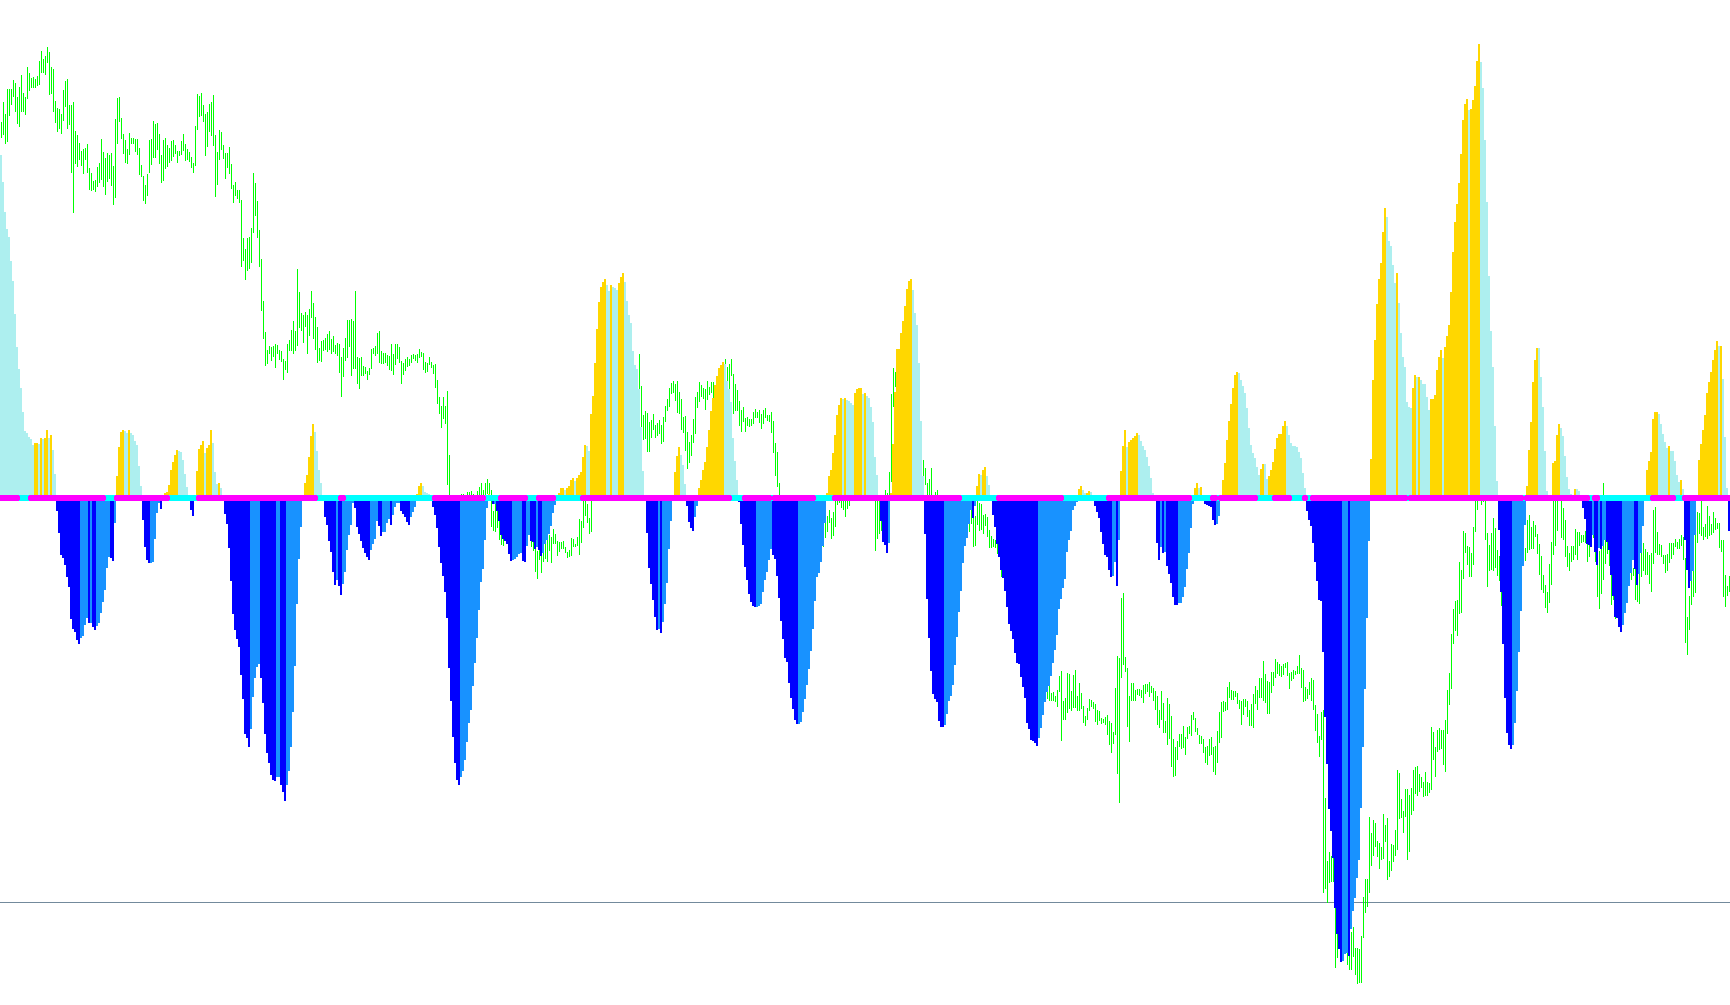
This script is a sophisticated technical analysis tool designed to help traders identify market momentum and potential volatility shifts. By combining several different mathematical models, it provides a visual representation of price trends and highlights specific moments where the market might be "squeezing" or preparing for a significant move.
Core Logic Overview
The indicator operates by analyzing three primary components of market behavior: linear regression, volatility (standard deviation), and average true range. Here is how it processes that data into visual information:
1. Trend Momentum Tracking Instead of simply looking at the current price, the script calculates a "Linear Regression Value." This involves looking at a specific window of past data to determine the underlying direction of the price. It essentially tries to find the "best-fit" line for price action.
- The script tracks whether this trend value is moving up or down.
- It distinguishes between the current momentum and the previous bar's momentum, allowing it to highlight shifts in direction visually on your chart.
2. Volatility and "Squeeze" Detection One of the primary functions of this tool is identifying periods of low volatility. It does this by comparing two different types of market movement:
- Standard Deviation: Measures how much the price is deviating from its average.
- Average True Range (ATR): Measures the actual distance between highs and lows.
By dividing the standard deviation by a modified ATR, the script calculates a "Bollinger Band Squeeze" logic. When this value falls below a specific threshold (defined by your settings), it indicates that the market is becoming abnormally quiet or compressed.
3. Visual Signal Output The script translates these complex calculations into clear visual cues:
- Histograms: These show the strength and direction of the trend momentum. They help you see at a glance whether the prevailing sentiment is bullish (positive) or bearish (negative).
- Directional Arrows: The script uses the "Squeeze" logic to place specific markers on the chart. When the market is in a high-volatility state (the squeeze is released), it provides an arrow signal. This helps traders identify when the "coiled spring" of price action is finally beginning to move in a significant direction.
Summary for the Trader
In practical terms, this script acts as a dual-purpose filter. It tells you where the market is heading by smoothing out the noise of price action into a trend histogram, and it tells you when the market is about to explode by monitoring the compression of volatility. It is designed to help you avoid "choppy" markets and identify high-probability entries when the price breaks out of a period of consolidation.
/*-----------------------------+
|			       |
| Shared by www.Aptrafx.com    |
|			       |
+------------------------------*/

//+------------------------------------------------------------------+
//|                                                    bbsqueeze.mq4 |
//|                Copyright © 2005, Nick Bilak, beluck[AT]gmail.com |
//|           enhanced a little bit by CJ Rivas, carlos[AT]vealo.com |
//+------------------------------------------------------------------+
#property copyright "Copyright © 2005, Nick Bilak"
#property link      "http://metatrader.50webs.com/"

#property indicator_separate_window
#property indicator_buffers 6
#property indicator_color1 Blue
#property indicator_color2 Red
#property indicator_color3 DarkBlue
#property indicator_color4 Maroon
#property indicator_color5 Blue
#property indicator_color6 Lime

//---- input parameters
extern int       bolPrd=20;
extern double    bolDev=2.0;
extern int       keltPrd=20;
extern double    keltFactor=1.5;
extern int       momPrd=12;
//---- buffers
double upB[];
double upB2[];
double loB[];
double loB2[];
double upK[];
double loK[];

int i,j,slippage=3;
double breakpoint=0.0;
double ema=0.0;
int peakf=0;
int peaks=0;
int valleyf=0;
int valleys=0, limit=0;
double ccis[61],ccif[61];
double delta=0;
double ugol=0;
//+------------------------------------------------------------------+
//| Custom indicator initialization function                         |
//+------------------------------------------------------------------+
int init()
  {
//---- indicators
   SetIndexStyle(0,DRAW_HISTOGRAM,EMPTY,3);
   SetIndexBuffer(0,upB);
   SetIndexEmptyValue(0,EMPTY_VALUE);

   SetIndexStyle(1,DRAW_HISTOGRAM,EMPTY,3);
   SetIndexBuffer(1,loB);
   SetIndexEmptyValue(1,EMPTY_VALUE);

   SetIndexStyle(4,DRAW_ARROW,EMPTY,2);
   SetIndexBuffer(4,upK);
   SetIndexEmptyValue(4,EMPTY_VALUE);
   SetIndexArrow(4,159);
   SetIndexStyle(5,DRAW_ARROW,EMPTY,2);
   SetIndexBuffer(5,loK);
   SetIndexEmptyValue(5,EMPTY_VALUE);
   SetIndexArrow(5,159);

   SetIndexStyle(2,DRAW_HISTOGRAM,EMPTY,3);
   SetIndexEmptyValue(2,EMPTY_VALUE);
   SetIndexBuffer(2,upB2);

   SetIndexStyle(3,DRAW_HISTOGRAM,EMPTY,3);
   SetIndexEmptyValue(3,EMPTY_VALUE);
   SetIndexBuffer(3,loB2);


//----
   return(0);
  }
//+------------------------------------------------------------------+
//| Custor indicator deinitialization function                       |
//+------------------------------------------------------------------+
int deinit()
  {
//----

//----
   return(0);
  }
//+------------------------------------------------------------------+
//| Custom indicator iteration function                              |
//+------------------------------------------------------------------+
int start()
  {
   int counted_bars=IndicatorCounted();
   int shift,limit;
   double diff,d,dPrev, std,bbs;

   if (counted_bars<0) return(-1);
   if (counted_bars>0) counted_bars--;
   limit=Bars-31;
   if(counted_bars>=31) limit=Bars-counted_bars-1;

   for (shift=limit;shift>=0;shift--)   {
      //d=iMomentum(NULL,0,momPrd,PRICE_CLOSE,shift);
      d=LinearRegressionValue(bolPrd,shift);
      dPrev=LinearRegressionValue(bolPrd,shift+1);
      if(d>0) {
         if ((dPrev>0) && (dPrev > d)){ upB2[shift]=d; upB[shift] = 0; } else { upB[shift]= d; upB2[shift] = 0; }
         //upB[shift]=0;
         loB[shift]=0;
         loB2[shift]=0;
      } else {
         if ((dPrev<0) && (dPrev < d)){ loB2[shift]=d; loB[shift] = 0; } else { loB[shift]= d; loB2[shift] = 0; }
         upB[shift]=0;
         upB2[shift]=0;
         //loB[shift]=d;
      }
		diff = iATR(NULL,0,keltPrd,shift)*keltFactor;
		std = iStdDev(NULL,0,bolPrd,MODE_SMA,0,PRICE_CLOSE,shift);
		bbs = bolDev * std / diff;
      if(bbs<1) {
         upK[shift]=0;
         loK[shift]=EMPTY_VALUE;
      } else {
         loK[shift]=0;
         upK[shift]=EMPTY_VALUE;
      }
   }
   return(0);
  }
//+------------------------------------------------------------------+


double LinearRegressionValue(int Len,int shift) {
   double SumBars = 0;
   double SumSqrBars = 0;
   double SumY = 0;
   double Sum1 = 0;
   double Sum2 = 0;
   double Slope = 0;

   SumBars = Len * (Len-1) * 0.5;
   SumSqrBars = (Len - 1) * Len * (2 * Len - 1)/6;

  for (int x=0; x<=Len-1;x++) {
   double HH = Low[x+shift];
   double LL = High[x+shift];
   for (int y=x; y<=(x+Len)-1; y++) {
     HH = MathMax(HH, High[y+shift]);
     LL = MathMin(LL, Low[y+shift]);
   }
    Sum1 += x* (Close[x+shift]-((HH+LL)/2 + iMA(NULL,0,Len,0,MODE_EMA,PRICE_CLOSE,x+shift))/2);
    SumY += (Close[x+shift]-((HH+LL)/2 + iMA(NULL,0,Len,0,MODE_EMA,PRICE_CLOSE,x+shift))/2);
  }
  Sum2 = SumBars * SumY;
  double Num1 = Len * Sum1 - Sum2;
  double Num2 = SumBars * SumBars-Len * SumSqrBars;

  if (Num2 != 0.0)  {
    Slope = Num1/Num2;
  } else {
    Slope = 0;
  }

  double Intercept = (SumY - Slope*SumBars) /Len;
  double LinearRegValue = Intercept+Slope * (Len - 1);

  return (LinearRegValue);

}
Comments