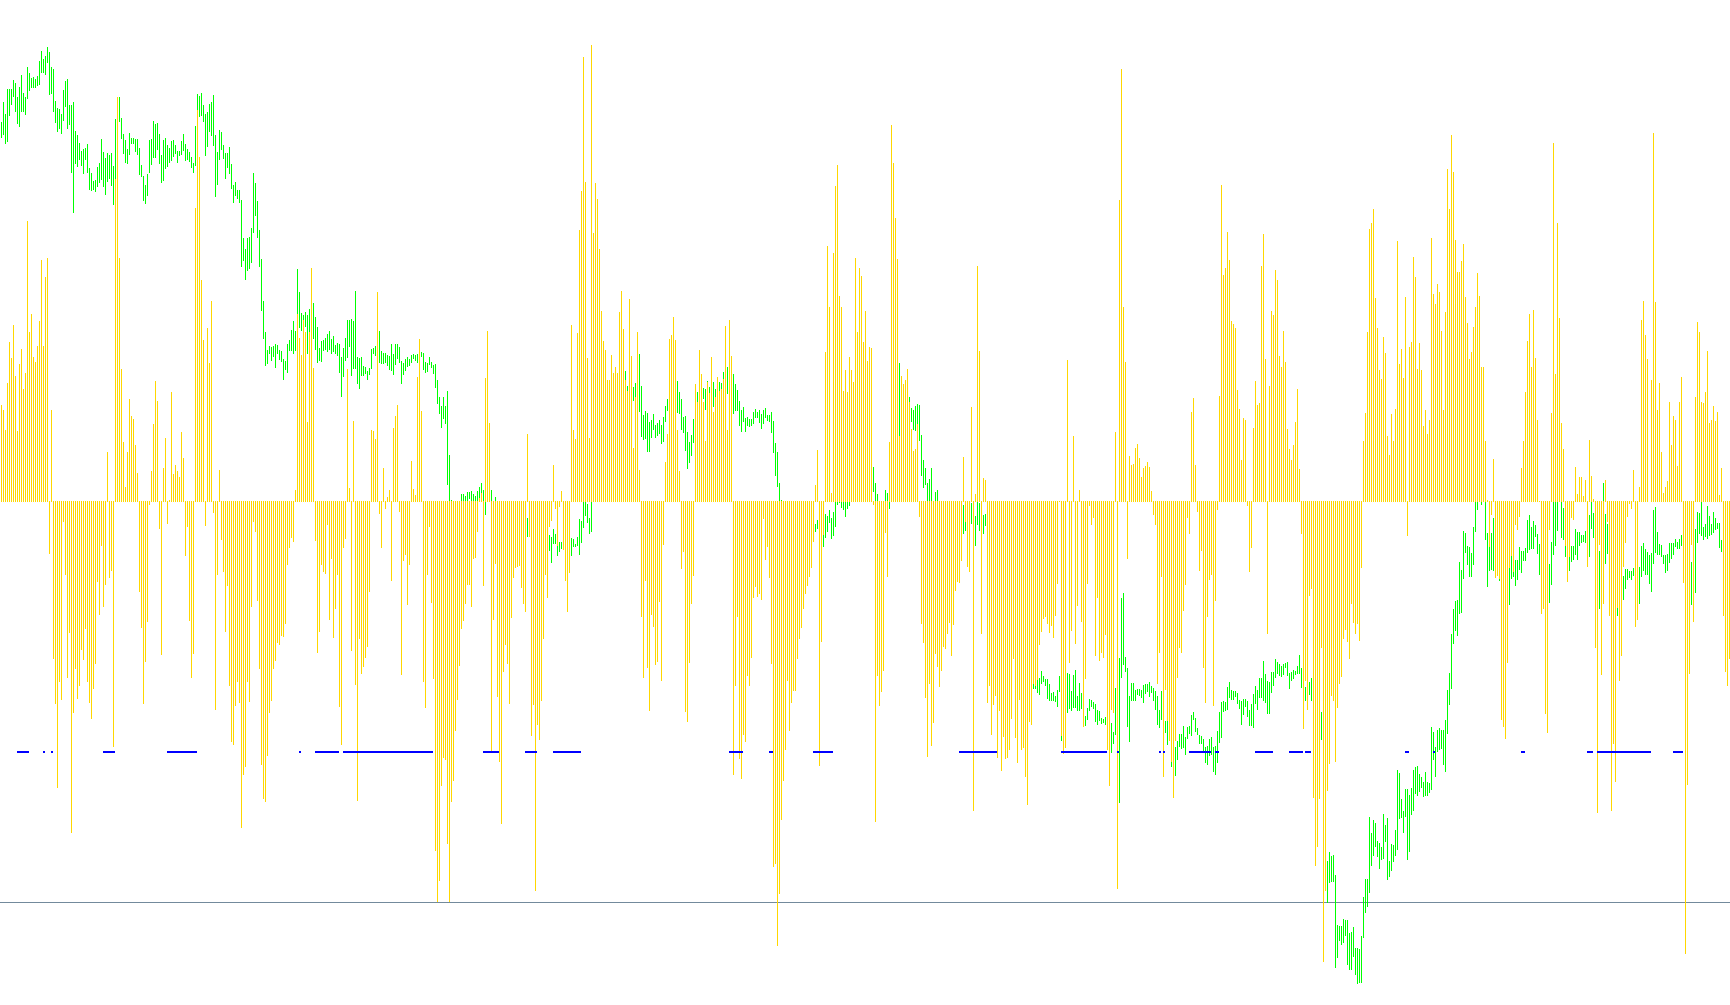
This tool is designed to assist traders in identifying specific market conditions by analyzing the relationship between price volatility and historical trends. Rather than just showing a single line, it provides a visual representation of market "tension" to help users spot potential shifts in momentum.
Core Logic and Functionality
The script operates using three primary mathematical components to generate its visual signals:
1. Volatility Measurement (The Base) The tool looks at the standard deviation of price movements over a specific period. This represents how much the price typically "swings" or fluctuates. By calculating this, the script establishes a baseline for what is considered normal market activity.
2. Trend Smoothing (The Context) To understand where the price is heading, the logic incorporates moving averages and Average True Range (ATR) calculations. These elements help the tool distinguish between random "noise" in the market and actual, sustained movements in price.
3. The "Squeeze" Detection The primary goal of this script is to identify a state of low volatility—often referred to as a "squeeze." It does this by comparing the current standard deviation (volatility) against the ATR (the range of price movement).
When the market becomes unusually quiet or compressed, the ratio between these two values drops significantly. The logic specifically looks for moments where this ratio falls below a predefined threshold.
Visual Output
The indicator provides two distinct visual cues on your chart:
- Histogram: This provides a continuous visual representation of the calculated data, allowing you to see the ongoing fluctuations and trends in the market's volatility over time.
- Signal Arrows: When the script detects that the market has entered a "squeeze" state (meaning price movement is abnormally compressed compared to recent history), it places a specific visual marker on the chart. These arrows act as alerts, highlighting areas where the market might be building up energy for a potential breakout in either direction.
Summary for the Trader
In simple terms, this script acts as an "early warning system." It monitors the market to see when price action is becoming too quiet or tight. When the indicator signals that the market is "squeezed," it suggests that volatility may be building up, potentially preceding a significant move in price.
//+------------------------------------------------------------------+
//|                                                      bbhisto.mq4 |
//|                                     Copyright © 2005, Nick Bilak |
//|        http://metatrader.50webs.com/         beluck[at]gmail.com |
//+------------------------------------------------------------------+
#property copyright "Copyright © 2005, Nick Bilak"
#property link      "http://metatrader.50webs.com/"

#property indicator_separate_window
#property indicator_buffers 2
#property indicator_color1 Lime
#property indicator_color2 Gold
//#property indicator_color3 MediumVioletRed
//#property indicator_maximum 4
#property indicator_level1 2
#property indicator_level2 1
#property indicator_level3 -1
#property indicator_level4 -2
#property indicator_levelcolor  DarkSlateGray


//---- input parameters
extern int    bolingerPeriod=20;
extern int       BBsqueezArwLv=-2.0;
extern int       bolPrd=20;
extern double    bolDev=2.0;
extern int       keltPrd=20;
extern double    keltFactor=1.5;

//---- buffers
double bb[];
double arrowBuffer[];
double lo[];
double diff,std,bbs;
//
int i,j;
//+------------------------------------------------------------------+
//| Custom indicator initialization function                         |
//+------------------------------------------------------------------+
int init()
  {
   SetIndexStyle(0,DRAW_HISTOGRAM);
   SetIndexBuffer(0,bb);
   SetIndexStyle(1,DRAW_ARROW);
   SetIndexBuffer(1,arrowBuffer);
   SetIndexArrow(1,158);
   SetIndexLabel(1,"BBsquise ");
   SetIndexLabel(0,"BB");

//   SetIndexStyle(2,DRAW_ARROW);
//   SetIndexBuffer(2,lo);
//
  SetIndexEmptyValue(1,EMPTY_VALUE);
//  SetIndexEmptyValue(2,EMPTY_VALUE);

//  SetIndexArrow(2,159);

   return(0);
  }
//+------------------------------------------------------------------+
//| Custor indicator deinitialization function                       |
//+------------------------------------------------------------------+
int deinit()
  {
//----

//----
   return(0);
  }
//+------------------------------------------------------------------+
//| Custom indicator iteration function                              |
//+------------------------------------------------------------------+
int start()
  {
   int counted_bars=IndicatorCounted();
   int shift,limit;
   double d,ku,kd,km;

   if (counted_bars<0) return(-1);
   if (counted_bars>0) counted_bars--;
   limit=Bars-31;
   if(counted_bars>=31) limit=Bars-counted_bars-1;

   for (shift=limit+30;shift>=0;shift--)   {
      bb[shift]=0;
      d=iStdDev(NULL,0,bolingerPeriod,MODE_SMA,0,PRICE_CLOSE,shift);
      if( d<0.0001) d=0.0001;
      bb[shift]=((Close[shift]+2*d - iMA(NULL,0,bolingerPeriod,0,MODE_SMA,PRICE_CLOSE,shift)) /
         (4*d))*4-2;
//      bb[shift]=bb[shift]/3;
// //     up[shift]=EMPTY_VALUE;
 //     lo[shift]=EMPTY_VALUE;
//      if (bb[shift]>0) {
 //        up[shift]=4;
   //    }
    //  if (bb[shift]<0) {
 //   //     lo[shift]=-4;
     }
  for (shift=limit;shift>=0;shift--) {
       diff = iATR(NULL,0,keltPrd,shift)*keltFactor;
      std = iStdDev(NULL,0,bolPrd,MODE_SMA,0,PRICE_CLOSE,shift);
      bbs = bolDev * std / diff;
arrowBuffer[shift]=EMPTY_VALUE;
      if(bbs<1) {arrowBuffer[shift] = BBsqueezArwLv; }
// }
   }
   return(0);
  }
//+------------------------------------------------------------------+
Comments