BBwithFractdev_v1
Download script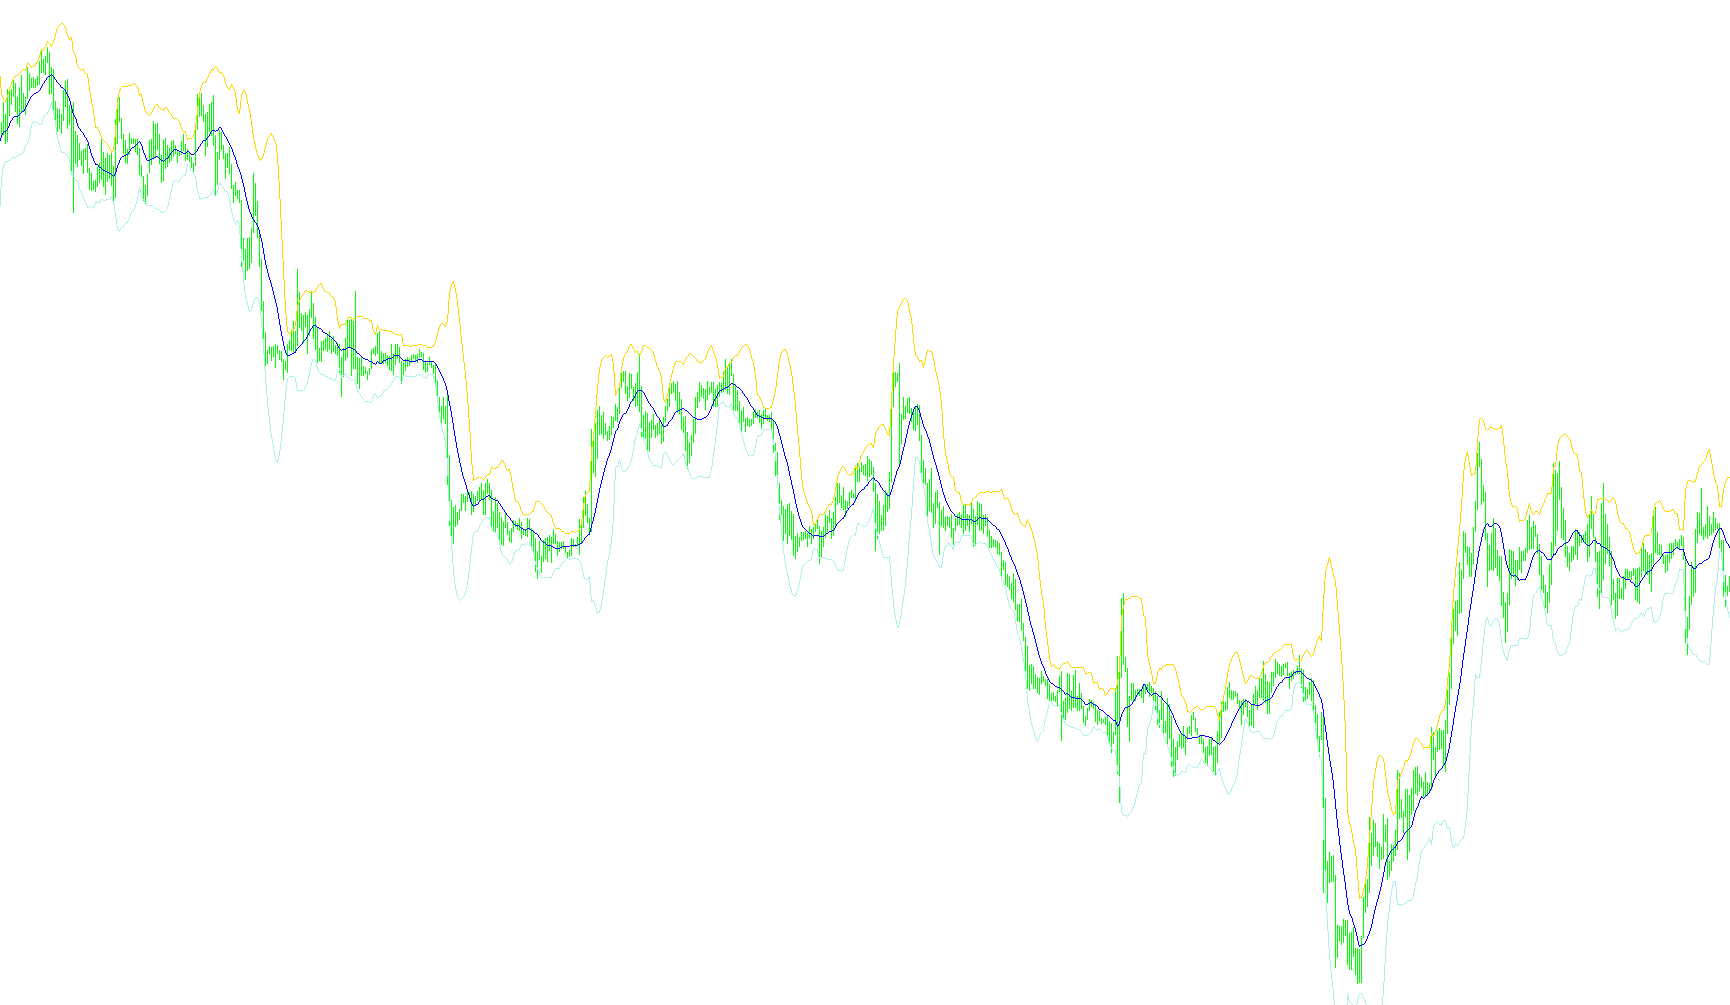
This script is a specialized technical analysis tool designed to help traders identify price boundaries and potential overextended market conditions. It functions by layering two distinct types of mathematical data: a moving average and a volatility measurement, customized with a specific multiplier.
How the Logic Works
1. Establishing the Baseline (The Moving Average) The core of the indicator begins by calculating a "Simple Moving Average." This acts as the baseline or the "fair value" of the asset's price over a specific timeframe. Instead of looking at just the latest price, it takes the average of several previous closing prices to smooth out minor fluctuations and reveal the overall trend.
2. Measuring Market Volatility (Standard Deviation) To understand how much the price is swinging away from that baseline, the script calculates what is known as "Standard Deviation." Think of this as a measurement of market "noise" or intensity. If the price is jumping wildly, the deviation will be high; if the price is moving calmly, the deviation will be low.
3. Defining the Boundaries (The Deviation Multiplier) This is where the script becomes unique. It takes that volatility measurement and multiplies it by a specific coefficient (the "Deviation" factor). By doing this, the script creates two dynamic boundaries:
- The Upper Boundary: The baseline plus the multiplied volatility.
- The Lower Boundary: The baseline minus the multiplied volatility.
What This Means for the User
Rather than using standard industry defaults, this tool allows you to visualize a "channel" of price action. Because the boundaries are calculated based on actual market volatility, they expand when the market becomes erratic and contract when the market settles down.
For a trader, these lines serve as visual cues: when the price pushes toward or outside of these boundaries, it suggests that the asset may be overextended in its current direction. It provides a mathematical way to see where "normal" price action ends and where extreme movement begins.
/*-----------------------------+
|			       |
| Shared by www.Aptrafx.com    |
|			       |
+------------------------------*/

//+------------------------------------------------------------------+
//|                                               BBwithFractdev.mq4 |
//|                                           Êèì Èãîðü Â. aka KimIV |
//|                                              http://www.kimiv.ru |
//|                                                                  |
//| Ïîëîñû Áîëëèíäæåðà ñ äðîáíûì êîýôôèöèåíòîì îòêëîíåíèÿ            |
//+------------------------------------------------------------------+
#property copyright "Êèì Èãîðü Â. aka KimIV"
#property link      "http://www.kimiv.ru"

#property indicator_chart_window
#property indicator_buffers 3
#property indicator_color1 Green
#property indicator_color2 Blue
#property indicator_color3 Green

//---- input parameters
extern int    BB_Period = 13;     // Ïåðèîä ñðåäíåé è îòêëîíåíèÿ
extern double Deviation = 2.618;  // Êîýôôèöèåíò îòêëîíåíèÿ

//---- indicator buffers
double buf1[];
double buf2[];
double buf3[];

//+------------------------------------------------------------------+
//| Custom indicator initialization function                         |
//+------------------------------------------------------------------+
void init() {
  SetIndexStyle(0, DRAW_LINE);
  SetIndexStyle(1, DRAW_LINE);
  SetIndexStyle(2, DRAW_LINE);
  IndicatorDigits(MarketInfo(Symbol(), MODE_DIGITS));

  SetIndexBuffer(0, buf1);
  SetIndexBuffer(1, buf2);
  SetIndexBuffer(2, buf3);
}

//+------------------------------------------------------------------+
//| Custom indicator iteration function                              |
//+------------------------------------------------------------------+
void start() {
  int i, j;
  double ave, sko, sum;

  if (Bars<=BB_Period) return;
  for (i=Bars-BB_Period; i>=0; i--) {
    buf2[i] = iMA(NULL,0,BB_Period,0,MODE_SMA,PRICE_CLOSE,i);
    sum = 0;
    for (j=0; j<BB_Period; j++) sum+=Close[i+j];
    ave = sum / BB_Period;
    sum = 0;
    for (j=0; j<BB_Period; j++) sum+=(Close[i+j]-ave)*(Close[i+j]-ave);
    sko = MathSqrt(sum / BB_Period);
    buf1[i] = buf2[i]+(Deviation*sko);
    buf3[i] = buf2[i]-(Deviation*sko);
  }
}
//+------------------------------------------------------------------+
Comments