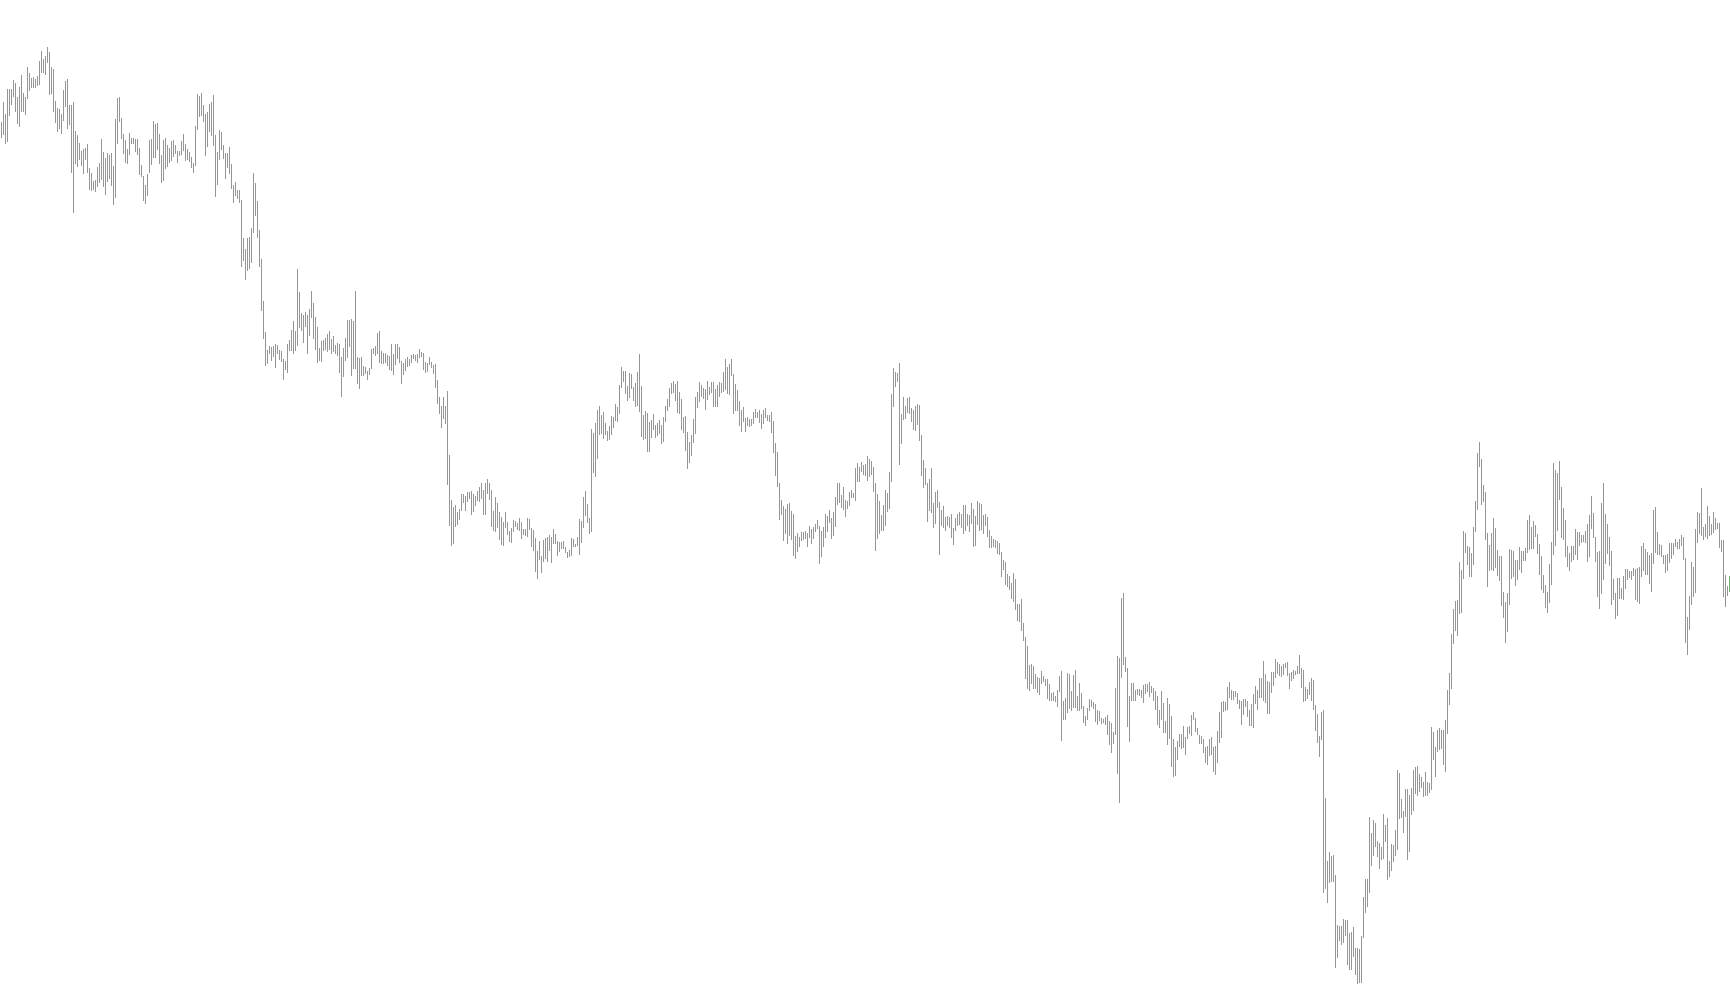
Okay, here's a breakdown of the script's logic in plain English, avoiding technical jargon and code snippets.
Overall Purpose
This script is designed to generate visual signals on a price chart, indicating potential upward or downward trends. It uses Bollinger Bands, a common technical analysis tool, as its foundation. The script aims to identify points where the price might be poised for a change in direction, and it also provides options to draw lines on the chart to visually represent these potential levels. It also has an alert feature that can notify you when a trend is detected.
Key Components and How They Work
-
Bollinger Bands:
- Bollinger Bands are calculated based on the price history (typically the closing price) of an asset. They consist of a middle band (usually a simple moving average) and two outer bands that are a certain distance (standard deviations) above and below the middle band.
- The script uses these bands to identify potential overbought (price too high) or oversold (price too low) conditions.
-
Trend Identification:
- The script looks for specific price movements relative to the Bollinger Bands.
- If the price closes above the upper band, it suggests a potential upward trend.
- If the price closes below the lower band, it suggests a potential downward trend.
-
Signal Generation:
- The script generates signals (represented by visual markers on the chart) when it detects these potential trend changes.
- The signals are placed at specific price levels based on calculations involving the Bollinger Bands and a "Money Risk" factor (which adjusts the sensitivity of the signals).
-
"Money Risk" Factor:
- This is a user-adjustable parameter that controls how far the signals are placed from the Bollinger Bands. A higher "Money Risk" value will place the signals further away, making them less sensitive to small price fluctuations.
-
Visual Representation (Lines):
- The script has an option to draw lines on the chart at the levels where the signals are generated. This provides a visual reference for potential support or resistance levels.
-
Alerts:
- The script can generate alerts (pop-up notifications) when a new trend signal is detected. This allows traders to be immediately notified of potential trading opportunities. The script also prevents duplicate alerts by tracking whether an alert has already been triggered for the current trend.
How the Script Processes Data
- Initialization: The script starts by clearing any previous signals and lines.
- Looping Through Price History: It then loops through the historical price data, calculating Bollinger Bands for each point in time.
- Trend Detection: For each point, it checks if the current price has crossed the upper or lower Bollinger Band.
- Signal Placement: If a trend is detected, it places a signal at a calculated price level.
- Line Drawing (Optional): If the user has enabled the line-drawing option, it draws a line at the signal level.
- Alerting (Optional): If a new signal is generated, it triggers an alert.
User-Adjustable Parameters
- Length: This determines the period used to calculate the moving average for the Bollinger Bands.
- Deviation: This controls the distance of the outer bands from the middle band.
- Money Risk: This adjusts the sensitivity of the signals.
- Signal Type: Determines whether to show signals for upward or downward trends.
- Line Drawing: Enables or disables the drawing of lines on the chart.
- Alerts: Enables or disables the alert feature.
In essence, this script is a tool to help traders identify potential trend reversals based on Bollinger Bands, providing visual signals and alerts to aid in their trading decisions.
//+------------------------------------------------------------------+
//|                                               BBands_Stop_v1.mq4 |
//|                           Copyright © 2006, TrendLaboratory Ltd. |
//|            http://finance.groups.yahoo.com/group/TrendLaboratory |
//|                                       E-mail: igorad2004@list.ru |
//+------------------------------------------------------------------+
#property copyright "Copyright © 2006, TrendLaboratory Ltd."
#property link      "http://finance.groups.yahoo.com/group/TrendLaboratory"

#property indicator_chart_window
#property indicator_buffers 6
#property indicator_color1 LightGoldenrod
#property indicator_color2 Orange
#property indicator_color3 LightGoldenrod
#property indicator_color4 Orange
#property indicator_color5 LightGoldenrod
#property indicator_color6 Orange
//---- input parameters
extern int    Length=20;      // Bollinger Bands Period
extern int    Deviation=2;    // Deviation
extern double MoneyRisk=1.00; // Offset Factor
extern int    Signal=1;       // Display signals mode: 1-Signals & Stops; 0-only Stops; 2-only Signals;
extern int    Line=1;         // Display line mode: 0-no,1-yes
extern int    Nbars=1000;
//---- indicator buffers
double UpTrendBuffer[];
double DownTrendBuffer[];
double UpTrendSignal[];
double DownTrendSignal[];
double UpTrendLine[];
double DownTrendLine[];
extern bool SoundON=true;
bool TurnedUp = false;
bool TurnedDown = false;
//+------------------------------------------------------------------+
//| Custom indicator initialization function                         |
//+------------------------------------------------------------------+
  int init()
  {
   string short_name;
//---- indicator line

   SetIndexBuffer(0,UpTrendBuffer);
   SetIndexBuffer(1,DownTrendBuffer);
   SetIndexBuffer(2,UpTrendSignal);
   SetIndexBuffer(3,DownTrendSignal);
   SetIndexBuffer(4,UpTrendLine);
   SetIndexBuffer(5,DownTrendLine);
   SetIndexStyle(0,DRAW_ARROW,0,2);
   SetIndexStyle(1,DRAW_ARROW,0,2);
   SetIndexStyle(2,DRAW_ARROW,0,3);
   SetIndexStyle(3,DRAW_ARROW,0,3);
   SetIndexStyle(4,DRAW_LINE);
   SetIndexStyle(5,DRAW_LINE);
   SetIndexArrow(0,159);
   SetIndexArrow(1,159);
   SetIndexArrow(2,108);
   SetIndexArrow(3,108);
   IndicatorDigits(MarketInfo(Symbol(),MODE_DIGITS));
//---- name for DataWindow and indicator subwindow label
   short_name="BBands Stop("+Length+","+Deviation+")";
   IndicatorShortName(short_name);
   SetIndexLabel(0,"UpTrend Stop");
   SetIndexLabel(1,"DownTrend Stop");
   SetIndexLabel(2,"UpTrend Signal");
   SetIndexLabel(3,"DownTrend Signal");
   SetIndexLabel(4,"UpTrend Line");
   SetIndexLabel(5,"DownTrend Line");
//----
   SetIndexDrawBegin(0,Length);
   SetIndexDrawBegin(1,Length);
   SetIndexDrawBegin(2,Length);
   SetIndexDrawBegin(3,Length);
   SetIndexDrawBegin(4,Length);
   SetIndexDrawBegin(5,Length);
//----
   return(0);
  }

//+------------------------------------------------------------------+
//| Bollinger Bands_Stop_v1                                             |
//+------------------------------------------------------------------+
int start()
  {
   int    i,shift,trend;
   double smax[25000],smin[25000],bsmax[25000],bsmin[25000];

   for (shift=Nbars;shift>=0;shift--)
   {
   UpTrendBuffer[shift]=0;
   DownTrendBuffer[shift]=0;
   UpTrendSignal[shift]=0;
   DownTrendSignal[shift]=0;
   UpTrendLine[shift]=EMPTY_VALUE;
   DownTrendLine[shift]=EMPTY_VALUE;
   }

   for (shift=Nbars-Length-1;shift>=0;shift--)
   {
     smax[shift]=iBands(NULL,0,Length,Deviation,0,PRICE_CLOSE,MODE_UPPER,shift);
	  smin[shift]=iBands(NULL,0,Length,Deviation,0,PRICE_CLOSE,MODE_LOWER,shift);

	  if (Close[shift]>smax[shift+1]) trend=1;
	  if (Close[shift]<smin[shift+1]) trend=-1;

	  if(trend>0 && smin[shift]<smin[shift+1]) smin[shift]=smin[shift+1];
	  if(trend<0 && smax[shift]>smax[shift+1]) smax[shift]=smax[shift+1];

	  bsmax[shift]=smax[shift]+0.5*(MoneyRisk-1)*(smax[shift]-smin[shift]);
	  bsmin[shift]=smin[shift]-0.5*(MoneyRisk-1)*(smax[shift]-smin[shift]);

	  if(trend>0 && bsmin[shift]<bsmin[shift+1]) bsmin[shift]=bsmin[shift+1];
	  if(trend<0 && bsmax[shift]>bsmax[shift+1]) bsmax[shift]=bsmax[shift+1];

	  if (trend>0)
	  {
	     if (Signal>0 && UpTrendBuffer[shift+1]==-1.0)
	     {
	     UpTrendSignal[shift]=bsmin[shift];
	     UpTrendBuffer[shift]=bsmin[shift];
	     if(Line>0) UpTrendLine[shift]=bsmin[shift];
     if (SoundON==true && shift==0 && !TurnedUp)
         {
     Alert("BBands going Up on ",Symbol(),"-",Period());
                       TurnedUp = true;
            TurnedDown = false;
     }
	     }
	     else
	     {
	     UpTrendBuffer[shift]=bsmin[shift];
	     if(Line>0) UpTrendLine[shift]=bsmin[shift];
	     UpTrendSignal[shift]=-1;
	     }
	  if (Signal==2) UpTrendBuffer[shift]=0;
	  DownTrendSignal[shift]=-1;
	  DownTrendBuffer[shift]=-1.0;
	  DownTrendLine[shift]=EMPTY_VALUE;
	  }
	  if (trend<0)
	  {
	  if (Signal>0 && DownTrendBuffer[shift+1]==-1.0)
	     {
	     DownTrendSignal[shift]=bsmax[shift];
	     DownTrendBuffer[shift]=bsmax[shift];
	     if(Line>0) DownTrendLine[shift]=bsmax[shift];
     if (SoundON==true && shift==0 && !TurnedDown)
         {
     Alert("BBands going Down on ",Symbol(),"-",Period());
            TurnedDown = true;
            TurnedUp = false;
     }
	     }
	     else
	     {
	     DownTrendBuffer[shift]=bsmax[shift];
	     if(Line>0)DownTrendLine[shift]=bsmax[shift];
	     DownTrendSignal[shift]=-1;
	     }
	  if (Signal==2) DownTrendBuffer[shift]=0;
	  UpTrendSignal[shift]=-1;
	  UpTrendBuffer[shift]=-1.0;
	  UpTrendLine[shift]=EMPTY_VALUE;
	  }

	 }
	return(0);
 }
Comments