Indicator

Auto TL 04 fibo

Indicator

Auto TL 04

Indicator

Auto TL 04a

Indicator

Auto TL 05 Line Chart

Indicator

Auto TL.03~(2)

Auto-Pivot Plotter  V1-3
Indicator

Auto-Pivot Plotter V1-3

This indicator automatically identifies and plots daily support and resistance levels by calculating floor, ceiling, and midpoint values based on previous session price extremes.

Auto-Pivot Plotter  V1-41
Indicator

Auto-Pivot Plotter V1-41

This indicator calculates and plots daily pivot points, resistance, and support levels by extracting historical price extremes from the previous trading session.

Auto-Pivot Plotter (Mid-Levels)  V1-3
Indicator

Auto-Pivot Plotter (Mid-Levels) V1-3

This indicator automatically calculates and plots equidistant sub-levels between primary daily pivot points to identify granular price supply and demand zones.

Indicator

Auto-Pivot Plotter Labels

Auto-Pivot Plotter Monthly
Indicator

Auto-Pivot Plotter Monthly

This indicator dynamically projects monthly pivot levels and Fibonacci retracement zones by calculating price equilibrium based on the previous month's high, low, and closing values.

Auto-Pivot Plotter Weekly  V1-00
Indicator

Auto-Pivot Plotter Weekly V1-00

This indicator dynamically projects weekly support and resistance levels by calculating pivot points based on historical weekly price extremes with an optional toggle for Fibonacci retracement ratios.

Indicator

AutoDayFibs V1.0

Indicator

AutoDayFibs

AutoDayFibs1
Indicator

AutoDayFibs1

This indicator automatically calculates and plots a comprehensive suite of Fibonacci retracement and extension levels based on the high and low price action of previous daily candles.

Indicator

AutoDayFibs2

AutoDayFibsWhiteKnight
Indicator

AutoDayFibsWhiteKnight

This indicator automatically maps key Fibonacci retracement and extension levels based on the price range of previous daily sessions.

AutoDayFibsWhiteKnightv2
Indicator

AutoDayFibsWhiteKnightv2

This indicator automatically calculates and plots multi-level Fibonacci retracement and extension levels based on the price range of specified historical daily candles.

AutoDayFibsWhiteKnightv2_v1
Indicator

AutoDayFibsWhiteKnightv2_v1

This indicator automatically calculates and plots multi-level Fibonacci retracement and extension levels based on the high and low price points of preceding daily candles.

AutoDayFibsWhiteKnight_v1
Indicator

AutoDayFibsWhiteKnight_v1

This indicator automatically identifies the high and low price points of previous daily candles to project key Fibonacci retracement and extension levels onto the current chart.

AutoDayFibs_001
Indicator

AutoDayFibs_001

This indicator dynamically projects automated Fibonacci retracement levels by switching between historical and real-time daily price extremes based on a user-defined hourly transition point.

Indicator

autodayfibs_v1

Indicator

AutoDayFibs_v2

AutoFib
Indicator

AutoFib

This indicator automatically maps dynamic Fibonacci retracement levels and identifies high-probability supply and demand zones based on historical price extremes and trend polarity.

Indicator

AutoGraf_Kapel_indic

Automatic Stop Loss Setter
Indicator

Automatic Stop Loss Setter

An automated trade manager that dynamically shifts stop-loss levels to break-even or profit-locking points based on price movement intensity and predefined threshold limits.

AutoPivotIndicator
Indicator

AutoPivotIndicator

This indicator dynamically projects concurrent daily, weekly, and monthly pivot points along with their respective support and resistance levels while accounting for specific weekend market gaps.

AutoPivotIndicator_001
Indicator

AutoPivotIndicator_001

This indicator dynamically projects daily, weekly, and monthly pivot points and support/resistance levels while incorporating a specialized logic to exclude Sunday session data for precise price action analysis.

AutoPivotIndicator_002
Indicator

AutoPivotIndicator_002

This indicator dynamically projects daily, weekly, and monthly pivot points along with their respective support and resistance levels using historical price extremes.

AutoPivotIndicator_003
Indicator

AutoPivotIndicator_003

This indicator dynamically projects daily, weekly, and monthly pivot points alongside comprehensive support and resistance levels while automatically compensating for weekend market gaps.

AutoPivotIndicator_v1
Indicator

AutoPivotIndicator_v1

AutoPivotIndicator_ver5
Indicator

AutoPivotIndicator_ver5

This indicator automatically projects daily, weekly, and monthly pivot points alongside secondary support/resistance levels and mid-point divisions while dynamically filtering out non-trading weekend data.

AutoTrendChannel
Indicator

AutoTrendChannel

The indicator calculates a linear regression line to identify the primary price trajectory and projects a multi-layered channel based on volatility extremes.

Autotrendlinien
Indicator

Autotrendlinien

The algorithm utilizes linear regression coefficients to identify significant price extremes and projects a tri-line channel based on the maximum local variance from the trend line.

AV
Indicator

AV

This indicator calculates the rate of change between price midpoints and extremes over a specific period to identify momentum acceleration and volatility expansion.

AvalsLevels
Indicator

AvalsLevels

The algorithm identifies significant price reversals by filtering recursive peak and trough extrema based on a user-defined minimum momentum threshold.

Indicator

Average Range

Indicator

Average Range_v1

Average Size Bar
Indicator

Average Size Bar

This indicator calculates the rolling average of price bar ranges using multiple moving average methodologies to visualize historical volatility trends.

Average Size Bar_v1
Indicator

Average Size Bar_v1

This indicator calculates the moving average of the price range between high and low values to quantify historical volatility across different smoothing methods.

Indicator

Average_Range

Average_Range_OH_OL_OHL_HL_OC_W
Indicator

Average_Range_OH_OL_OHL_HL_OC_W

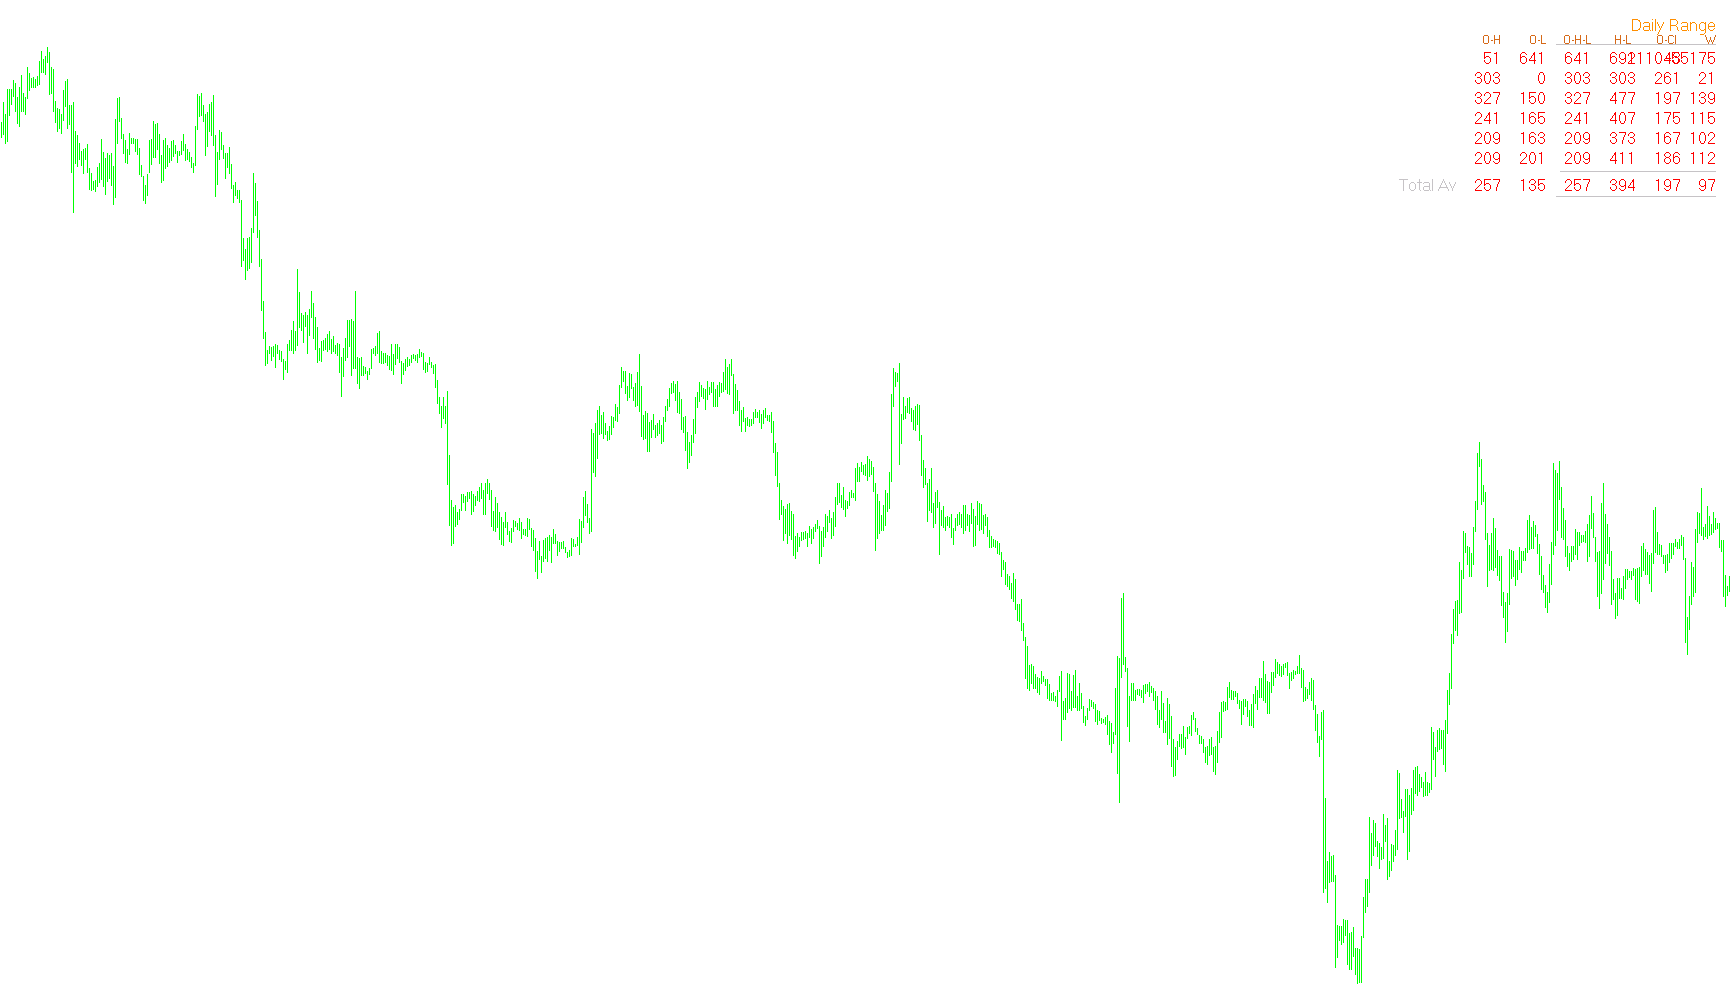
This indicator aggregates and displays various statistical metrics of price action, including high-low ranges and price spreads, across multiple predefined historical lookback periods on a single dashboard.

Average_Size_Bar
Indicator

Average_Size_Bar

This indicator calculates the rolling average price range of candles using SMA, EMA, SMMA, and LWMA smoothing techniques to quantify historical volatility.

Indicator

Avg Daily Range

Indicator

Avg Daily Range_v1

Indicator

AvgRangeM

Indicator

AvgRangeM_v1

Indicator

AvgRangeX

AV_v1
Indicator

AV_v1

The indicator calculates the rate of change between current price midpoints and extremes relative to a historical lookback period to visualize acceleration and deceleration in market momentum.

Awesome User Variable
Indicator

Awesome User Variable

iMA

This indicator quantifies market momentum by calculating the divergence between short and long moving averages and visually distinguishing directional shifts via a color-coded histogram.

Awesome
Indicator

Awesome

iMA

The logic computes the difference between two simple moving averages to identify momentum shifts and visualizes trend strength through dual-colored histogram bars.