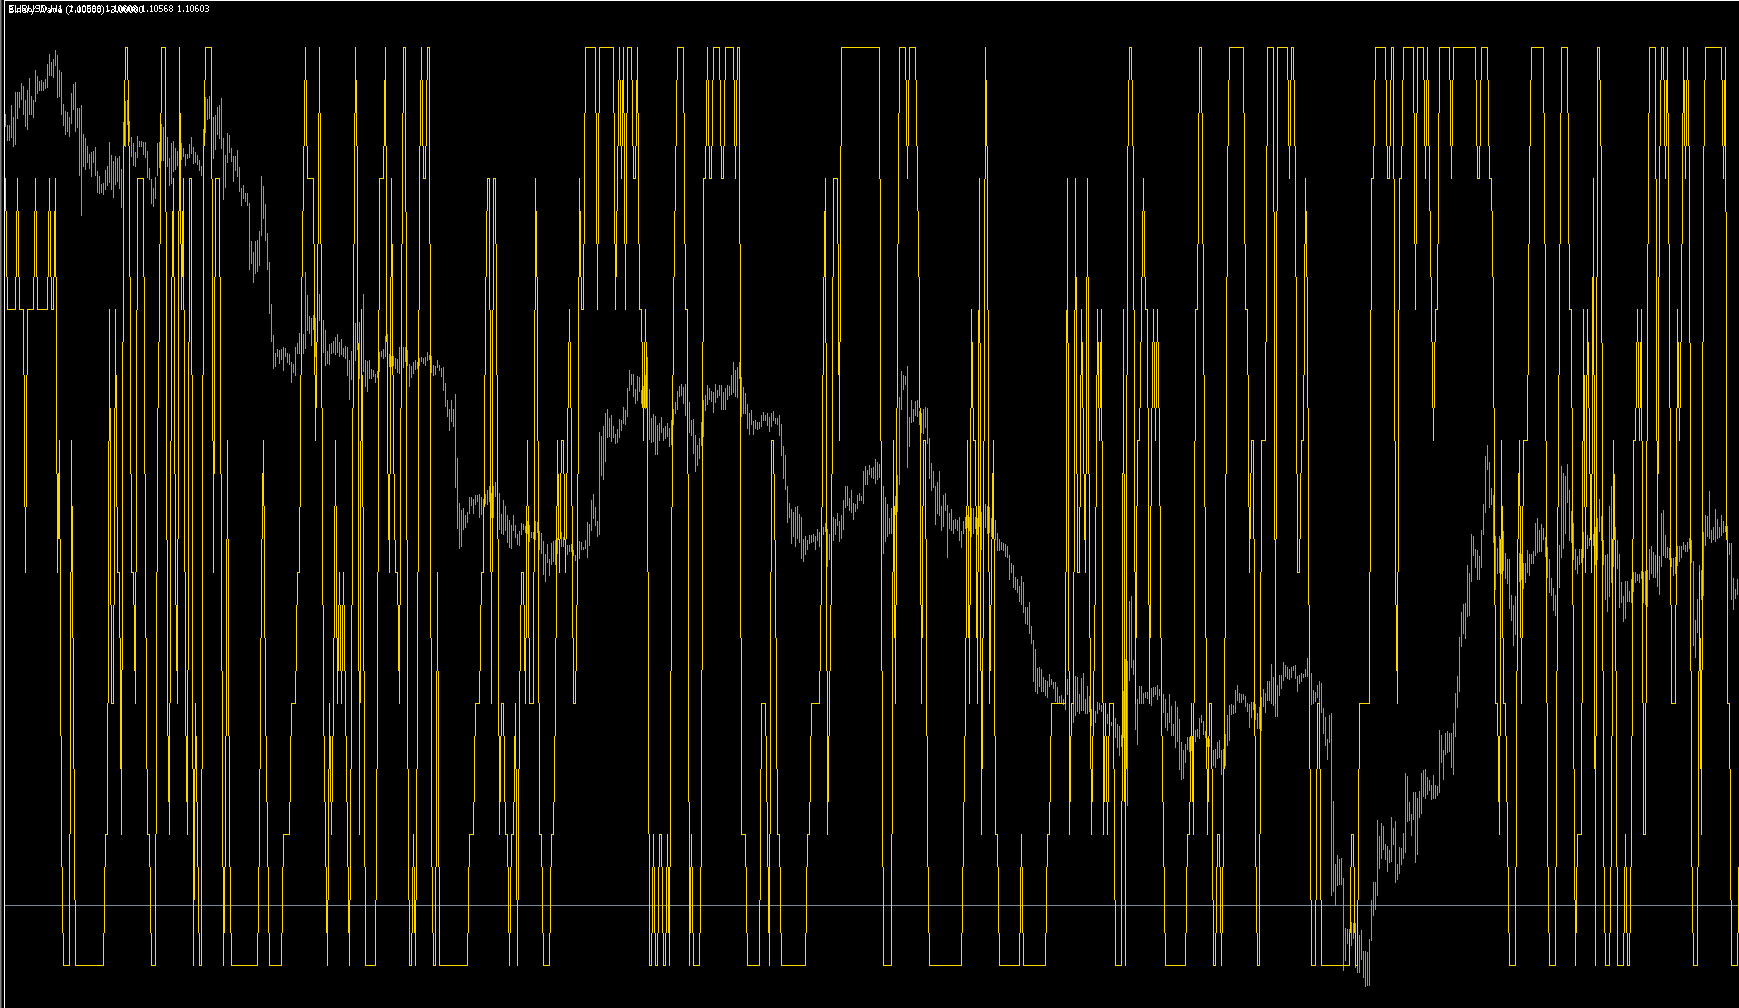
Better_H1_diff_001
Indicator

Better_H1_diff_001

iMA

This indicator calculates and visualizes the arithmetic spread between multiple Simple Moving Average periods across higher timeframes to identify momentum shifts.

Better_H1_diff_1
Indicator

Better_H1_diff_1

iMA

This indicator calculates and visualizes the price velocity by determining the differential spreads between multiple Simple Moving Averages across varying timeframe offsets.

Better_H1_diff_2
Indicator

Better_H1_diff_2

iMA

This indicator calculates and visualizes the relative distance between three different Simple Moving Average periods across hourly timeframes to identify momentum shifts.

Better_H4
Indicator

Better_H4

iMA

This indicator synchronizes and visualizes three distinct Simple Moving Average values derived from the H4 timeframe across different chart intervals.

Better_H4_1
Indicator

Better_H4_1

iMA

This indicator synchronizes and displays Simple Moving Average values from 5-minute, 1-hour, and 4-hour timeframes onto the current chart to identify high-level trend alignment.

Better_H4_2
Indicator

Better_H4_2

iMA

This indicator synchronizes and plots high-timeframe 5, 10, and 15-period Simple Moving Averages onto a lower timeframe chart to visualize long-term trend dynamics.

Better_H4_diff
Indicator

Better_H4_diff

iMA

This indicator calculates the price differential between three distinct Simple Moving Average lengths across high-timeframe periods to reveal underlying trend momentum.

Better_H4_diff_1
Indicator

Better_H4_diff_1

iMA

This indicator calculates and visualizes the variance between multiple Simple Moving Averages across different timeframes to identify momentum shifts.

Better_H4_diff_2
Indicator

Better_H4_diff_2

iMA

This indicator calculates the numerical variance between multiple Simple Moving Averages on the H4 timeframe to identify structural price momentum shifts.

Better_M5
Indicator

Better_M5

iMA

This indicator maps and aligns Simple Moving Averages across 5-minute, 1-hour, and 4-hour timeframes onto a single display to identify multi-layered trend alignment.

Better_M5_1
Indicator

Better_M5_1

iMA

This indicator synchronizes and maps simple moving averages across disparate timeframes (M5, H1, and H4) onto a single visual buffer to identify structural trend alignment.

Better_M5_2
Indicator

Better_M5_2

iMA

This indicator synchronizes and plots Simple Moving Averages from M5, H1, and H4 timeframes onto a single visual buffer to identify price trends across concurrent intervals.

Better_M5_diff
Indicator

Better_M5_diff

iMA

This indicator calculates the differential spread between multiple Simple Moving Average periods (5, 10, and 15) to identify momentum velocity and price curvature.

Better_M5_diff_001
Indicator

Better_M5_diff_001

iMA

This indicator calculates the relative price dispersion between three Simple Moving Averages of varying lengths (5, 10, and 15) across different timeframes to visualize momentum variance.

Better_MA_H1
Indicator

Better_MA_H1

iMA

This indicator aligns and plots Simple Moving Averages from three different instruments onto a synchronized timeline based on specific historical bar counts.

Better_MA_H4
Indicator

Better_MA_H4

iMA

This indicator aligns and plots Simple Moving Averages from multiple assets onto a single timeline by synchronizing their specific historical bar offsets based on exact time coordinates.

Better_MA_M5
Indicator

Better_MA_M5

iMA

This indicator synchronizes and plots Simple Moving Averages of varying lengths across three distinct symbols onto a single temporal timeline.

BETTER_YZGraphOnLine
Indicator

BETTER_YZGraphOnLine

This script parses trade history and active positions to dynamically render graphical markers, trend lines, and profit/loss annotations on the chart while simultaneously logging transaction data to an external binary file.

BETTER_YZGraphOnLine_W
Indicator

BETTER_YZGraphOnLine_W

This script parses historical and active trade data to generate visual trend lines, entry/exit arrows, profit markers, and an automated log file of all executed operations.

Bezier_orig
Indicator

Bezier_orig

iMA

This indicator applies a probabilistic distribution weight to historical price points to generate a fluid, non-linear trend curve.

BH-Ergodic
Indicator

BH-Ergodic

iMAOnArray

This indicator calculates a normalized price momentum ratio by applying successive exponential moving averages to price deltas and their absolute values to identify smoothed trend directions.

BH-Ergodic_002
Indicator

BH-Ergodic_002

iMAOnArray

This indicator calculates price velocity by applying nested exponential moving averages to relative price deltas, providing a smoothed ratio of directional momentum versus absolute volatility.

Bheurekso_pattern
Indicator

Bheurekso_pattern

This MetaTrader indicator identifies and visually highlights various bullish and bearish candlestick patterns (Engulfing, Piercing, Morning/Evening Star, Hammer, Dark Cloud, and Shooting Star) on the chart, displaying arrows and labels to indicate their occurrence based on price action.

bias
Indicator

bias

iMA

This indicator quantifies the percentage variance between current market closing prices and the exponential moving average to determine directional momentum.

bias_LineHisto
Indicator

bias_LineHisto

iMA

This indicator quantifies market momentum by calculating the percentage variance between current closing prices and a dynamic exponential moving average.

Bid High Low Alert
Indicator

Bid High Low Alert

Bid_View1.2
Indicator

Bid_View1.2

This indicator provides a real-time visual dashboard displaying the current bid price with dynamic color transitions based on tick movement, complemented by daily range calculations and directional trend markers.

Indicator

Bid_View1.6

iMA
Indicator

Bid_View2.0

iMA
Indicator

Bid_View2.0M

iMA
Big Tick 2
Indicator

Big Tick 2

This indicator visualizes significant price fluctuations by plotting distinct arrow markers when the asset deviates from its previous value by predefined point increments.

Big trend
Indicator

Big trend

iMAiMAOnArray

This indicator calculates a smoothed Hull Moving Average to identify momentum shifts and visualize distinct bullish and bearish trend segments on the chart.

Big trend_001
Indicator

Big trend_001

iMAiMAOnArray

This indicator identifies price momentum by calculating the square root weighted variance of double-weighted weighted moving averages to pinpoint directional shifts.

BinaryWave
Indicator

BinaryWave

iCCIiMACDiOsMAiMA
BLines_Profi_en
Indicator

BLines_Profi_en

This indicator calculates static and dynamic equilibrium levels, Fibonacci-based support/resistance zones, and aggregated step averages by synchronizing high-timeframe data with real-time price action.

BLines_Profi_en_001
Indicator

BLines_Profi_en_001

This indicator calculates static and dynamic equilibrium points, Fibonacci-based support/resistance levels, and multi-period average steps by synchronizing price action across disparate timeframes.

BLines_Profi_en_v1
Indicator

BLines_Profi_en_v1

This indicator calculates static and dynamic equilibrium points by synchronizing price action across higher timeframes to identify structural support, resistance, and Fibonacci retracement levels.

BLines_Profi_en_v2
Indicator

BLines_Profi_en_v2

This indicator projects static and dynamic balance levels, Fibonacci support/resistance zones, and averaged step values by synthesizing price extremes from higher timeframes onto the current chart.

BLines_Profi_v1
Indicator

BLines_Profi_v1

This indicator calculates dynamic and static balance points, support, and resistance levels by synchronizing price action across multiple timeframes using Fibonacci retracement ratios.

BLines_Profi_v1_v1
Indicator

BLines_Profi_v1_v1

This indicator calculates dynamic balance points and support/resistance zones by synthesizing high-timeframe price action with localized Fibonacci retracement levels.

Blur's Prices&Time
Indicator

Blur's Prices&Time

iCCIiATRiRSIiStochastic

This indicator dynamically visualizes real-time bid/ask prices and time stamps on the chart while dynamically color-coding them based on synchronized RSI, Stochastic, and CCI momentum thresholds.

BO
Indicator

BO

iMA

This indicator calculates the relative position of a custom NavelSMA value between two different simple moving average envelopes to determine momentum shifts.

BobCCI2levelsingle
Indicator

BobCCI2levelsingle

iMAOnArray

This indicator identifies trend reversals by calculating a smoothed ratio of relative price velocity against its absolute volatility magnitude using nested exponential moving averages.

BobokusFibo
Indicator

BobokusFibo

This indicator automatically plots multi-layered Fibonacci retracement levels and daily price targets based on the previous day's high, low, and range volatility.

BobokusFibo_v1
Indicator

BobokusFibo_v1

This indicator dynamically plots three distinct Fibonacci arrays based on daily price extremes to identify long-term targets, intraday pivots, and structural retracements.

BobokusFibo_v2
Indicator

BobokusFibo_v2

This indicator dynamically renders automated long and short trend projections alongside intraday pivot levels based on preceding high/low price ranges.

BobokusFibo_v2_v1
Indicator

BobokusFibo_v2_v1

This indicator dynamically renders long, short, and intraday Fibonacci retracement levels based on historical price extremes from specific higher timeframes.

Indicator

BollinderBands_MTF

iBands
Bollinger %b
Indicator

Bollinger %b

iBands
bollinger band ema
Indicator

bollinger band ema

iMA

This indicator calculates dynamic price boundaries by projecting standard deviation offsets from an Exponential Moving Average to identify market extremes.