InnBar_mtf
Indicator

InnBar_mtf

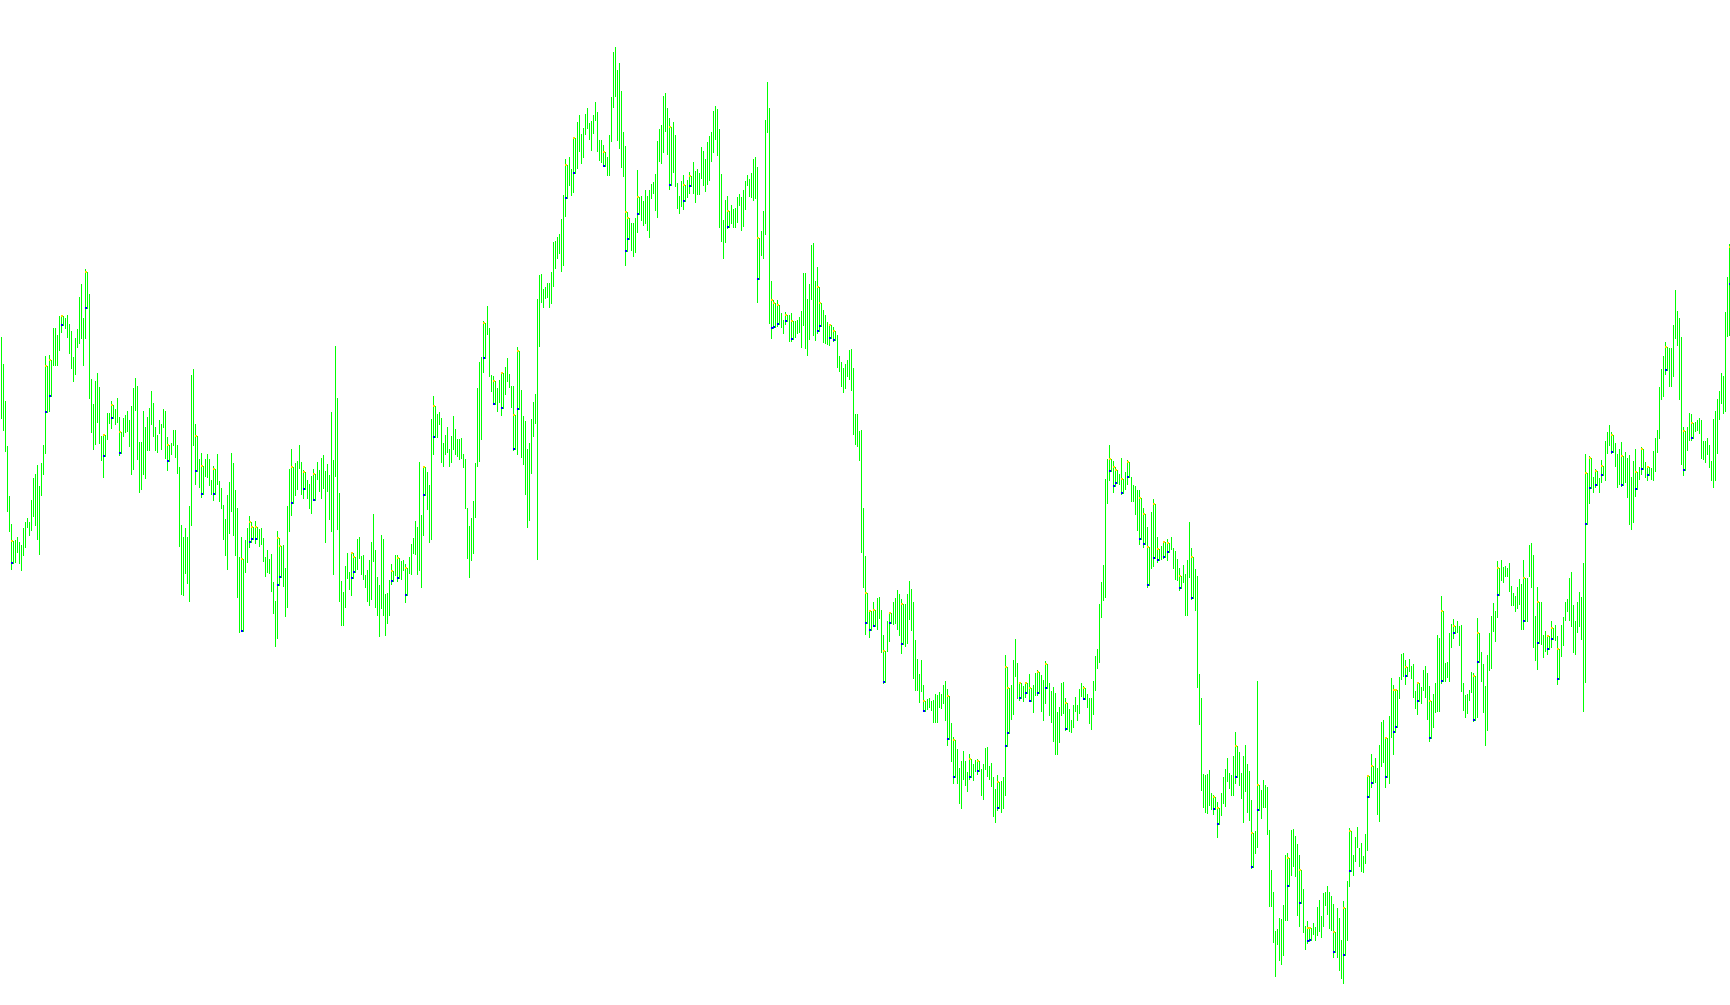
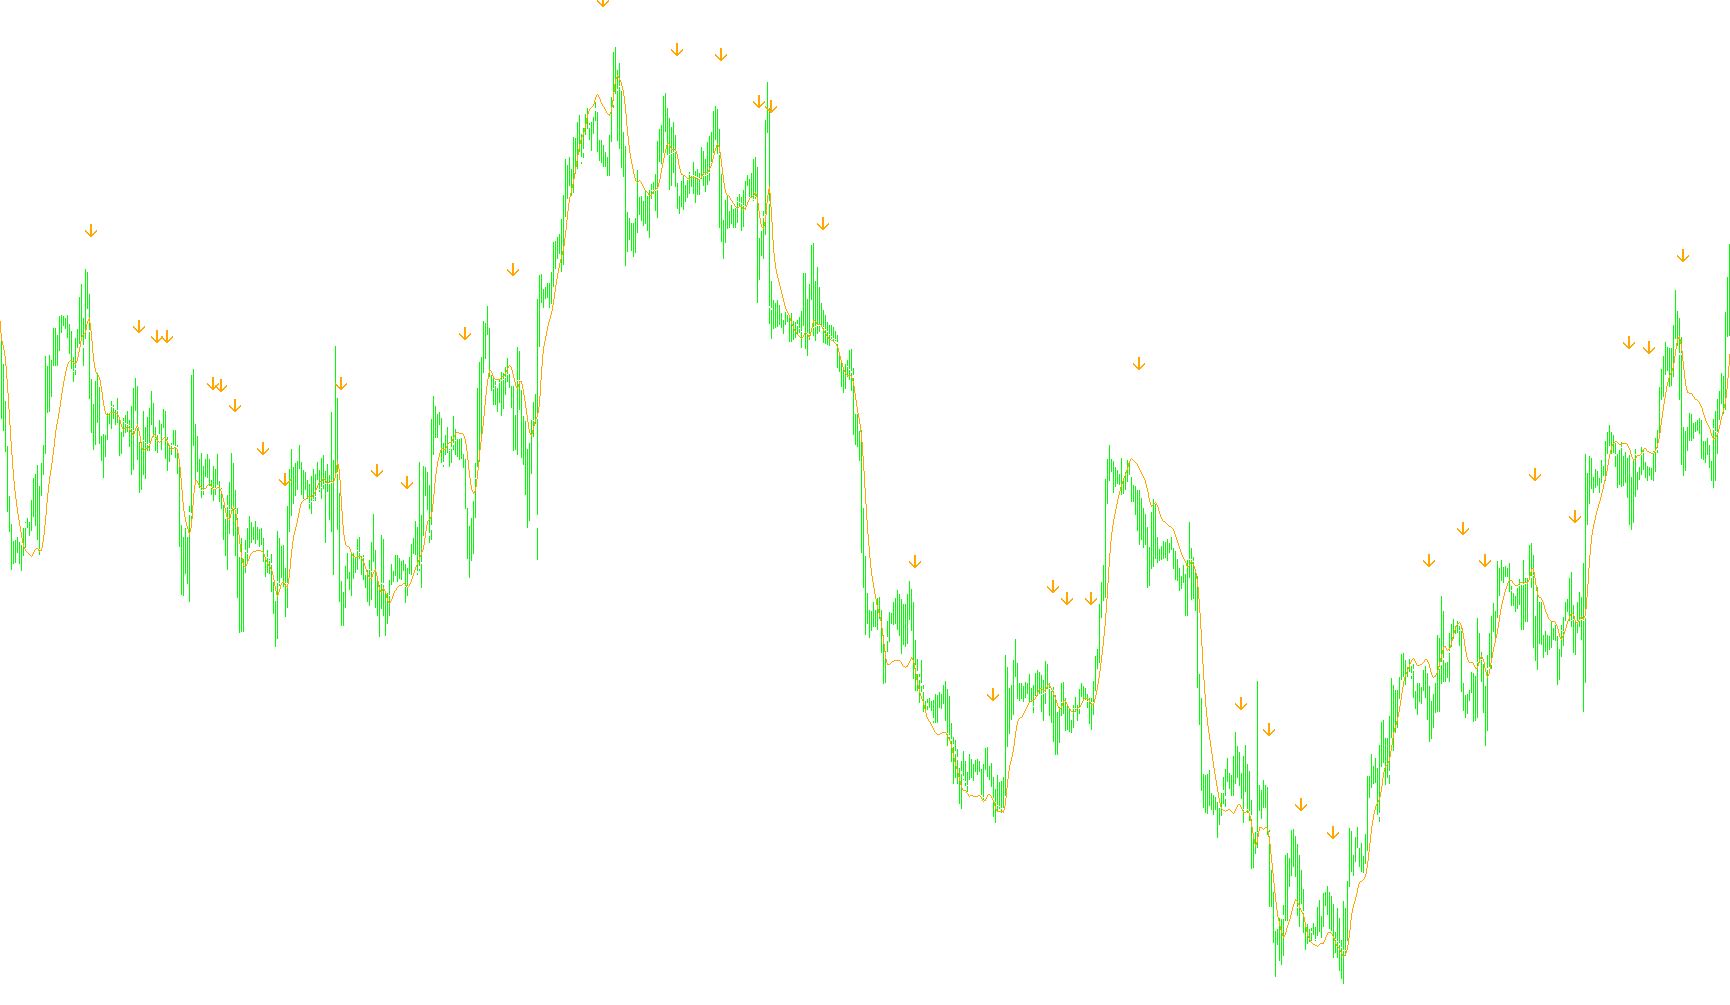
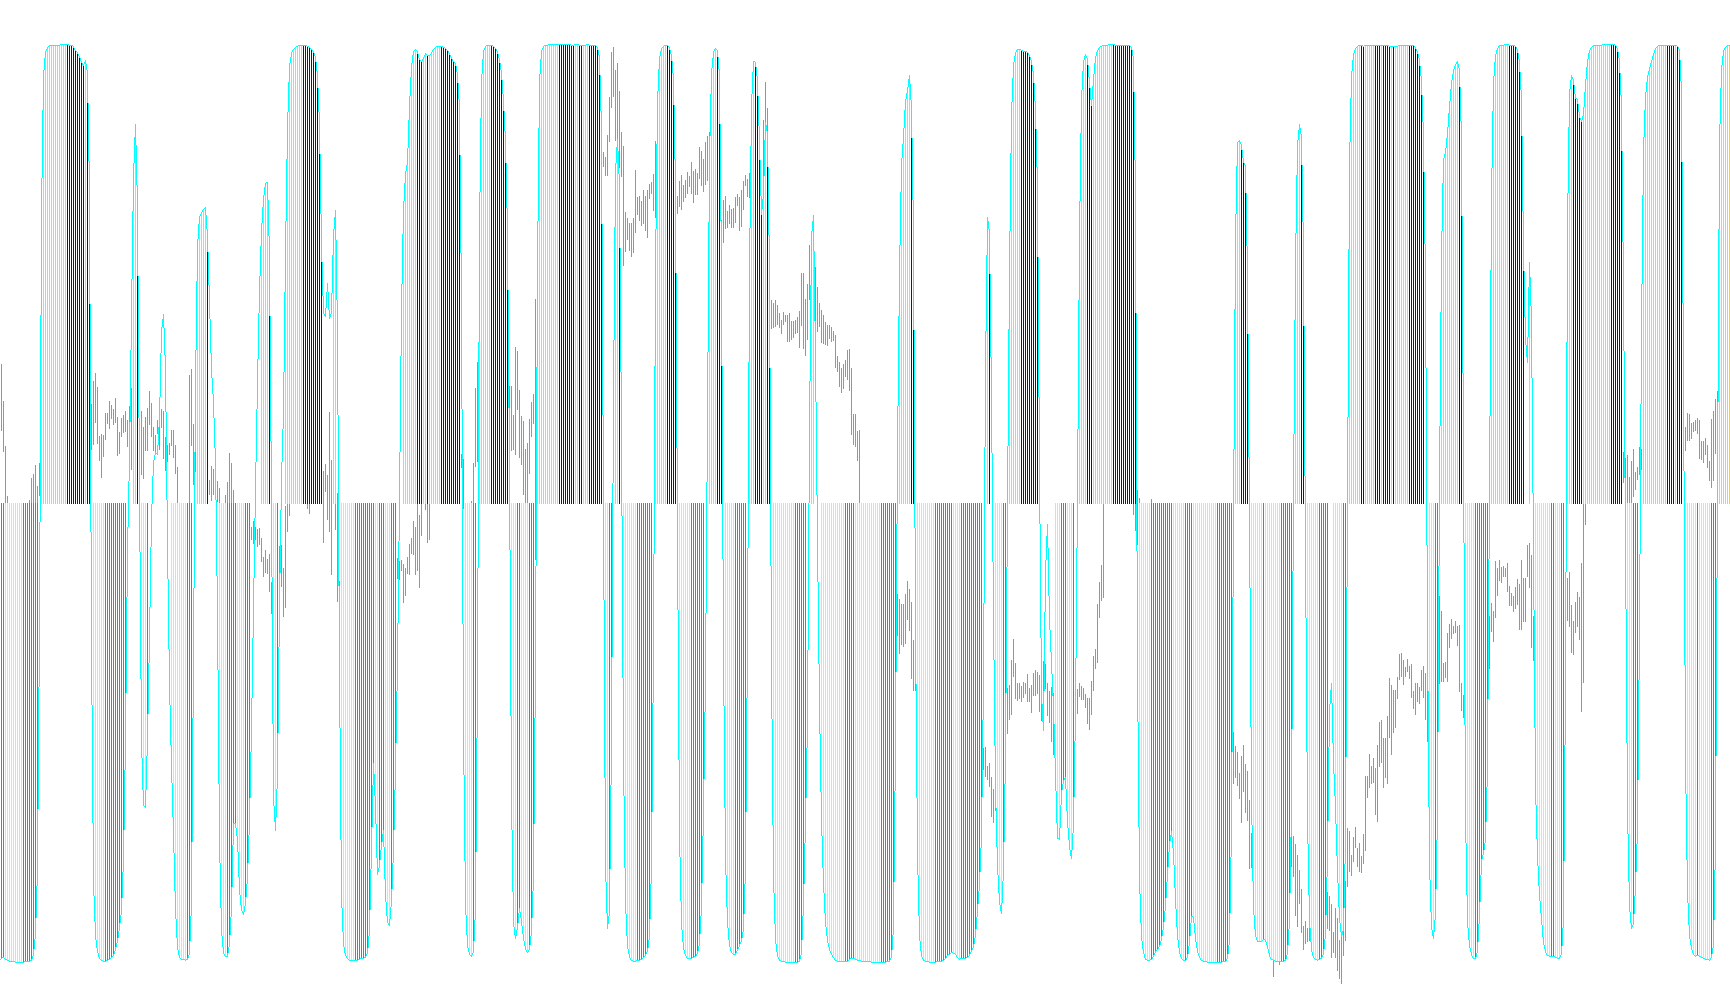
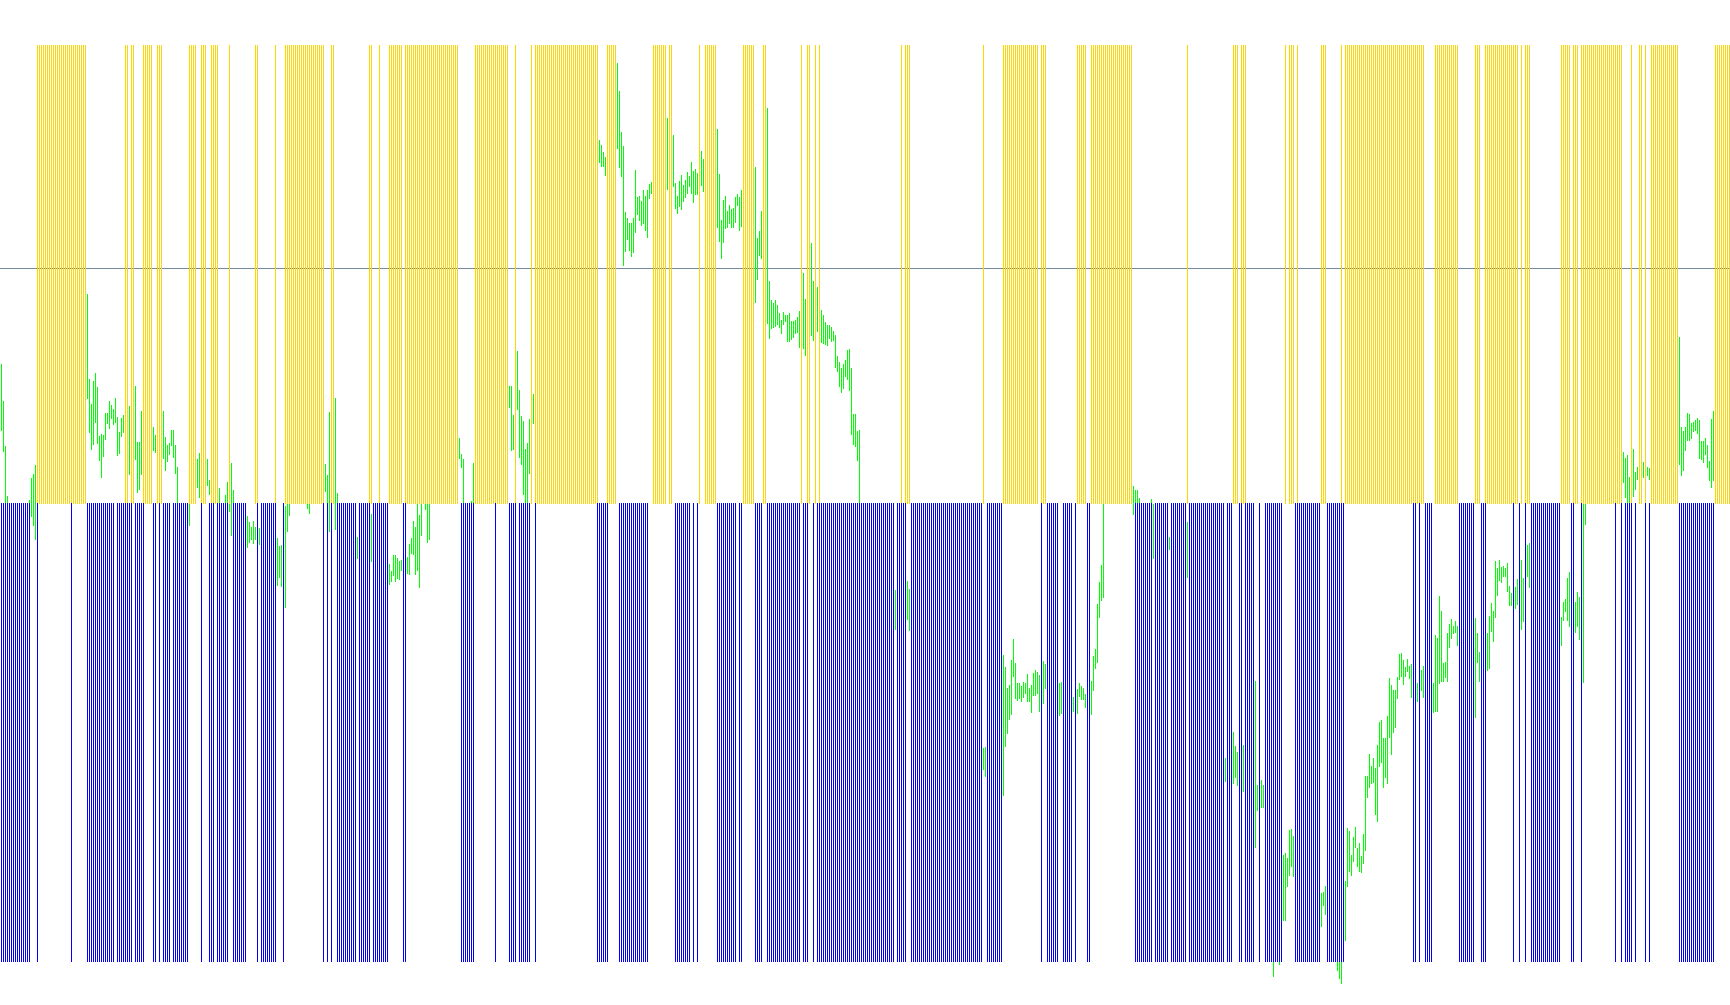
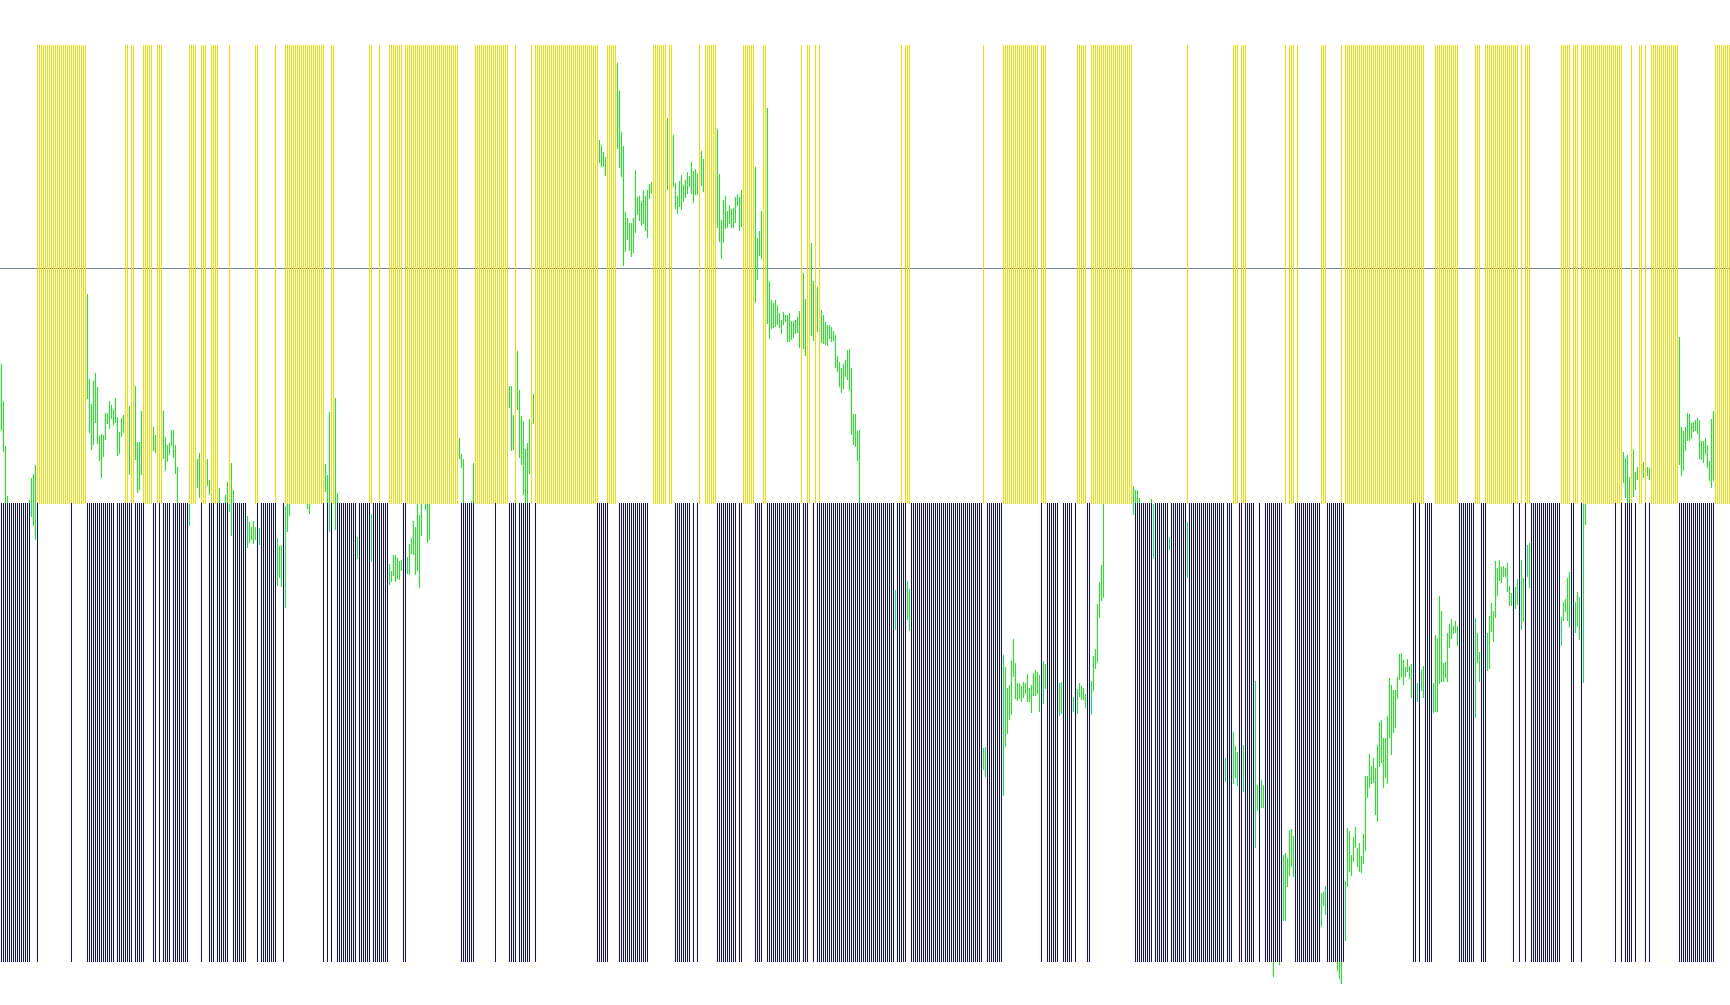
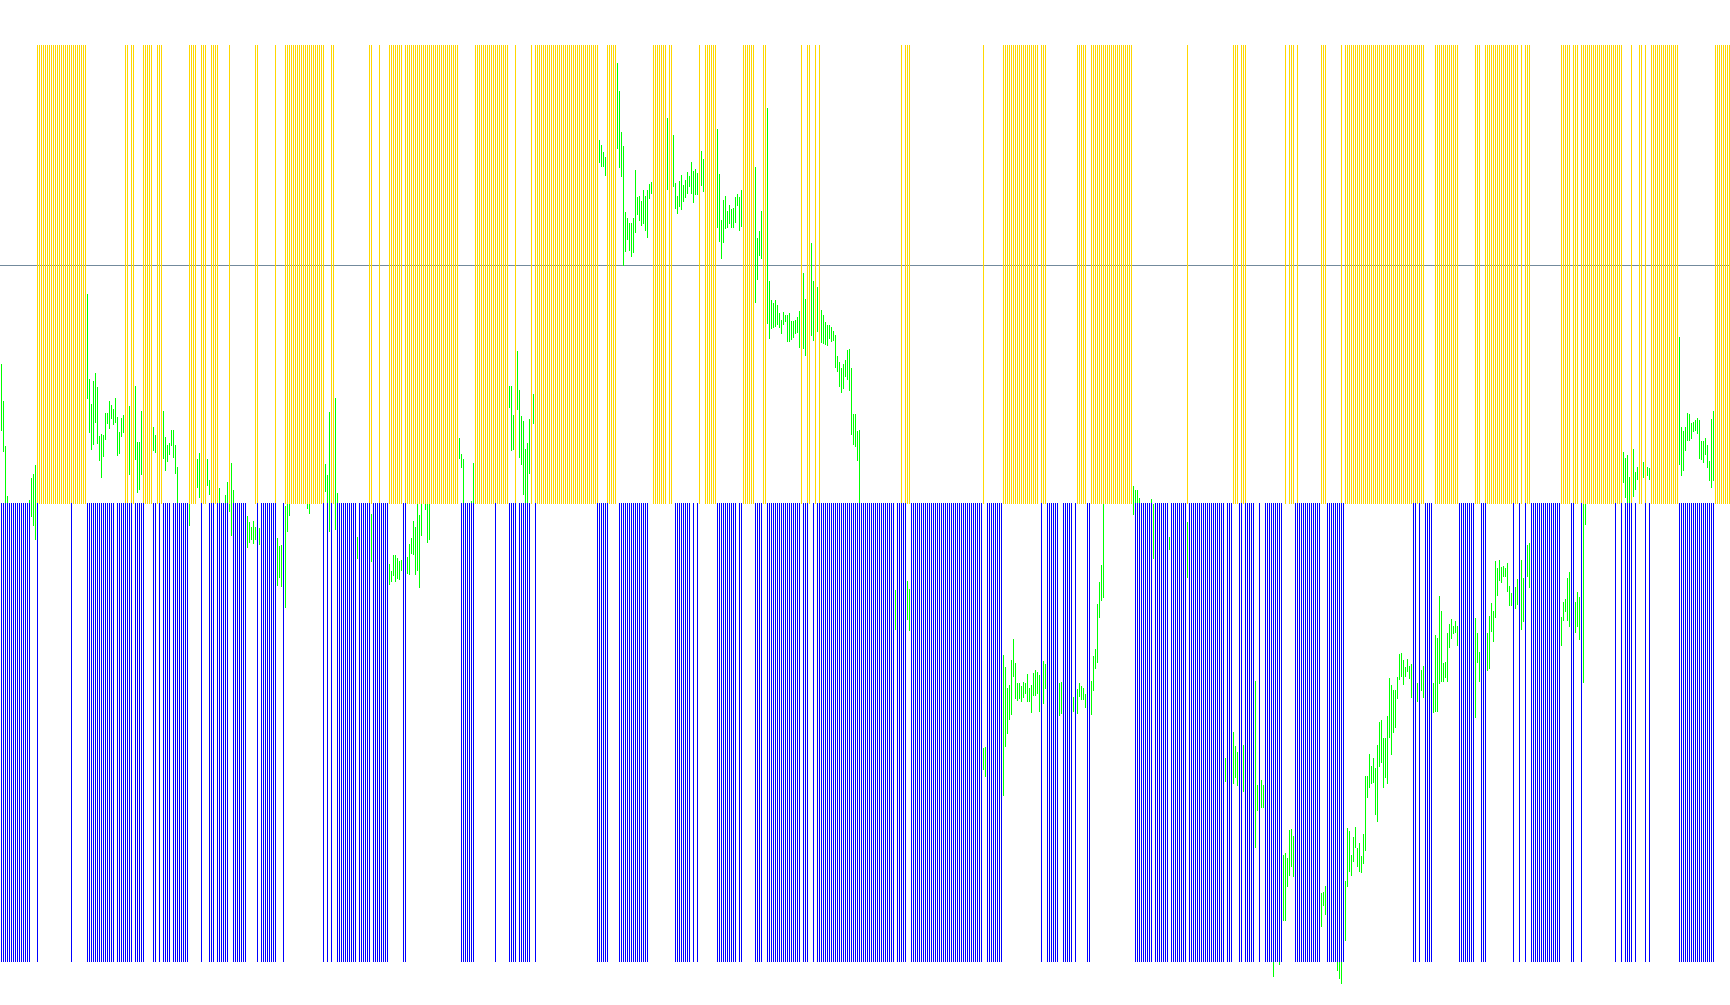
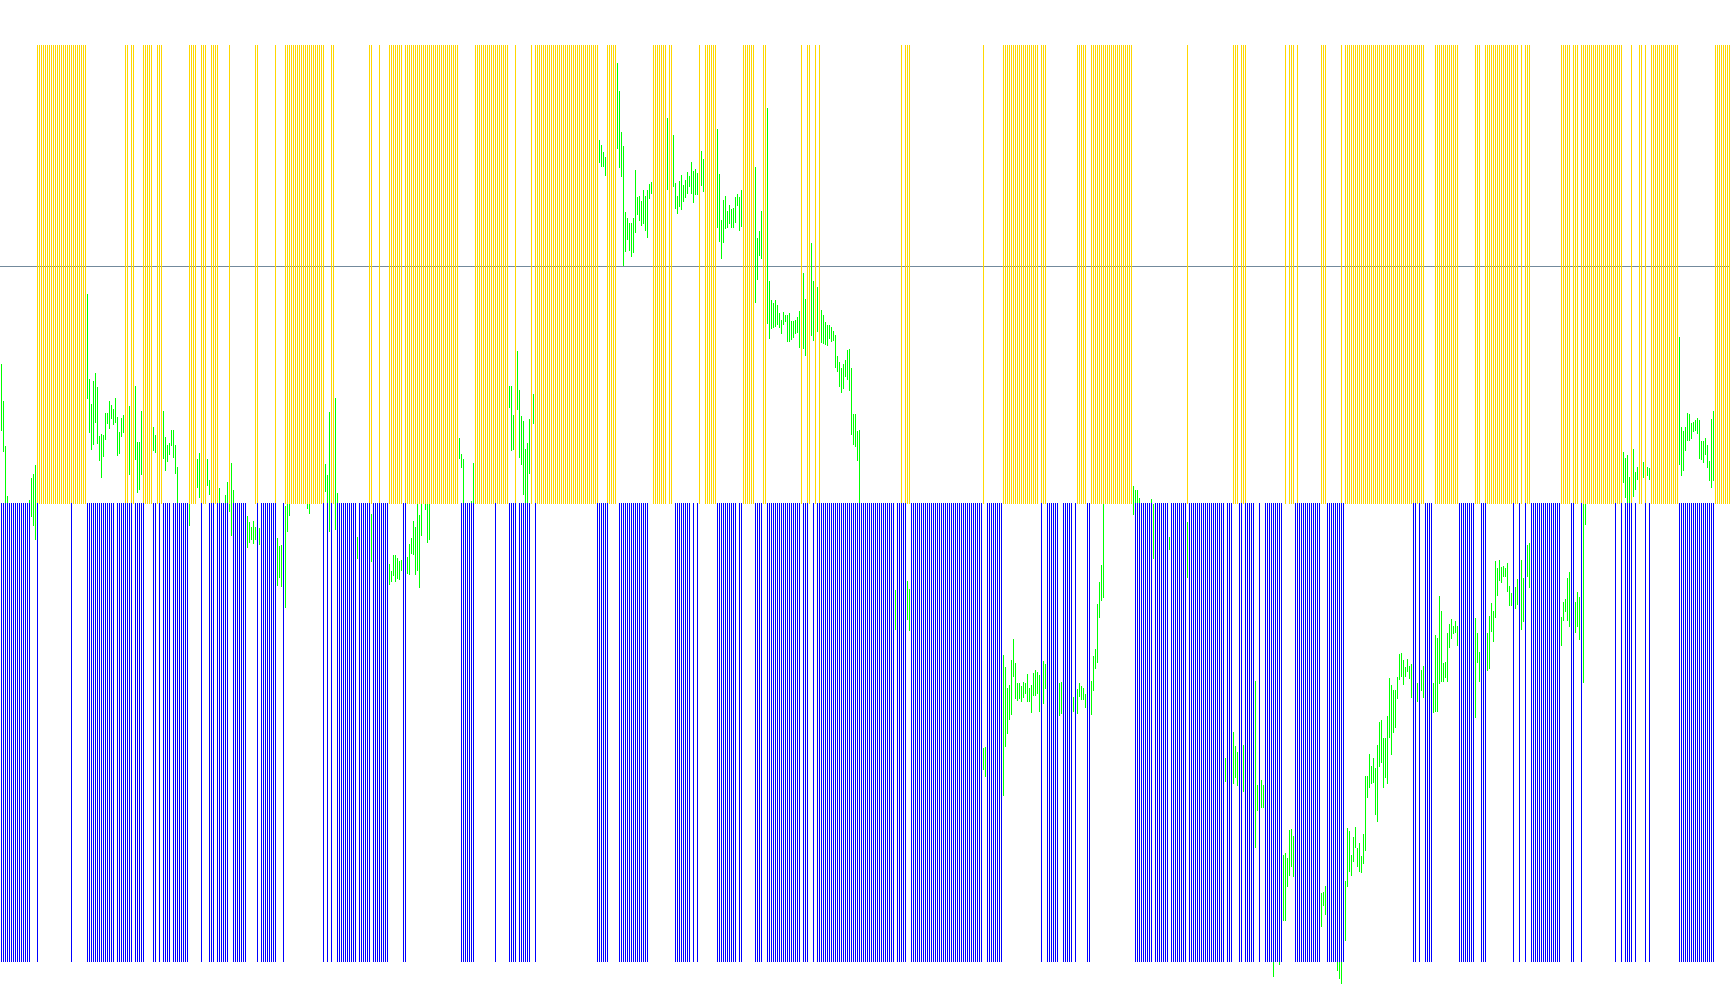
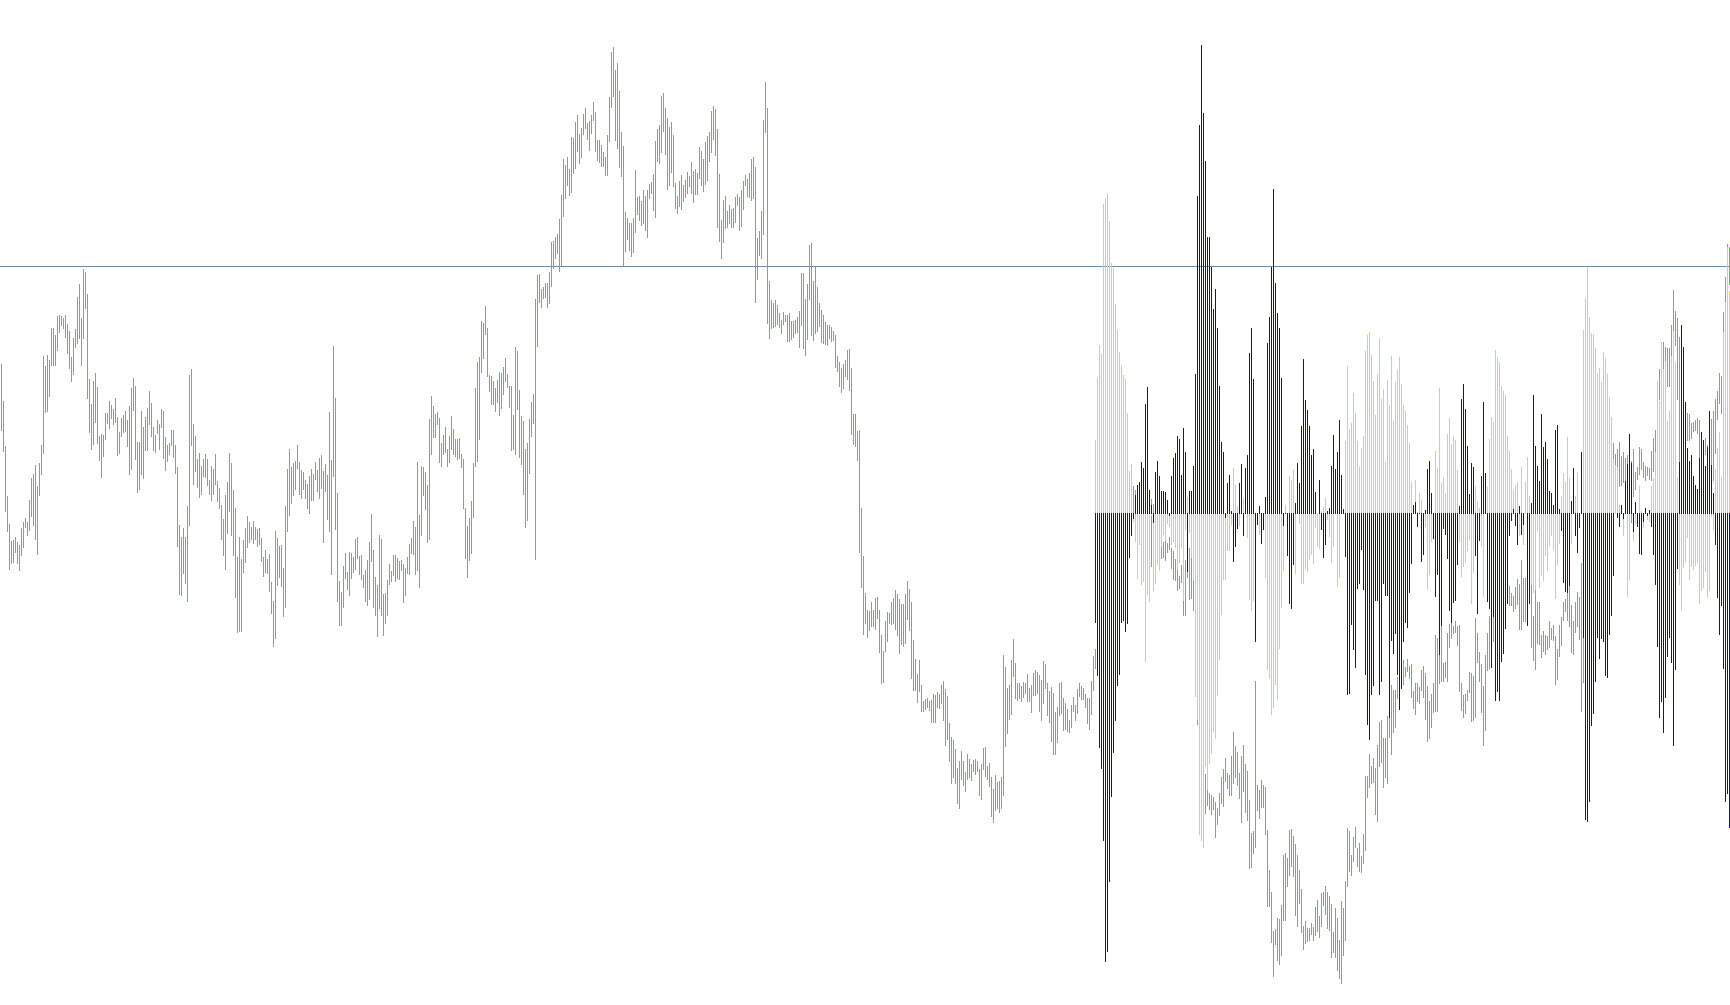
This indicator identifies multi-timeframe price action instances where a current candle's high and low boundaries are strictly contained within the previous candle's range.

InnBar_mtf_v1
Indicator

InnBar_mtf_v1

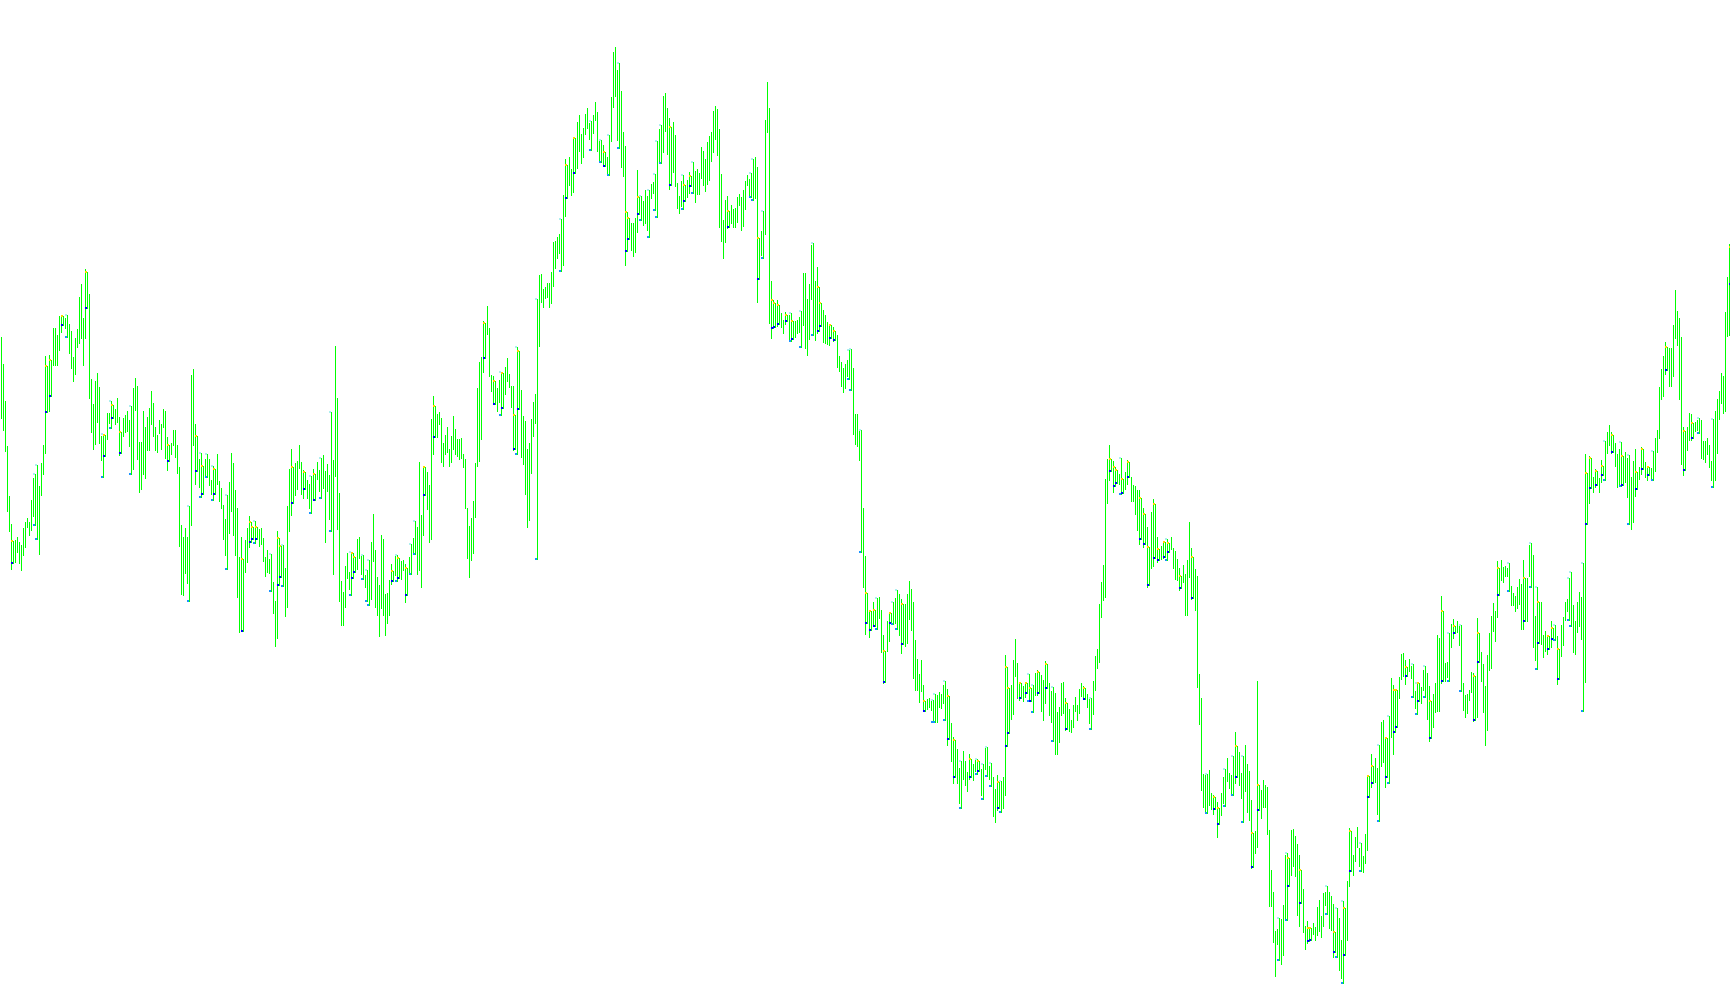
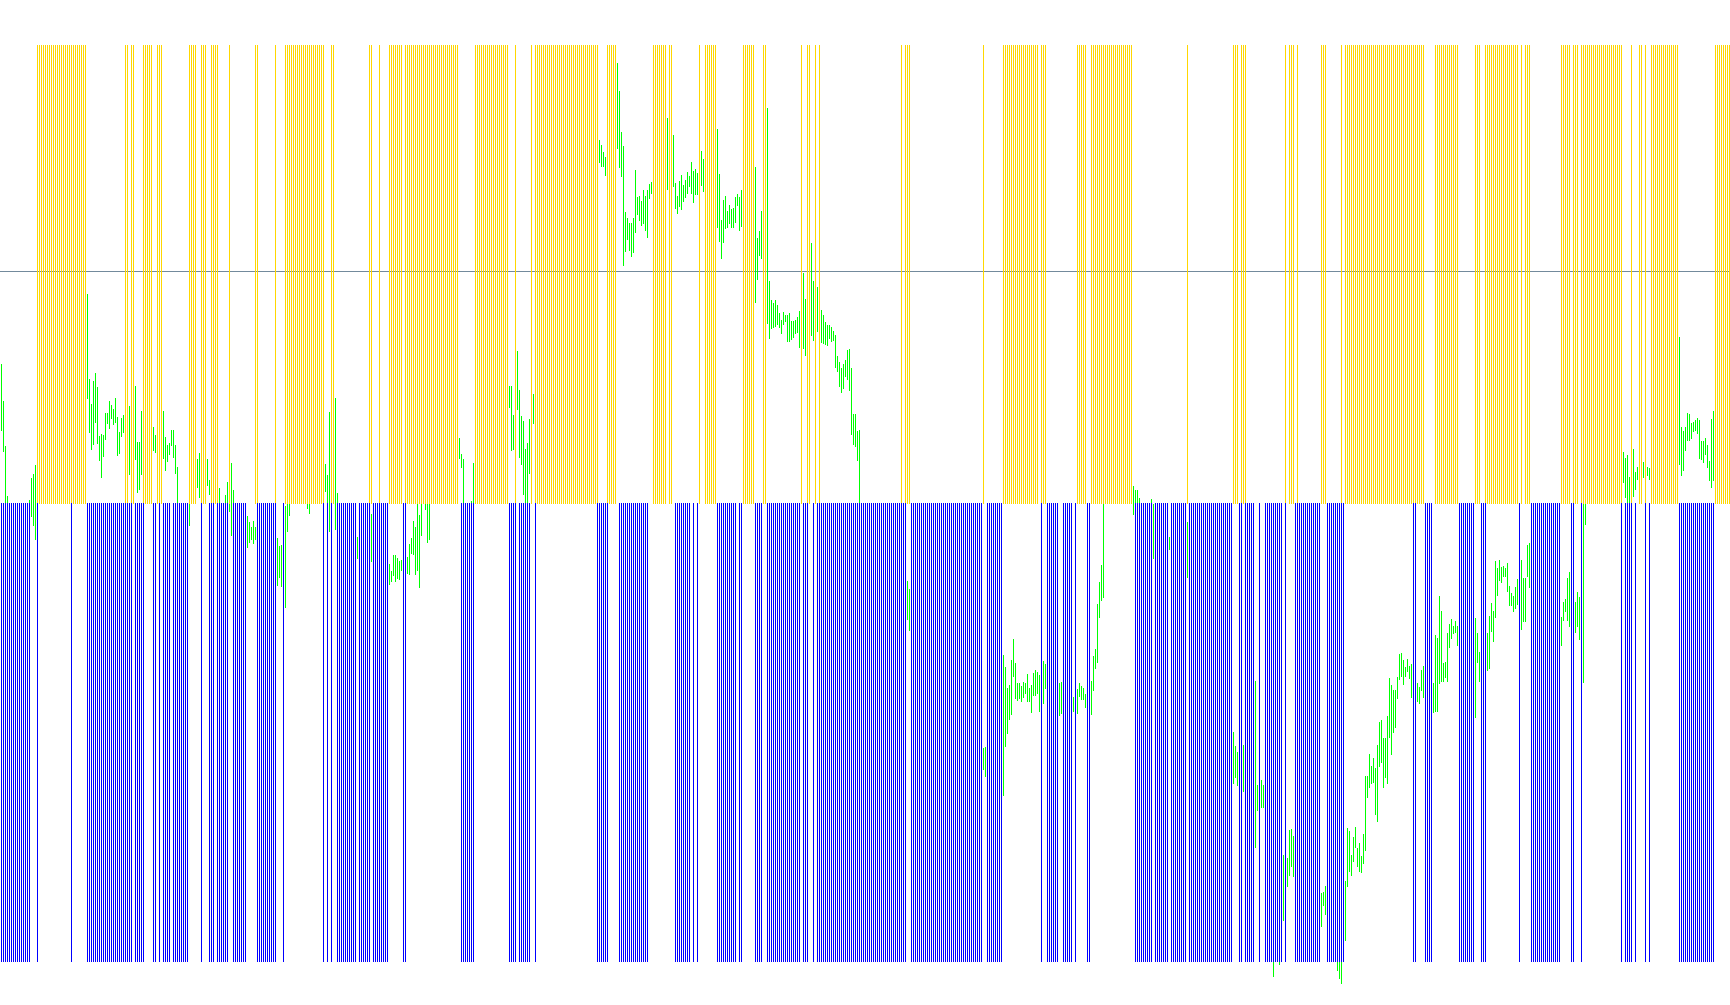
Identifies historical price consolidation zones by detecting instances where a candle's range is entirely contained within the preceding bar's high and low boundaries on a specific higher timeframe.

InnOutBar_mtf
Indicator

InnOutBar_mtf

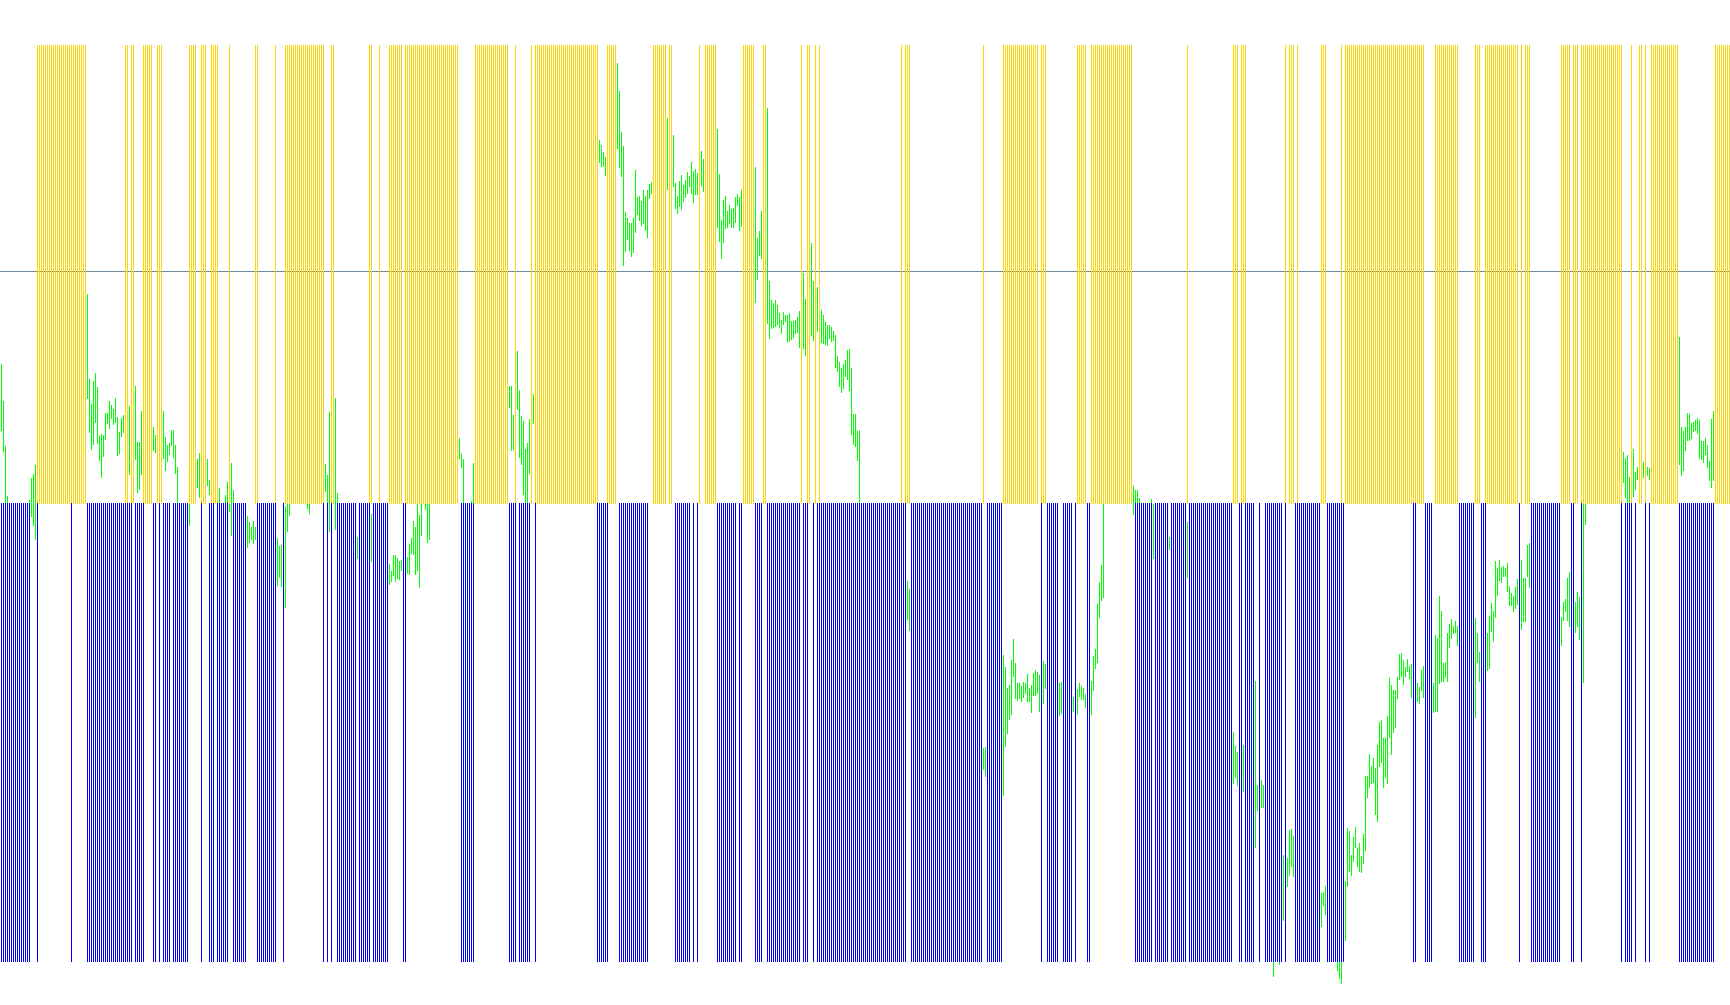
This indicator identifies bullish and bearish structural shifts by detecting engulfing high/low price action relative to a higher timeframe's previous candle boundaries.

InnOutBar_mtf_v1
Indicator

InnOutBar_mtf_v1

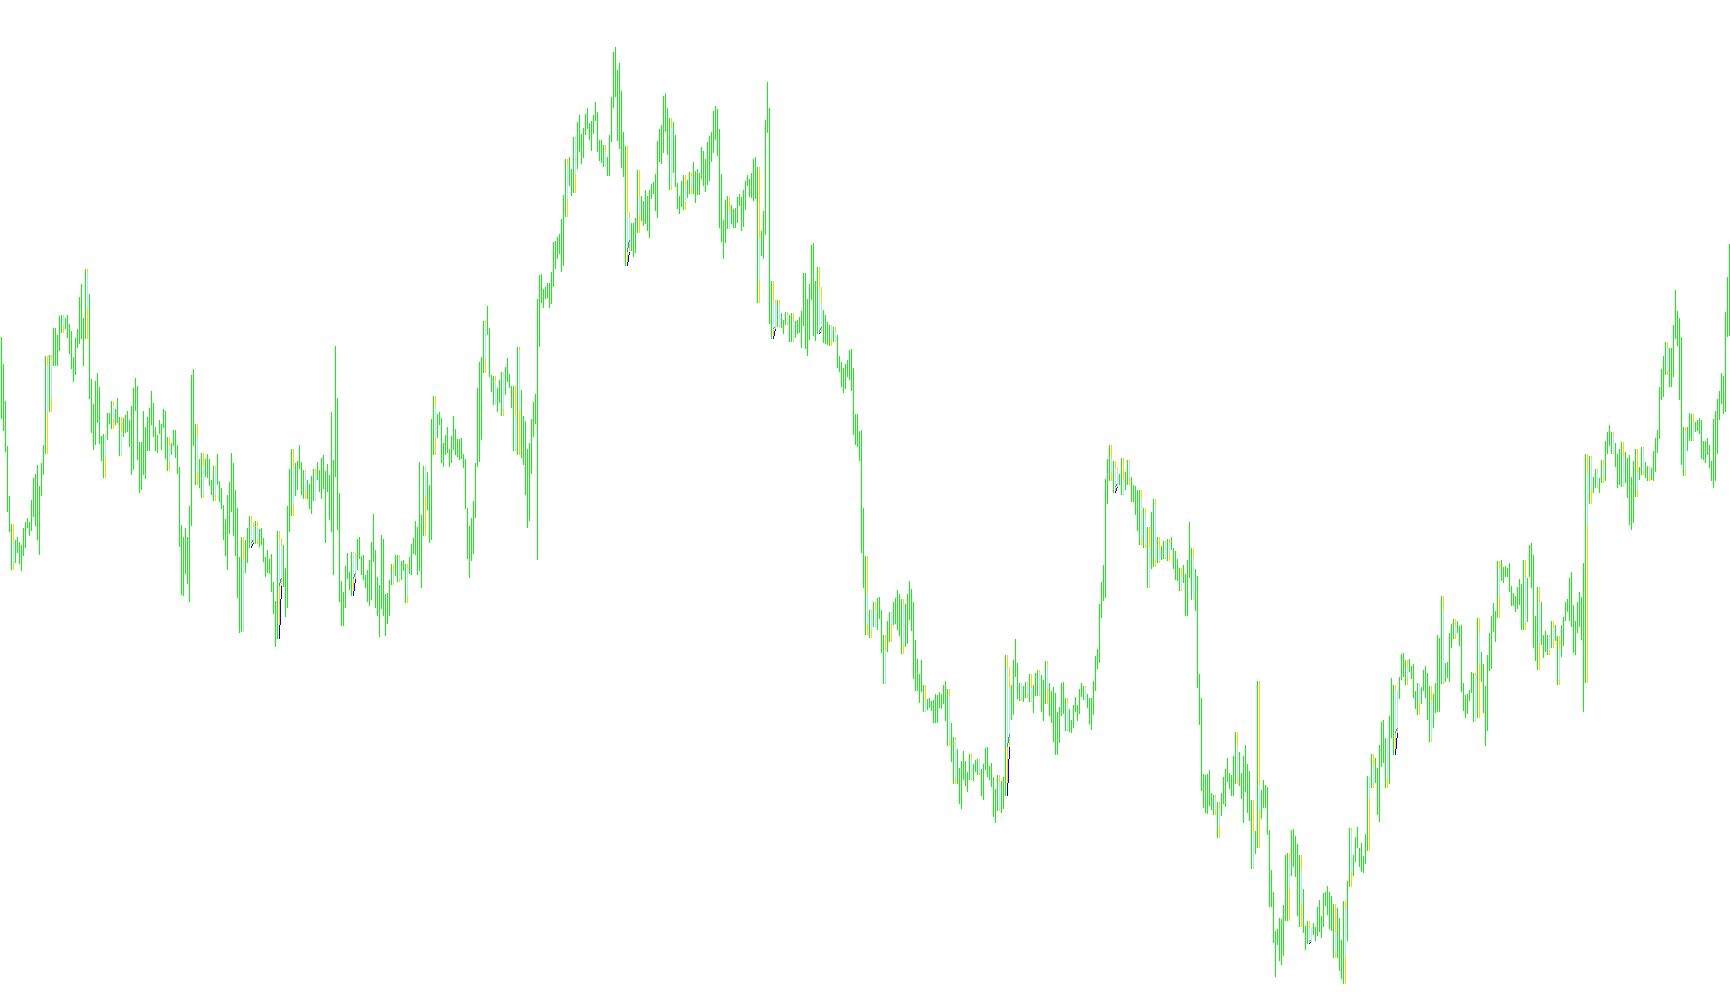
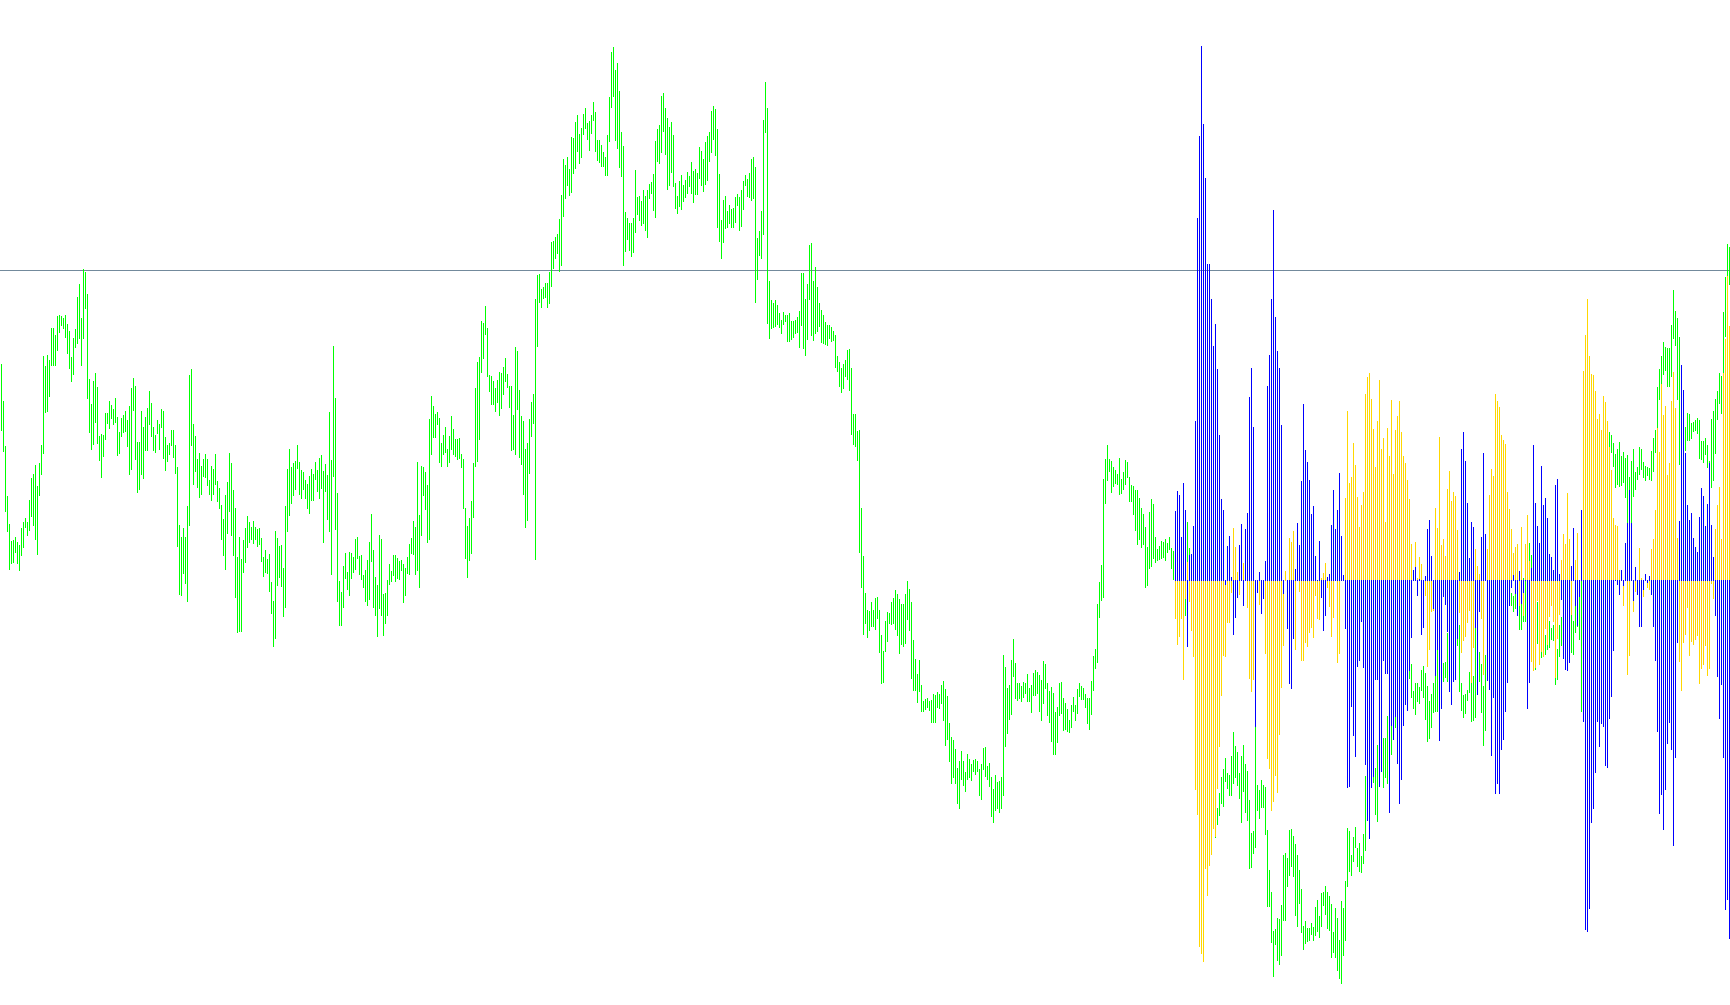
This indicator identifies specific price action reversals by detecting candles that engulf the previous period's high and low extremes across a user-defined higher timeframe.

inout
Indicator

inout

This indicator identifies structural price breakouts by detecting instances where the current candle's high and low range completely encapsulates the preceding candle's extremes.

InsideBar
Indicator

InsideBar

Identifies price action moments where the current candle's range is nested within the preceding bar's boundaries and exhibits the lowest relative body size over a five-period window.

InsideBar_histo_mtf
Indicator

InsideBar_histo_mtf

This indicator identifies multi-timeframe price action where a current candle's high and low are strictly contained within the previous candle's range.

InsideBar_v1
Indicator

InsideBar_v1

This indicator identifies price action consolidation by highlighting bars whose range is contained within the previous candle's boundaries or exhibit minimal body size relative to a five-period historical average.

Instant Trendline Filter
Indicator

Instant Trendline Filter

This indicator utilizes a weighted recursive polynomial calculation on median or typical price points to project instantaneous momentum and directional velocity.

Instant TrendLine
Indicator

Instant TrendLine

This algorithm utilizes Hilbert Transform principles to calculate instantaneous phase and dominant cycle periods, generating a dynamic trendline based on real-time periodicity shifts.

Instant TrendLine_v1
Indicator

Instant TrendLine_v1

This indicator employs Hilbert Transform phase analysis to dynamically calculate the market's dominant cycle period and extract a smoothed trendline based on that instantaneous frequency.

Instant TrendLine_v2
Indicator

Instant TrendLine_v2

This indicator utilizes Hilbert Transform components to calculate a dynamic cycle period, subsequently generating an adaptive trendline based on the moving average of that instantaneous frequency.

Instantaneous Trend
Indicator

Instantaneous Trend

This indicator calculates a dynamic trendline by identifying the instantaneous dominant cycle period through Hilbert Transform phase analysis and applying a rolling average over that specific measurement.

Instantaneous Trend_001
Indicator

Instantaneous Trend_001

This indicator calculates an instantaneous dominant cycle period using phase-shift trigonometry to derive a moving average trendline adjusted for real-time volatility.

Instantaneous Trend_v1
Indicator

Instantaneous Trend_v1

This indicator identifies dominant market cycles using quadrature components and arc tangent phase shifts to calculate a dynamic trendline based on the instantaneous period.

InstantaneousTrendline
Indicator

InstantaneousTrendline

Utilizes a recursive digital filter to smooth price midpoint data into a continuous trendline while deriving a momentum-based trigger from the acceleration of that curve.

InstantaneousTrendline_alert
Indicator

InstantaneousTrendline_alert

This indicator utilizes a recursive filter to model price action dynamics, identifying momentum shifts by detecting intersections between an instantaneous trendline and its calculated trigger velocity.

InstantTrendLine
Indicator

InstantTrendLine

This indicator identifies market direction by calculating a smoothed trendline based on the real-time detection of the dominant price cycle period using phase differentiation.

InstantTrendLine_v1
Indicator

InstantTrendLine_v1

This indicator dynamically computes a trendline by calculating the instantaneous dominant cycle period through phase differential analysis and arc tangent transformations.

Instant_Trendline_Filter
Indicator

Instant_Trendline_Filter

This indicator utilizes a recursive weighted calculation of median or typical prices to project instantaneous directional velocity and filter structural trends.

InsTrend
Indicator

InsTrend

This indicator calculates the instantaneous dominant cycle period using phase differential analysis to generate a trendline based on a rolling average of the detected periodicity.

InstTrendLine_v1
Indicator

InstTrendLine_v1

iATRiMA

An advanced trend identification system utilizing a multi-stage signal processing pipeline involving complex smoothing, Hilbert transform-based cycle detection, and notch filters to isolate dominant market movements from noise.

Intensivnost_Tikov
Indicator

Intensivnost_Tikov

This indicator quantifies the frequency of price fluctuations by tracking the cumulative tick count elapsed during each individual candle's formation.

InterestLines
Indicator

InterestLines

This indicator parses external CSV datasets to project chronological economic events onto the chart as vertical demarcations with descriptive metadata.

Internal bar strength
Indicator

Internal bar strength

iMAOnArray

This indicator quantifies price action intensity by calculating the percentage position of the closing price relative to the high-low range and applying a smoothed moving average.

Interpolation
Indicator

Interpolation

This indicator estimates future price trajectories by calculating a Lagrange polynomial fit over a specific range of historical closing prices.

InvChanel
Indicator

InvChanel

This indicator calculates the ratio between two different currency pairs to generate a regression-based pricing channel that visualizes relative strength and equilibrium deviations.

Inverse fisher transform of RSI
Indicator

Inverse fisher transform of RSI

iMAOnArrayiRSI

This indicator applies an exponential hyperbolic tangent transformation to a smoothed Relative Strength Index to normalize price momentum into a bounded range for clearer trend reversal detection.

Inverse Fisher Transform of RSIm
Indicator

Inverse Fisher Transform of RSIm

iRSI

This indicator normalizes RSI values into a bounded range using a weighted moving average and applies the Inverse Fisher Transform to highlight momentum extremes.

Inverse Fisher Transform of RSI_001
Indicator

Inverse Fisher Transform of RSI_001

iRSI

This indicator calculates a smoothed Relative Strength Index and applies an Inverse Fisher Transform to map momentum oscillations into a normalized range for precise reversal identification.

Inverse fisher transform of Stochastic
Indicator

Inverse fisher transform of Stochastic

iMAOnArrayiStochastic

This indicator applies a hyperbolic tangent transformation to a smoothed stochastic mean to normalize momentum into a bounded range for precise trend reversal detection.

Inverse Fisher
Indicator

Inverse Fisher

iMAOnArrayiRSI

This indicator transforms normalized RSI data into a bounded momentum oscillator by applying a linear weighted moving average followed by a hyperbolic tangent function.

Inverse_Fisher_Transform_of_RSI
Indicator

Inverse_Fisher_Transform_of_RSI

iRSI

This indicator applies an Inverse Fisher Transform to a weighted smoothed Relative Strength Index to normalize momentum into a distinct range for identifying trend exhaustion.

inverse_fisher_transform_of_Stochastic_
Indicator

inverse_fisher_transform_of_Stochastic_

iMAOnArrayiStochastic

This indicator applies an exponential hyperbolic tangent transformation to a smoothed stochastic oscillator to normalize price momentum into a distinct visual histogram.

Indicator

InvestMiner

iStochTxt
Indicator

iStochTxt

iATRiStochastic

This indicator identifies momentum shifts by detecting Stochastic main line crossovers relative to a user-defined volatility-adjusted threshold while overlaying price and timestamp labels.

Itend old
Indicator

Itend old

iBearsPoweriBandsiBullsPower

This indicator quantifies market sentiment by comparing current price action against Bollinger Band extremes and contrasting Bull/Bear power dynamics to generate a visual histogram of trend dominance.

Itend old_v1
Indicator

Itend old_v1

iBearsPoweriBandsiBullsPower

This indicator synchronizes Bollinger Band breaches with directional power calculations to visualize market sentiment via a dual-color histogram.

Indicator

iTest

Itrend Old
Indicator

Itrend Old

iBearsPoweriBandsiBullsPower

This indicator synthesizes Bollinger Band proximity logic with Bull/Bear power metrics to visualize binary trend polarity through dual-histogram signal mapping.

Itrend Old_v1
Indicator

Itrend Old_v1

iBearsPoweriBandsiBullsPower

This indicator synthesizes Bollinger Band breaches and dual power oscillators to visualize market sentiment through binary histogram signals.

Itrend Old_v2
Indicator

Itrend Old_v2

iBearsPoweriBandsiBullsPower

This indicator quantifies market direction by measuring the price variance relative to Bollinger Bands and contrasting it with the aggregate momentum of bullish and bearish power flows.

iTrend
Indicator

iTrend

iBearsPoweriBandsiBullsPower

This indicator calculates the distance between price and Bollinger Bands while simultaneously measuring negative aggregate bullish and bearish power to identify trend exhaustion.

iTrend1
Indicator

iTrend1

iBearsPoweriBandsiBullsPower

This indicator maps market sentiment by correlating the distance of current price from Bollinger Bands against a normalized sum of bullish and bearish power fluctuations.

iTrend1_v1
Indicator

iTrend1_v1

iBearsPoweriBandsiBullsPower

This indicator visualizes market sentiment by cross-referencing Bollinger Band deviations with the cumulative sum of Bull and Bear power oscillators to generate binary trend signals.

iTREND_alexcud(2)
Indicator

iTREND_alexcud(2)

iACiMA

This indicator identifies trend reversals by synchronizing moving average gradients and Awesome Oscillator momentum shifts across three distinct timeframes.

iTrend_hist
Indicator

iTrend_hist

iBearsPoweriBandsiBullsPower

This indicator identifies trend direction by comparing price position relative to Bollinger Band envelopes against an aggregated Bull and Bear power momentum sum.

iTrend_v1
Indicator

iTrend_v1

iBearsPoweriBandsiBullsPower

This indicator visualizes market sentiment by mapping price deviation relative to Bollinger Bands against a composite bullish and bearish power momentum sum.

iTrend_v2
Indicator

iTrend_v2

iBearsPoweriBandsiBullsPower

This indicator quantifies market sentiment by comparing price proximity to Bollinger Band envelopes against the aggregate polarity of bullish and bearish power dynamics.

iTrend_v3
Indicator

iTrend_v3

iBearsPoweriBandsiBullsPower