inverse_fisher_transform_of_Stochastic_
Download script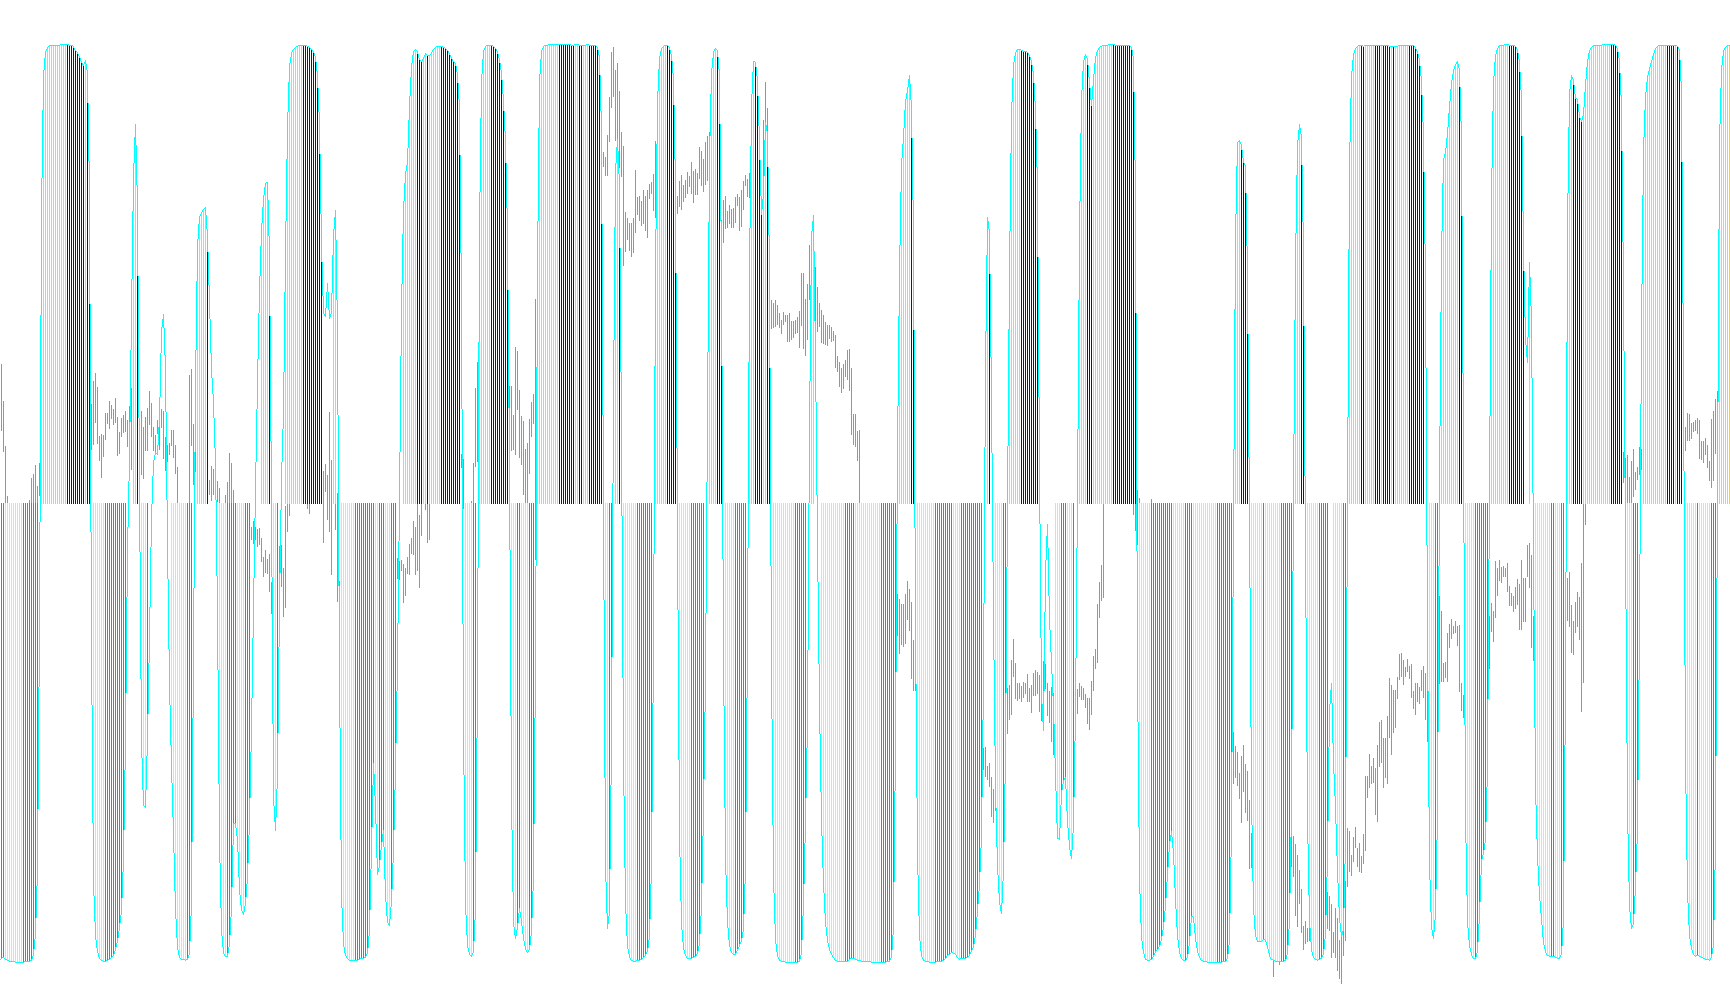
This indicator combines several advanced mathematical techniques to provide a smoother, more refined view of market momentum compared to standard oscillators. It is designed to help traders identify trends and potential reversals by filtering out "market noise."
Core Logic Overview
1. Foundation: The Stochastic Base The logic begins by pulling data from a standard Stochastic Oscillator. However, instead of using the raw output, the script immediately adjusts this value into a normalized range centered around zero. This shift is crucial because it prepares the data for the subsequent mathematical transformations.
2. Smoothing and Trend Filtering To prevent the indicator from reacting too aggressively to minor price flickers, the script applies a Moving Average to the adjusted Stochastic values. This acts as a stabilizer, ensuring that the signals represent broader momentum rather than instantaneous volatility.
3. The Inverse Fisher Transformation The standout feature of this logic is the application of an "Inverse Fisher" calculation. In plain terms, this mathematical formula takes the smoothed data and compresses it into a specific range (typically between -1 and 1). This makes the indicator much more sensitive to trend changes while simultaneously keeping the visual movement fluid. It helps highlight when momentum is accelerating or decelerating in a way that is easier for the human eye to track.
4. Dynamic Visual Feedback The script translates these calculations into a visual histogram on your chart:
- Directional Coloring: The indicator intelligently detects whether the momentum is rising or falling. It assigns different colors (Red and Green) based on whether the current value is higher or lower than the previous one, allowing you to see the "flow" of the market at a glance.
- Visual Filtering: You can choose to show specific levels. The script includes logic to focus on key zones, helping traders ignore insignificant price action and concentrate on significant momentum shifts.
- Zone Mapping: The indicator automatically draws background "zones" or bounds. These serve as visual anchors, helping you identify overextended markets or areas where the trend is reaching a limit.
Summary for the User
Rather than just showing you where the price is currently moving, this tool analyzes the intensity of that movement. It takes raw market data, smooths it out to remove distractions, applies a unique mathematical compression to highlight momentum shifts, and then paints those results onto your screen as a color-coded map of market energy.
//+------------------------------------------------------------------+
//|                       Inverse fisher transform of Stochastic.mq4 |
//|                                                           mladen |
//+------------------------------------------------------------------+
#property  copyright "mladen"
#property  link      ""

#property  indicator_separate_window
#property  indicator_buffers 5
#property  indicator_color1  Green
#property  indicator_color2  Green
#property  indicator_color3  Red
#property  indicator_color4  Red
#property  indicator_color5  C'54,71,73' //DimGray
#property  indicator_width1  2
#property  indicator_width3  2
#property  indicator_width5  2

//
//
//
//
//

extern int    StochKPeriod  =  14;
extern int    StochSlowing  =  3;
extern int    StochPrice    =  0;
extern int    MAPeriod      =  9;
extern int    MAMode        =  MODE_LWMA;
extern bool   ShowHistogram =  true;
extern bool   ShowLevels    =  true;
extern double Level1        =  0.5;
extern double Level2        =  0.0;
extern double Level3        = -0.5;
extern color  ZoneColor     = C'21,24,24';      //C'30,33,36';

//
//
//
//
//

double   buffer1[];
double   buffer2[];
double   buffer3[];
double   buffer4[];
double   buffer5[];
double   buffer6[];
double   buffer7[];

//
//
//
//
//

string ShortName;

//+------------------------------------------------------------------+
//|                                                                  |
//+------------------------------------------------------------------+
//
//
//
//
//

int init()
{
   IndicatorBuffers(7);
   SetIndexBuffer(0,buffer1);
   SetIndexBuffer(1,buffer2);
   SetIndexBuffer(2,buffer3);
   SetIndexBuffer(3,buffer4);
   SetIndexBuffer(4,buffer5);
   SetIndexBuffer(5,buffer6);
   SetIndexBuffer(6,buffer7);
      SetIndexStyle(0,DRAW_HISTOGRAM);
      SetIndexStyle(1,DRAW_HISTOGRAM);
      SetIndexStyle(2,DRAW_HISTOGRAM);
      SetIndexStyle(3,DRAW_HISTOGRAM);

   //
   //
   //
   //
   //

   ShortName=MakeUniqueName("Inverse Fisher Stochastic "," ("+StochKPeriod+","+StochSlowing+","+MAPeriod+")");
   IndicatorShortName(ShortName);
   return(0);
}
int deinit()
{
   DeleteBounds();
   return(0);
}

//+------------------------------------------------------------------+
//|                                                                  |
//+------------------------------------------------------------------+
//
//
//
//
//

int start()
{
   int    limit, i;
   int    counted_bars=IndicatorCounted();

   if(counted_bars<0) return(-1);
   if(counted_bars>0) counted_bars--;
           limit=Bars-counted_bars;

   //
   //
   //
   //
   //

   for(i=limit; i>=0; i--) buffer7[i] = 0.1*(iStochastic(NULL,0,StochKPeriod,1,StochSlowing,MODE_SMA,StochPrice,MODE_MAIN,i)-50);
   for(i=limit; i>=0; i--)
   {
      buffer6[i] = iMAOnArray(buffer7,0,MAPeriod,0,MAMode,i);
      buffer5[i] = (MathExp(2*buffer6[i])-1)/(MathExp(2*buffer6[i])+1);

      //
      //
      //
      //
      //

      if(ShowHistogram)
      {
         if(buffer5[i]==buffer5[i+1])
         {
            buffer1[i]=buffer1[i+1];
            buffer2[i]=buffer2[i+1];
            buffer3[i]=buffer3[i+1];
            buffer4[i]=buffer4[i+1];
               continue;
         }

         //
         //
         //
         //
         //

            buffer1[i]=EMPTY_VALUE;
            buffer2[i]=EMPTY_VALUE;
            buffer3[i]=EMPTY_VALUE;
            buffer4[i]=EMPTY_VALUE;
            if(ShowLevels)
               if((buffer5[i]<Level1) && (buffer5[i]>Level3))
                  continue;

            //
            //
            //
            //
            //

            if(buffer5[i]<0)
            {
               if (buffer5[i]<buffer5[i+1]) buffer3[i]=buffer5[i];
               if (buffer5[i]>buffer5[i+1]) buffer4[i]=buffer5[i];
            }
            if(buffer5[i]>0)
            {
               if (buffer5[i]<buffer5[i+1]) buffer2[i]=buffer5[i];
               if (buffer5[i]>buffer5[i+1]) buffer1[i]=buffer5[i];
            }
      }
   }

   //
   //
   //
   //
   //

   if (ShowLevels) UpdateBounds();
   return(0);
}

//+------------------------------------------------------------------+
//|                                                                  |
//+------------------------------------------------------------------+
//
//
//
//
//

string MakeUniqueName(string first, string rest)
{
   string result = first+(MathRand()%1001)+rest;

   while (WindowFind(result)> 0)
          result = first+(MathRand()%1001)+rest;
   return(result);
}


//+------------------------------------------------------------------+
//|                                                                  |
//+------------------------------------------------------------------+
//
//
//
//
//

void DeleteBounds()
{
   ObjectDelete(ShortName+"-1");
   ObjectDelete(ShortName+"-2");
   ObjectDelete(ShortName+"-3");
}
void UpdateBounds()
{
   SetUpBound(ShortName+"-1",1          ,Level1);
   SetUpBound(ShortName+"-2",Level2+0.02,Level2-0.02);
   SetUpBound(ShortName+"-3",Level3     ,      -1.00);
}
void SetUpBound(string name, double up, double down)
{
   if (ObjectFind(name) == -1)
      {
         ObjectCreate(name,OBJ_RECTANGLE,WindowFind(ShortName),0,0);
         ObjectSet(name,OBJPROP_PRICE1,up);
         ObjectSet(name,OBJPROP_PRICE2,down);
         ObjectSet(name,OBJPROP_COLOR,ZoneColor);
         ObjectSet(name,OBJPROP_BACK,true);
         ObjectSet(name,OBJPROP_TIME1,iTime(NULL,0,Bars-1));
      }
   if (ObjectGet(name,OBJPROP_TIME2) != iTime(NULL,0,0))
       ObjectSet(name,OBJPROP_TIME2,    iTime(NULL,0,0));
}
Comments