iTrend1
Download script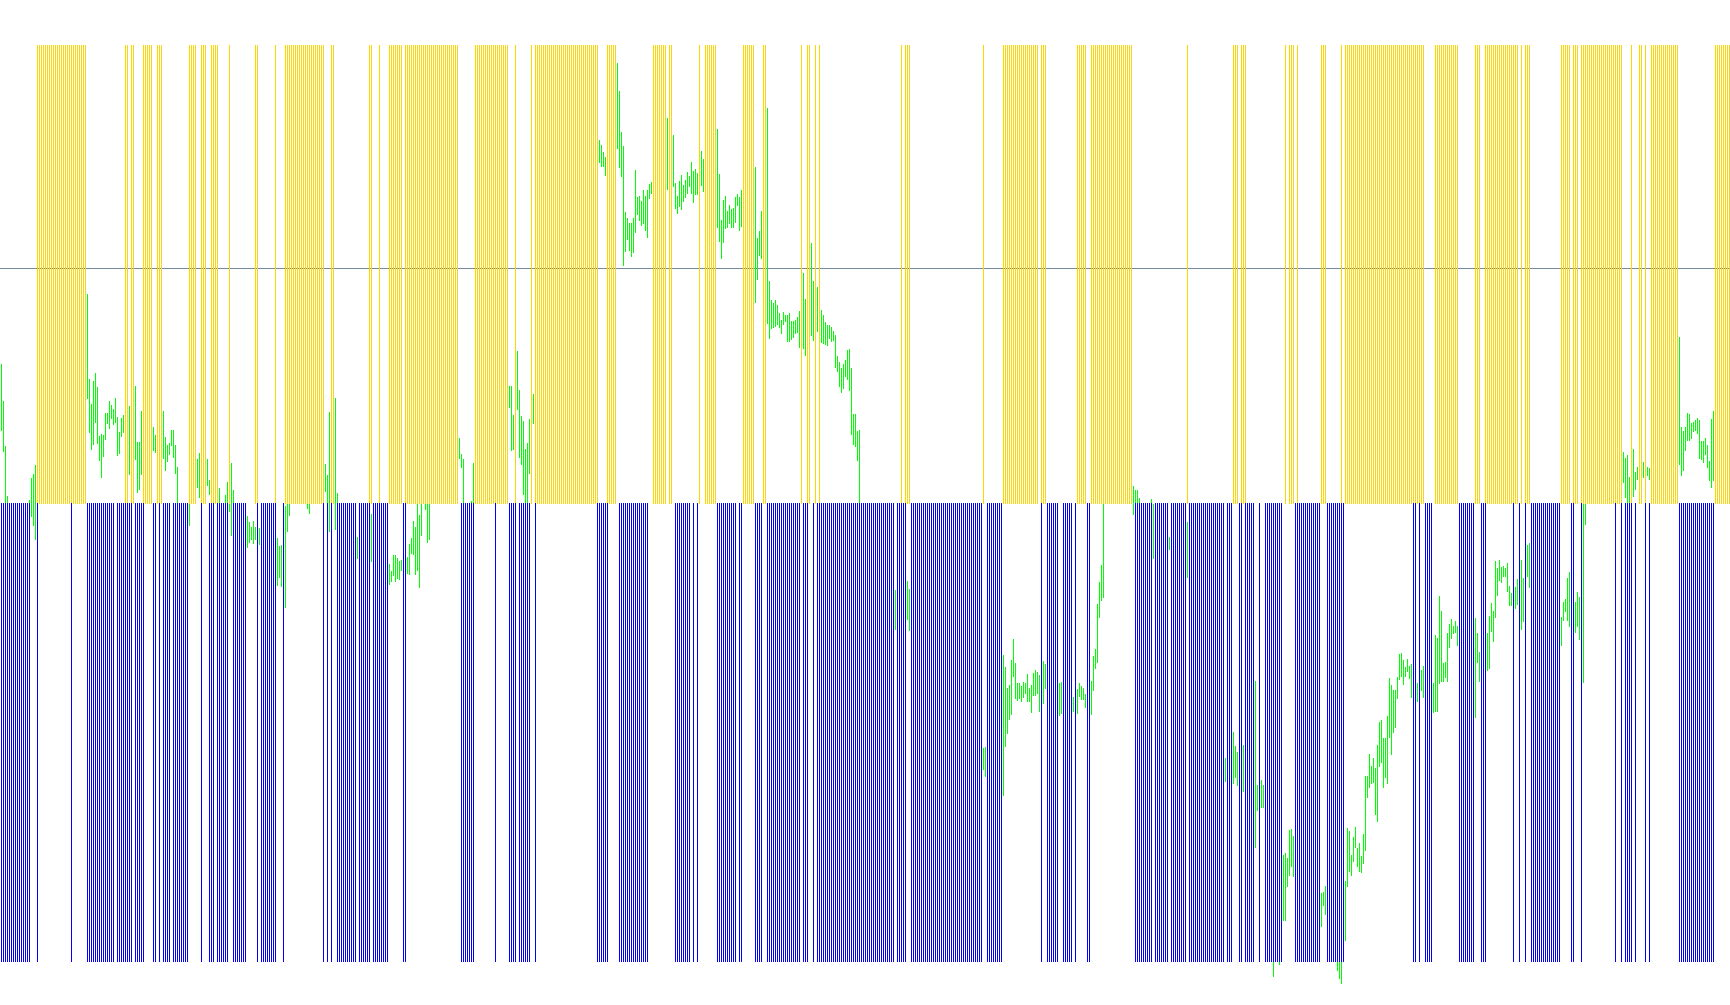
Overview
The iTrend indicator is a visual trading tool designed to help traders identify market trends by analyzing price movement and momentum. It operates in a separate window below the main price chart, providing a simplified "histogram" view that translates complex market data into clear signals.
Core Logic and Functionality
The indicator works by processing two distinct types of market data simultaneously:
1. Trend Positioning (Blue Histogram) The tool first looks at the relationship between the current market price and a "Bollinger Band" calculation. By measuring how far the price sits relative to these bands, the script determines the general direction of the trend.
- If the price is positioned above the calculated threshold, it registers a positive value (represented as a Blue bar).
- If the price is below that threshold, it remains neutral or negative.
2. Momentum Analysis (Red Histogram) Simultaneously, the indicator calculates "Power" by looking at both bullish and bearish momentum independently over a specific timeframe. It combines these forces to see who is currently in control of the market's movement.
- The script captures the net force of this momentum and reflects it as a Red bar.
- This provides a secondary layer of confirmation, showing whether the current price action has enough "strength" behind it to sustain the trend.
How it Works Together
The indicator essentially filters out market noise by converting these complex calculations into a binary visual format:
- Trend Detection: It determines if the price is structurally moving up or down based on standard deviations.
- Momentum Confirmation: It validates that movement by checking the underlying strength of buyers and sellers.
By presenting this information as a dual-colored histogram, the tool allows traders to see at a glance whether the current market trend is supported by strong momentum, helping to identify potential trend continuations or shifts in sentiment.
Customization Options
The script is designed with high flexibility, allowing users to fine-tune the logic based on their specific trading style:
- Price Source: Users can choose which price data points to use (e.g., Close, Open, High, Low, or Median prices) for both the trend and momentum calculations.
- Sensitivity Periods: You can adjust the "Lookback" periods to make the indicator react faster to quick price changes or slower to filter out minor fluctuations.
- Deviation Levels: Users can modify the standard deviation of the bands to tighten or loosen the criteria for what constitutes a "trend."
//+------------------------------------------------------------------+
//|                                                  iTrend_hist.mq4 |
//|                                                                  |
//|                                                                  |
//+------------------------------------------------------------------+
#property copyright "tonyc2a@yahoo.com"
#property link      ""
#property indicator_separate_window
#property indicator_buffers 2
#property indicator_color1 Blue
#property indicator_color2 Red
#property indicator_minimum -1
#property indicator_maximum 1


//---- input parameters
extern double iBandsDeviation=2;
extern int iBandsMode0_2=0;     // 0-2: MODE_MAIN, MODE_LOW, MODE_HIGH
extern int iBandsPrice0_6=0;    // 0-6: PRICE_CLOSE,PRICE_OPEN,PRICE_HIGH,PRICE_LOW,PRICE_MEDIAN,PRICE_TYPICAL,PRICE_WEIGHTED
extern int iBandsPeriod=20;     // 20
extern int iPowerPrice0_6=0;    // 0-6: PRICE_CLOSE,PRICE_OPEN,PRICE_HIGH,PRICE_LOW,PRICE_MEDIAN,PRICE_TYPICAL,PRICE_WEIGHTED
extern int iPowerPeriod=13;     // 13
extern int iPriceType0_3=0;     // 0-3: PRICE_CLOSE,PRICE_OPEN,PRICE_HIGH,PRICE_LOW

//---- buffers
double ExtMapBuffer1[];
double ExtMapBuffer2[];

//+------------------------------------------------------------------+
//| Custom indicator initialization function                         |
//+------------------------------------------------------------------+
int init()
  {
//---- indicators
   IndicatorBuffers(2);
   SetIndexStyle(0,DRAW_HISTOGRAM);
   SetIndexBuffer(0,ExtMapBuffer1);
   SetIndexLabel(0,"Blue");
   SetIndexStyle(1,DRAW_HISTOGRAM);
   SetIndexBuffer(1,ExtMapBuffer2);
   SetIndexLabel(1,"Red");
//----
   IndicatorShortName("iTrend");
//----
   return(0);
  }
//+------------------------------------------------------------------+
//| Custor indicator deinitialization function                       |
//+------------------------------------------------------------------+
int deinit()
  {
//---- TODO: add your code here
//----
   return(0);
  }
//+------------------------------------------------------------------+
//| Custom indicator iteration function                              |
//+------------------------------------------------------------------+
int start()
  {
   int    counted_bars=IndicatorCounted();
//---- TODO: add your code here

   //+----Processes user parameters-------------------------------------+
   double BandsMode,BandsPrice,PowerPrice;

   switch(iBandsMode0_2){
      case 1: BandsMode=MODE_LOWER;
      case 2: BandsMode=MODE_UPPER;
      default: BandsMode=MODE_MAIN;
      } //end switch

   switch(iBandsPrice0_6){
      case 1: BandsPrice=PRICE_OPEN;
      case 2: BandsPrice=PRICE_HIGH;
      case 3: BandsPrice=PRICE_LOW;
      case 4: BandsPrice=PRICE_MEDIAN;
      case 5: BandsPrice=PRICE_TYPICAL;
      case 6: BandsPrice=PRICE_WEIGHTED;
      default: BandsPrice=PRICE_CLOSE;
      } //end switch

   switch(iPowerPrice0_6){
      case 1: PowerPrice=PRICE_OPEN;
      case 2: PowerPrice=PRICE_HIGH;
      case 3: PowerPrice=PRICE_LOW;
      case 4: PowerPrice=PRICE_MEDIAN;
      case 5: PowerPrice=PRICE_TYPICAL;
      case 6: PowerPrice=PRICE_WEIGHTED;
      default: PowerPrice=PRICE_CLOSE;
      } //end switch
   //+------------------------------------------------------------------+

   //+----Main Section--------------------------------------------------+
   double CurrentPrice, value1, value2, x, y;

   for(int i=0;i<=Bars;i++){
      switch(iPriceType0_3){
         case 1: CurrentPrice=Open[i];
         case 2: CurrentPrice=High[i];
         case 3: CurrentPrice=Low[i];
         default: CurrentPrice=Close[i];
         } //end switch

      x=CurrentPrice-iBands(Symbol(),Period(),iBandsPeriod,iBandsDeviation,0,BandsPrice,BandsMode,i);
      y=-(iBullsPower(Symbol(),Period(),iPowerPeriod,PowerPrice,i) + iBearsPower(Symbol(),Period(),iPowerPeriod,PowerPrice,i));

      if(x<0) value1=0;
      if(x>0) value1=1;
      if(y<0) value2=0;
      if(y>0) value2=-1;

      ExtMapBuffer1[i]=value1;
      ExtMapBuffer2[i]=value2;
      } //end for
   //+------------------------------------------------------------------+

   //ObjectCreate("vl",OBJ_VLINE,WindowFind("iTrend"),Time[-1],Close[0]);

//----
   return(0);
  }
//+------------------------------------------------------------------+
Comments