Inverse_Fisher_Transform_of_RSI
Download script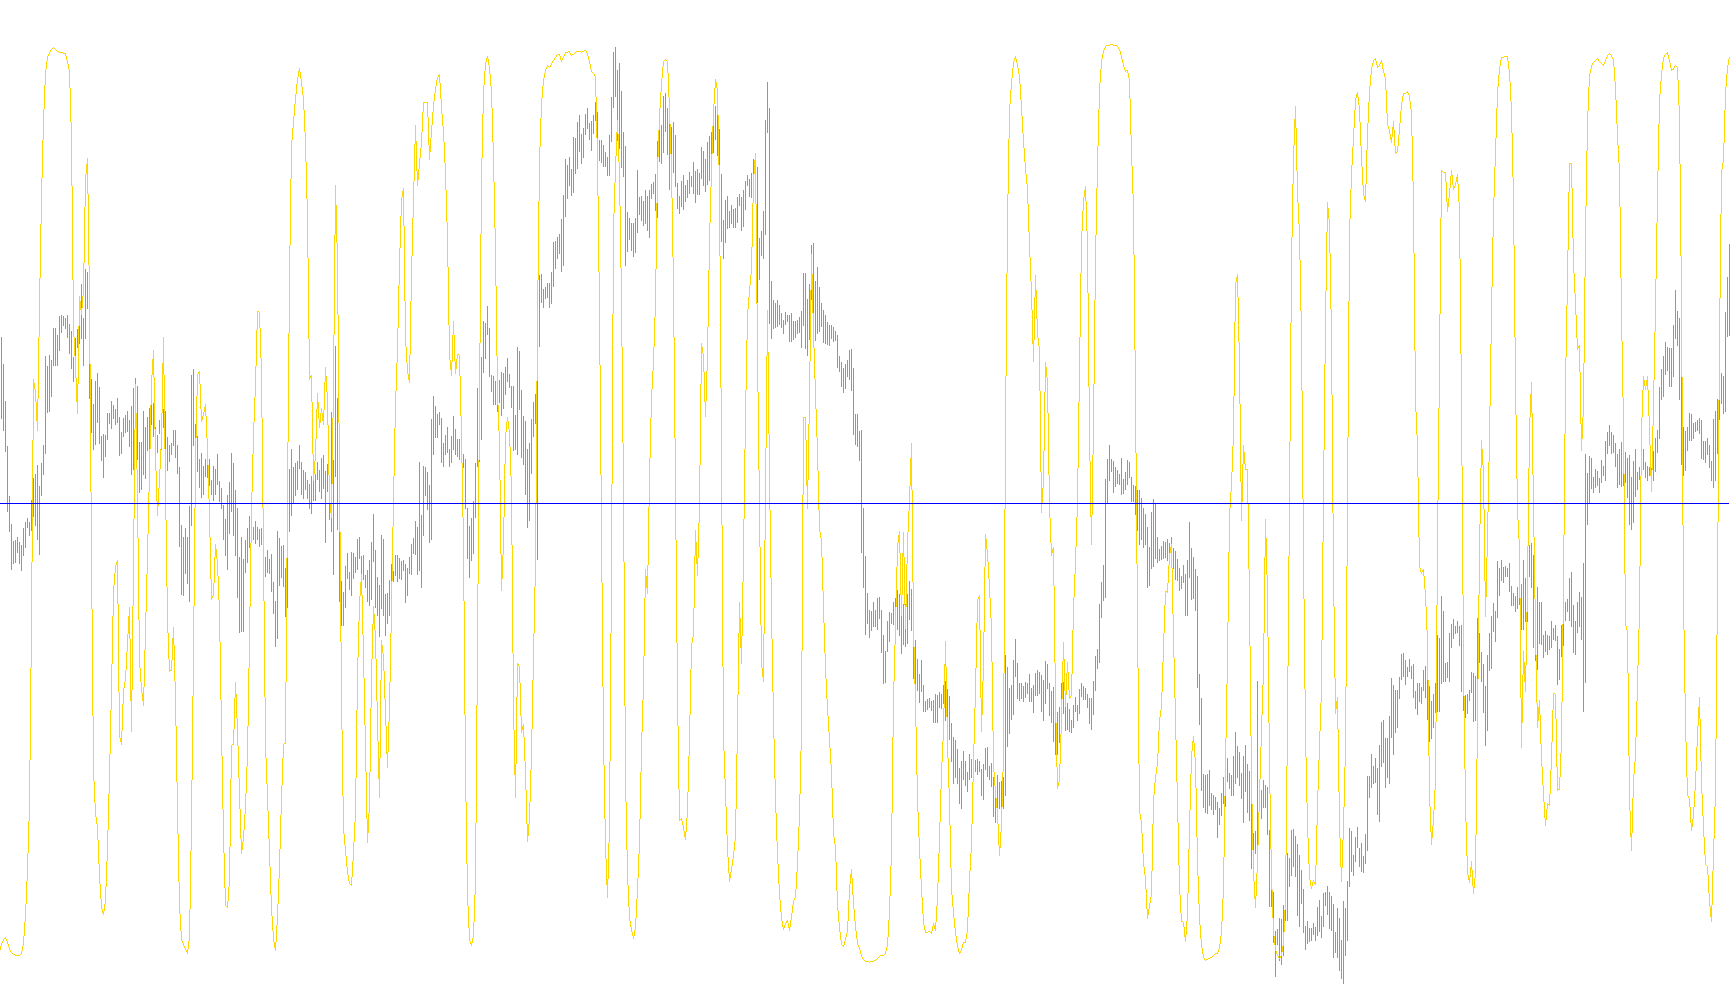
This script functions as a custom technical analysis indicator designed to provide traders with a smoothed, non-linear perspective on market momentum. Rather than using standard price indicators directly, it applies a multi-layered mathematical conversion to the Relative Strength Index (RSI) to help identify potential trend reversals and extremes more clearly.
Core Methodology
The logic follows a sophisticated three-step processing pipeline:
1. RSI Calculation & Normalization The script begins by calculating the standard Relative Strength Index (RSI). This measures the speed and change of price movements. However, instead of displaying the standard RSI value (which usually oscillates between 0 and 100), the script re-scales the data. It shifts the center point to zero and shrinks the scale, preparing the raw momentum data for further transformation.
2. Smoothing via Weighted Moving Average (WMA) To remove "noise" and minor market fluctuations that can lead to false signals, the script passes the scaled RSI data through a Weighted Moving Average. Unlike a simple average, a weighted average gives more importance to recent price action while still maintaining a smooth curve. This ensures that the resulting line represents a steady trend rather than erratic jumps.
3. The Inverse Fisher Transform The final and most significant step is the application of the Inverse Fisher Transform. This mathematical formula is specifically used to convert unbounded data into a bounded range (specifically between -1 and 1). In practical trading terms, this transformation "amplifies" the curves when they approach significant levels, making it easier for a trader to visualize when momentum is reaching an extreme point or beginning to pivot.
Visual Outputs and Triggers
The indicator produces two distinct visual elements on the chart:
- The Momentum Curve: This is the primary line derived from the Inverse Fisher Transform of the RSI. It provides the "flow" of market strength.
- Dynamic Trigger Lines: The script automatically plots a dual-value trigger system based on your settings. These lines act as visual boundaries; when the momentum curve crosses above or below these specific thresholds, it signals potential entry or exit points (e.g., identifying overbought or oversold conditions) based on whether the trend is moving toward the upper or lower limits.
Summary for the User
Essentially, this tool takes standard momentum data, cleans out the "jitter" using weighted averages, and then uses a specialized transform to make it much easier to spot when the market is overextended. It simplifies complex price action into a clear visual signal that highlights where the strongest moves are likely to exhaust.
//+------------------------------------------------------------------+
//|                              Inverse Fisher Transform of RSI.mq4 |
//|                                             Treberk's Conversion |
//|                                             Treberk's Conversion |
//+------------------------------------------------------------------+
#property copyright "Treberk's Conversion"
#property link      "Treberk's Conversion"

#property indicator_separate_window
#property indicator_buffers 2
#property indicator_color1 Red
#property indicator_color2 DimGray


//Inputs
 extern int  HiTrigger=0.5; // default=0.5
 extern int  LoTrigger=-0.5; // default=-0.5
 extern int  RsiBars=5; // default=5
 extern int  WmaBars=9; // default=9
 extern bool  info=0; // default=0


//---- buffers
double ExtMapBuffer1[];
double ExtMapBuffer2[];
//+------------------------------------------------------------------+
//| Custom indicator initialization function                         |
//+------------------------------------------------------------------+
int init()
  {
//---- indicators
   SetIndexStyle(0,DRAW_LINE);
   SetIndexBuffer(0,ExtMapBuffer1);
   SetIndexStyle(1,DRAW_LINE);
   SetIndexBuffer(1,ExtMapBuffer2);
//----
   return(0);
  }
//+------------------------------------------------------------------+
//| Custor indicator deinitialization function                       |
//+------------------------------------------------------------------+
int deinit()
  {
//----

//----
   return(0);
  }
//+------------------------------------------------------------------+
//| Custom indicator iteration function                              |
//+------------------------------------------------------------------+
int start()
  {
   int    counted_bars=IndicatorCounted();
//----

    // SetLoopCount(0);
//--------------------------------------------------------

//Variables: // Generic
int  shift;
int  loopBegin;
bool is_First=True;
double   prevbars;
int   count;

//Variables: // Specific
//   Name(\"InvFisher RSI\"),
double   Value2;
double    IFish;
   // for manual calc. RSI
double    SumUp;
double    SumDn;
double    AvgUp;
double    AvgDn;
double   Delta;
double   RSI;
   // for calc. WMA
double   WmaNumerator;
double   WmaDenominator;
datetime LastTime;
double   PrevAvgUp;
double   PrevAvgDn;
int      cntdown;

//Arrays:
   // for ( calc. generic WMA (weighted moving average)
   double Value1[40];


// Usage
/*[if (info ) {
   Alert(\"See Terminal>Journal Tab for ( usage of \\n\",Name);
   Print(\"|___________________\");
   Print(\"|* \",Name,\" *\");
   Print(\"|  \",\"Sell: cross under HiTrigger (or under LoTrigger if (no prior cross under  HiTrigger)\");
   Print(\"|  \",\"Buy: cross over LoTrigger (or over HiTrigger if (no prior cross over LoTrigger)\");
   Print(\"|* \",Name,\" *\");
   Print(\"|```````````````````\");
   }]*/
//--------------------------------------------------------

// Check Inputs
if (0>HiTrigger || HiTrigger>1 ) {
   Alert("Input Error:  must be 0< HiTrigger <1, Cannot=",HiTrigger);
   return(0);
}
if (-1>LoTrigger || LoTrigger>0 ) {
   Alert("Input Error:  must be -1< LoTrigger <0, Cannot=",LoTrigger);
   return(0);
}
if (0>RsiBars || RsiBars>50 ) {
   Alert("Input Error:  must be 0< RsiBars <50, Cannot=",RsiBars);
   return(0);
}
//--------------------------------------------------------

// Check for ( additional bars loading or total reloadng.
if (Bars<prevbars || Bars-prevbars>1 ) is_First=True;
prevbars=Bars;
//--------------------------------------------------------

// Pre-Loop setup
// loopbegin prevents counting of previously plotted bars excluding current Bars
if (is_First ) {
   loopBegin=Bars-1-1;// BarIndexNumber=Shift=Bars-1...0

   // Compute the initial AvgUp & AvgDn for RSI
   for ( shift=loopBegin; shift>=loopBegin-RsiBars; shift--) {
      Delta=Close[shift]-Close[shift+1];
      SumUp=SumUp+MathMax(0,Delta);
      SumDn=SumDn-MathMin(0,Delta);
   }
   AvgUp=SumUp/RsiBars;
   AvgDn=SumDn/RsiBars;
   loopBegin=loopBegin-RsiBars;
}
//--------------------------------------------------------

// loop from loopbegin to current bar (shift=0)
if (! is_First ) {
   if ((Time[0]!=LastTime) ) {
     PrevAvgUp = AvgUp;
     PrevAvgDn = AvgDn;
     AvgUp = 0;
     AvgDn = 0;
     for ( count=WmaBars-1; count>=1; count--) {
        Value1[count]=Value1[count-1];
     }
     LastTime = Time[0];
   }
} else {
  cntdown = 1;
}

for ( shift=loopBegin; shift>=cntdown; shift--) {
   // Calc RSI manually
   Delta=Close[shift]-Close[shift+1];
   if (is_First ) {
     AvgUp=((RsiBars-1)*AvgUp+MathMax(0,Delta))/RsiBars;
     AvgDn=((RsiBars-1)*AvgDn-MathMin(0,Delta))/RsiBars;
   } else {
     AvgUp=((RsiBars-1)*PrevAvgUp+MathMax(0,Delta))/RsiBars;
     AvgDn=((RsiBars-1)*PrevAvgDn-MathMin(0,Delta))/RsiBars;
   }
   RSI=100-100/(1+AvgUp/AvgDn);
   // ) scale RSI to between -5 and +5
   /* Do not use iRSI fctn because it\'s too slow
   Value1=0.1*(iRSI(RsiBars,shift)-50); */
   Value1[0]=0.1*(RSI-50);

   // Use weighted moving average to smooth Value1.
   // Ehler suggests could also use EMA, which would be simpler coding at the expense of Alpha.
   WmaNumerator=0;
   WmaDenominator=0;
   for ( count=WmaBars; count>= 1; count--) {
      WmaNumerator=WmaNumerator+count*Value1[WmaBars-count-1];
      WmaDenominator=WmaDenominator+count;
   }
   Value2=WmaNumerator/WmaDenominator;
   IFish=(MathExp(2*Value2)-1)/(MathExp(2*Value2)+1);

   ExtMapBuffer1[shift]=IFish;
//   SetIndexValue[shift]=RSI;

   // Plot dual-value Trigger Line
   if (IFish >0 )
      ExtMapBuffer2[shift]=HiTrigger;
   else
      ExtMapBuffer2[shift]=LoTrigger;
   //--------------------------------------------------------

   // Update arrays.  This technique minimizes array storage and thus allows more signal bars.
   if (is_First ) for ( count=WmaBars-1; count>= 1; count--) {
      Value1[count]=Value1[count-1];
   }
   //--------------------------------------------------------
}

is_First = False;
cntdown = 0;
loopBegin = 0;


//----
   return(0);
  }
//+------------------------------------------------------------------+
Comments