IND InverseB
Indicator

IND InverseB

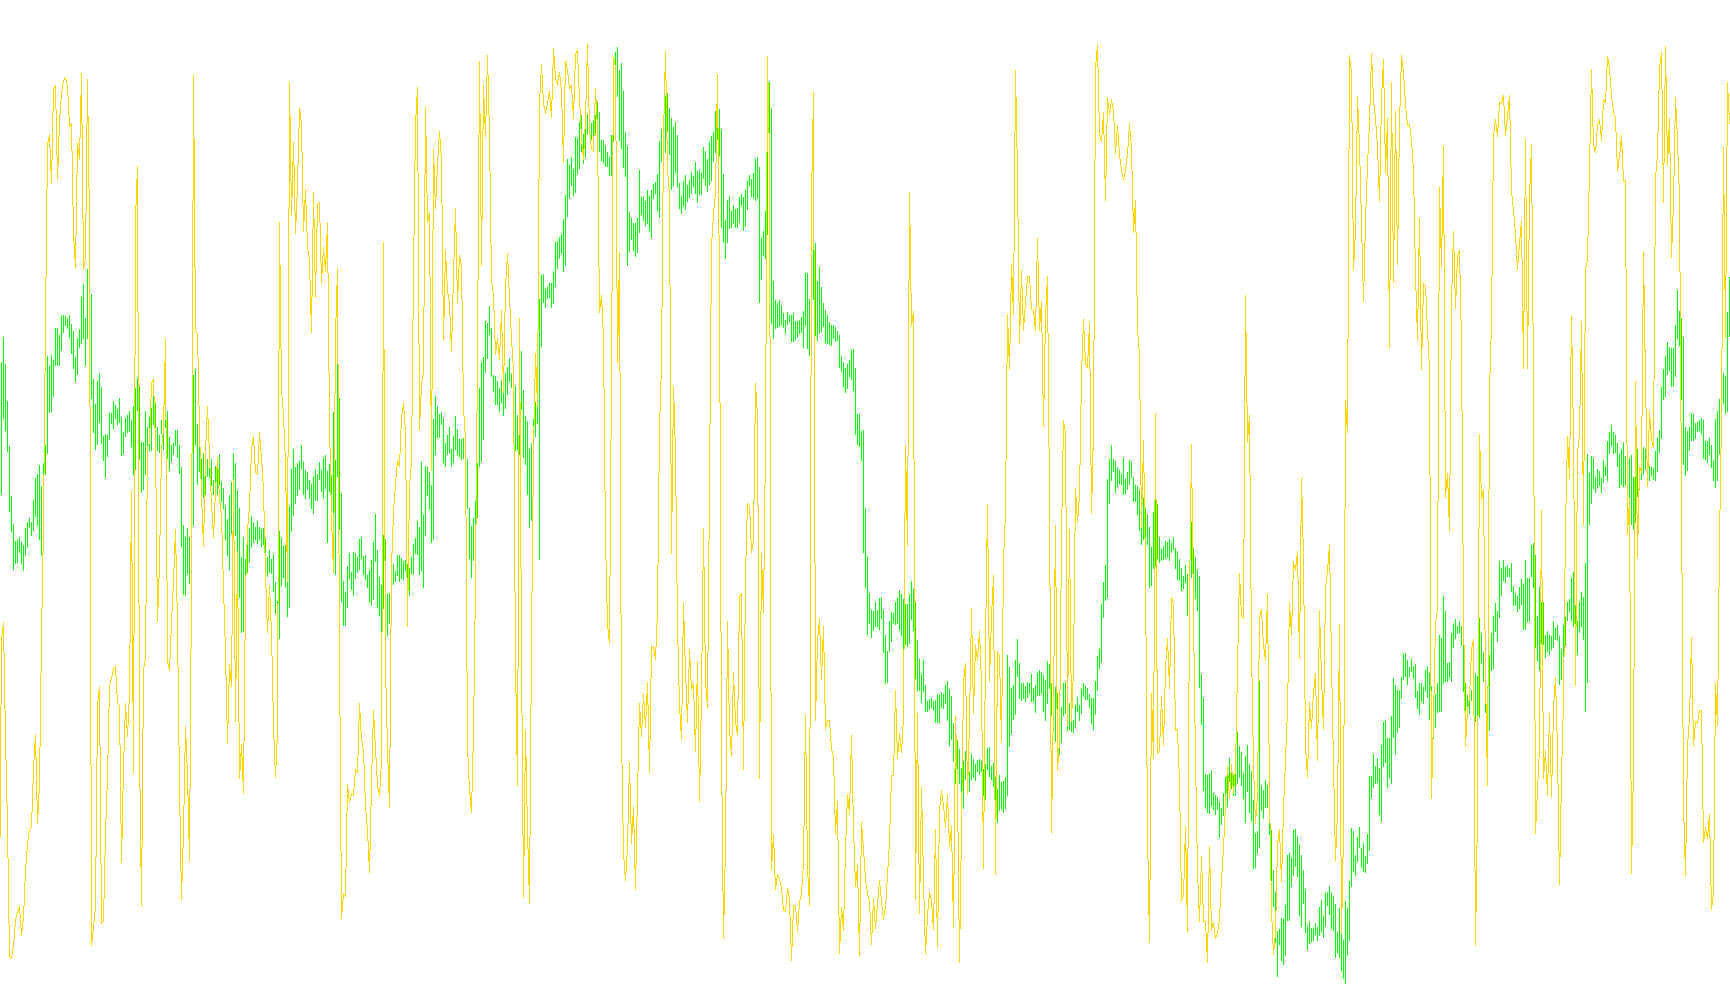
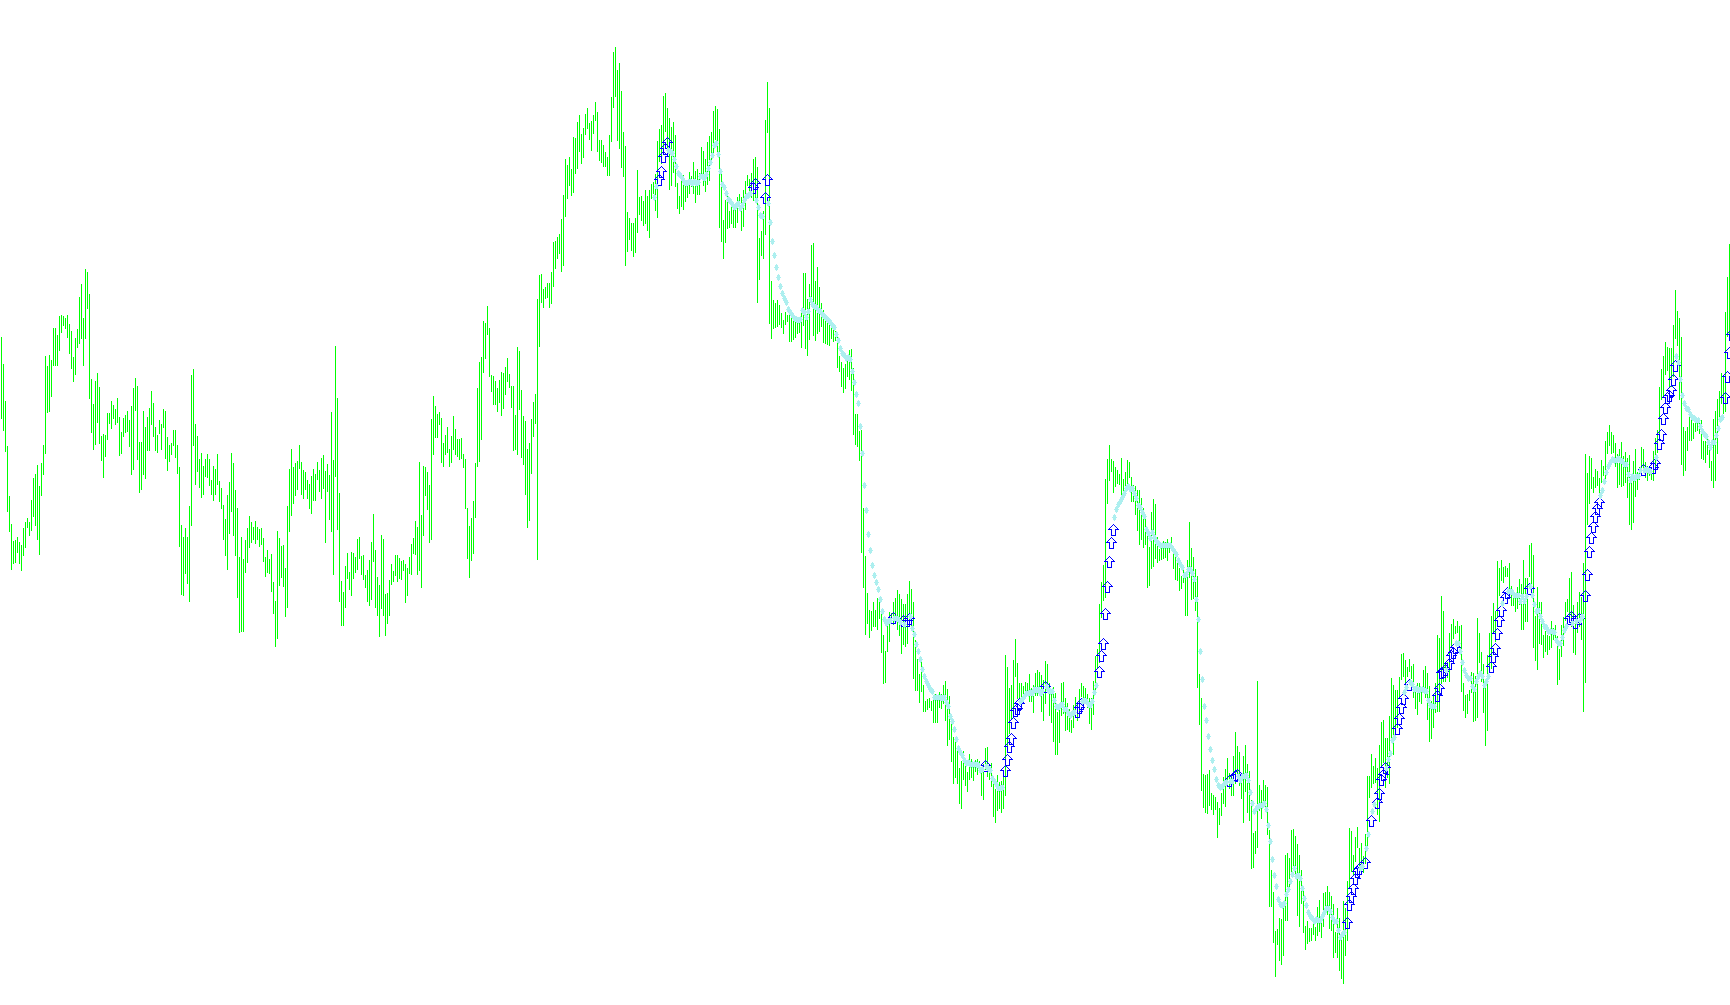
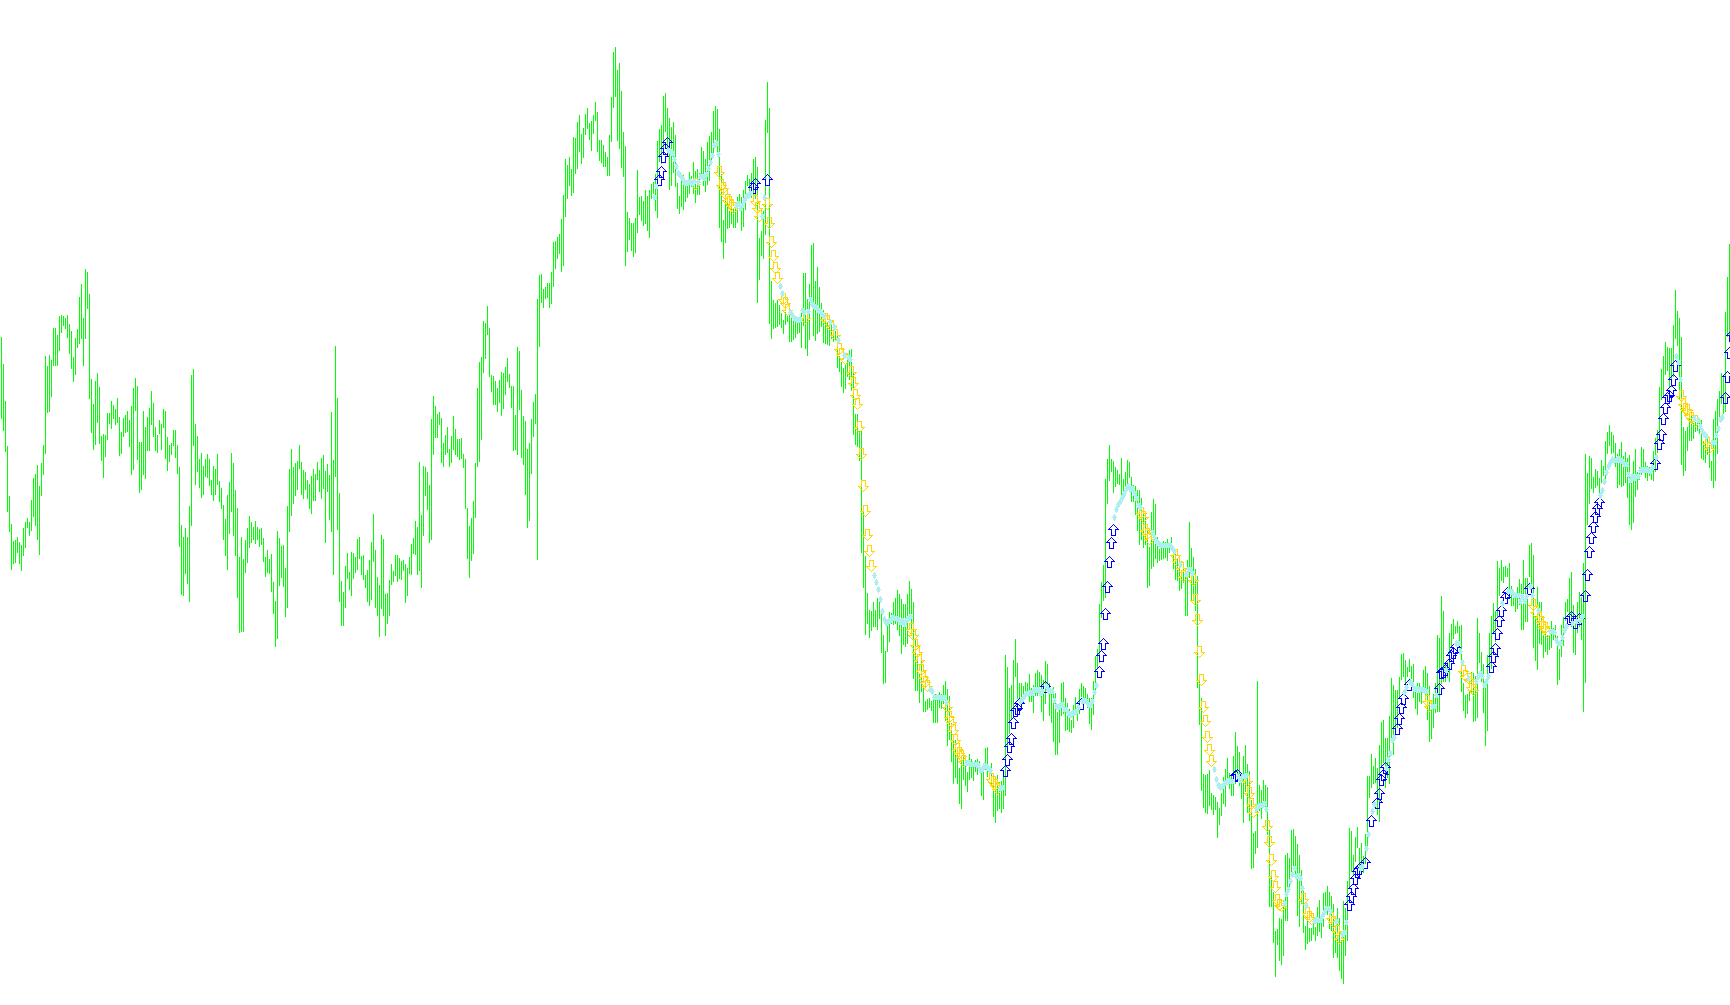
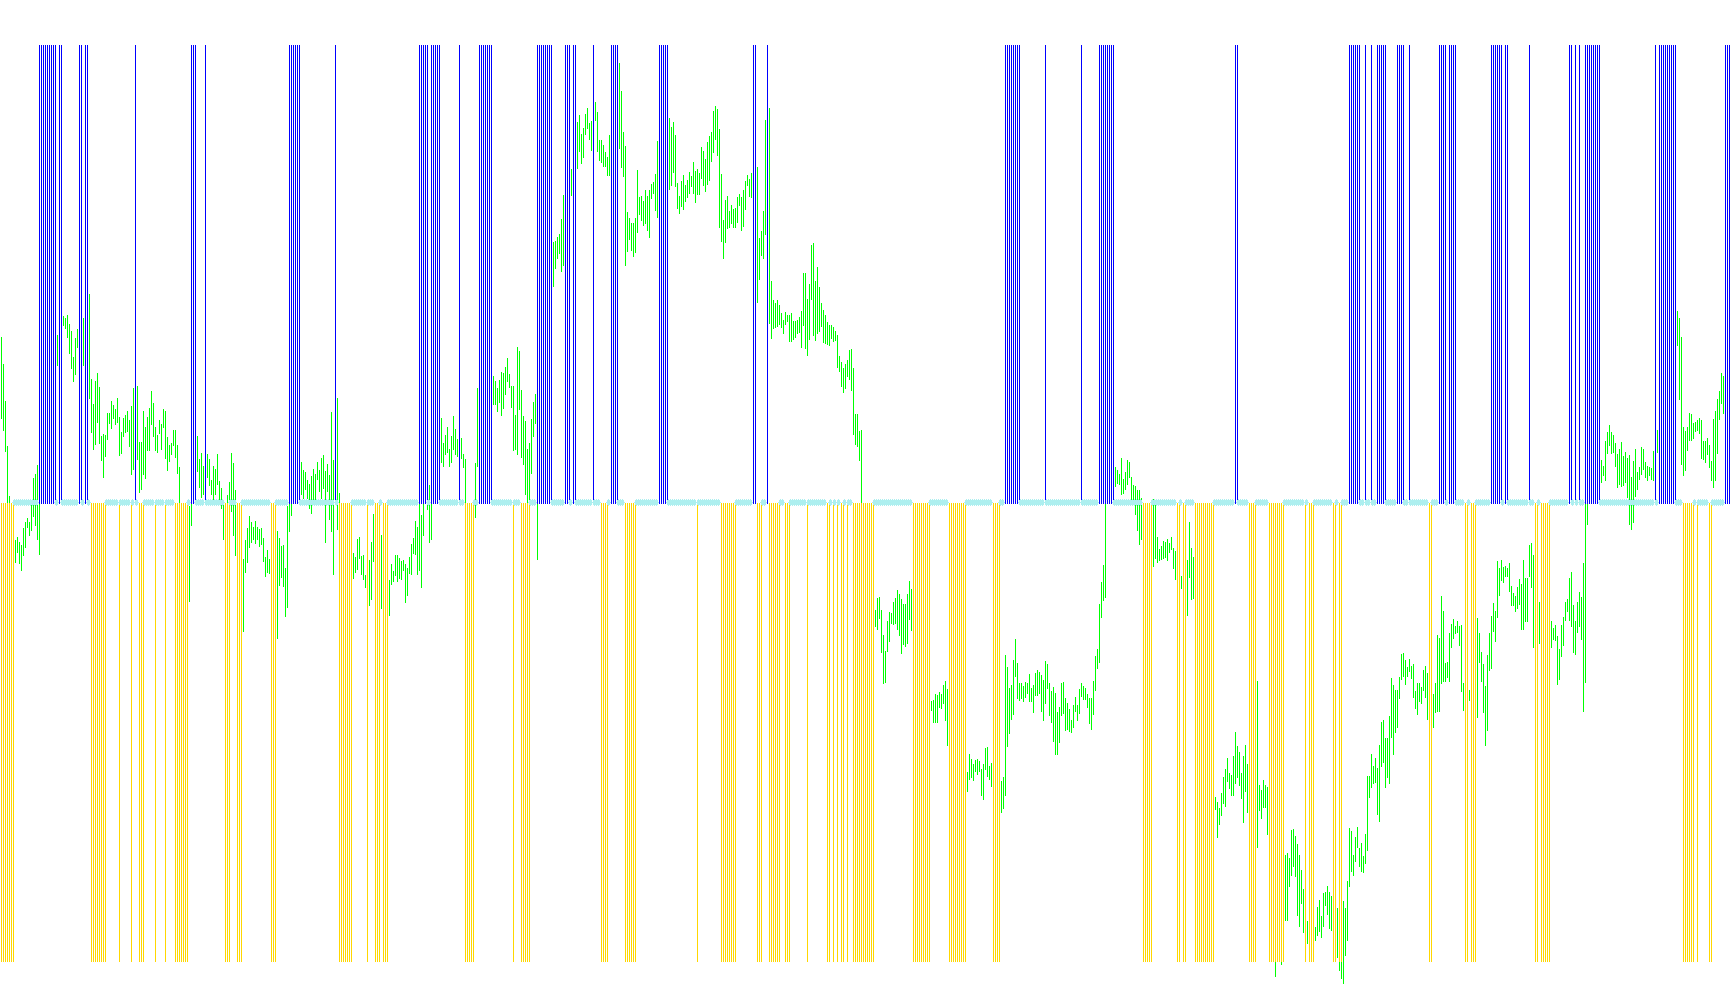
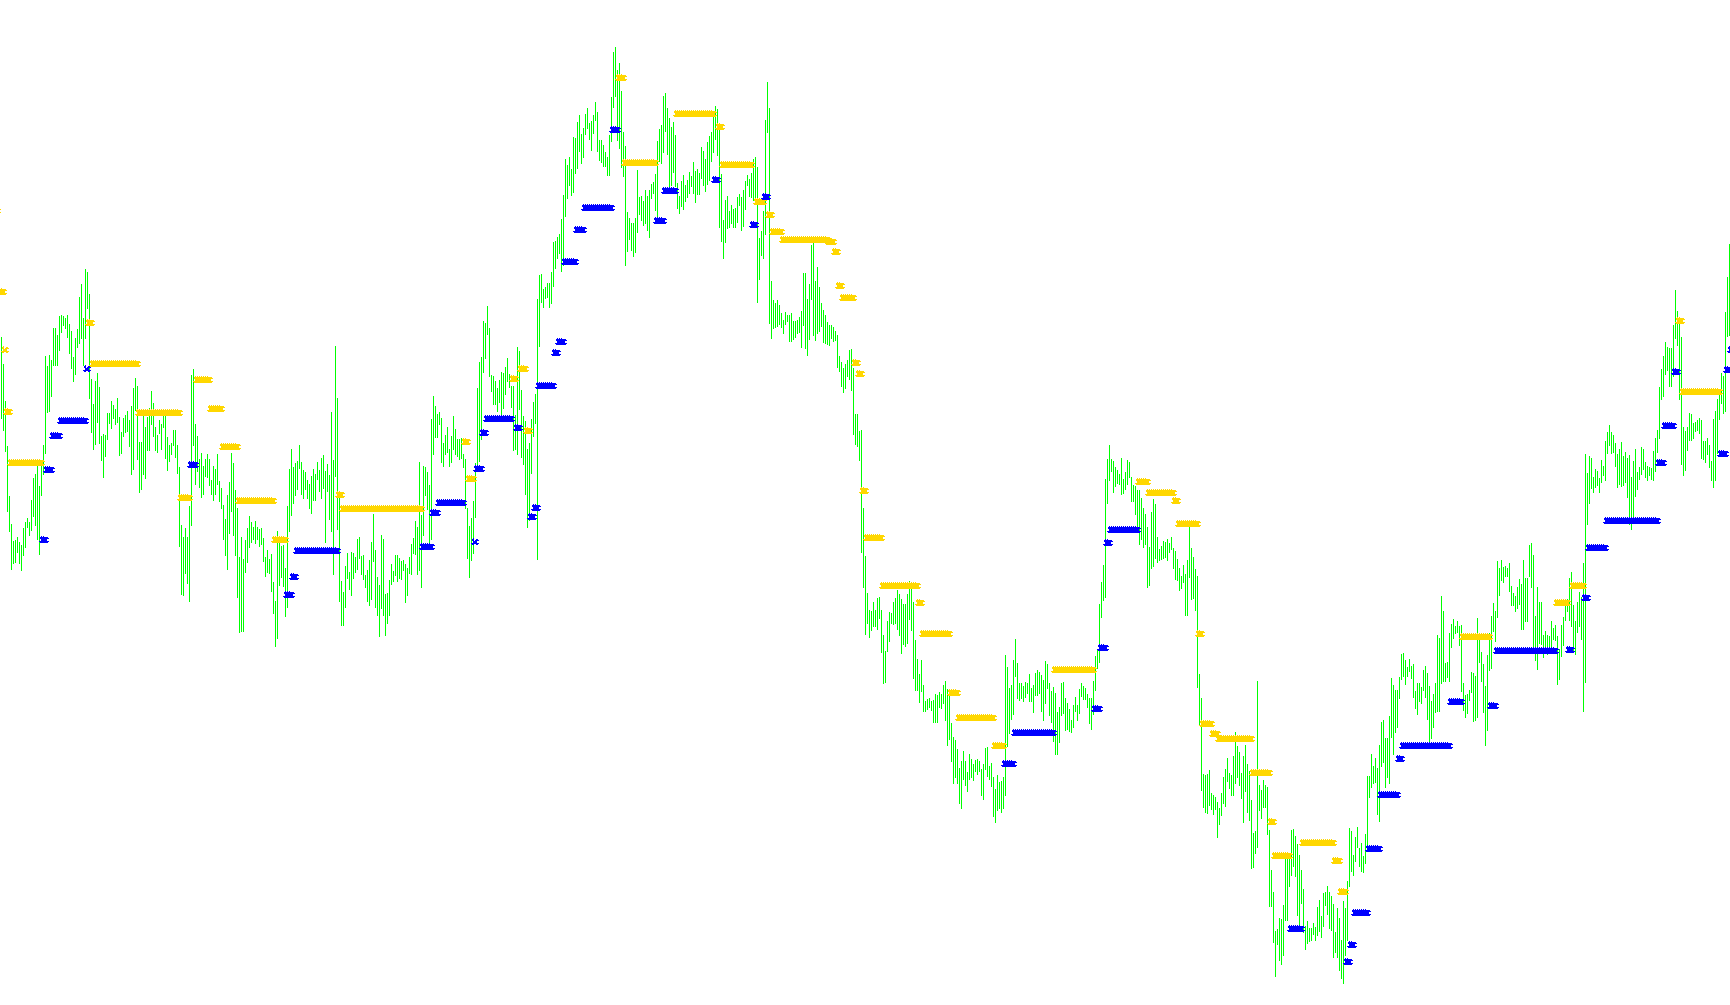
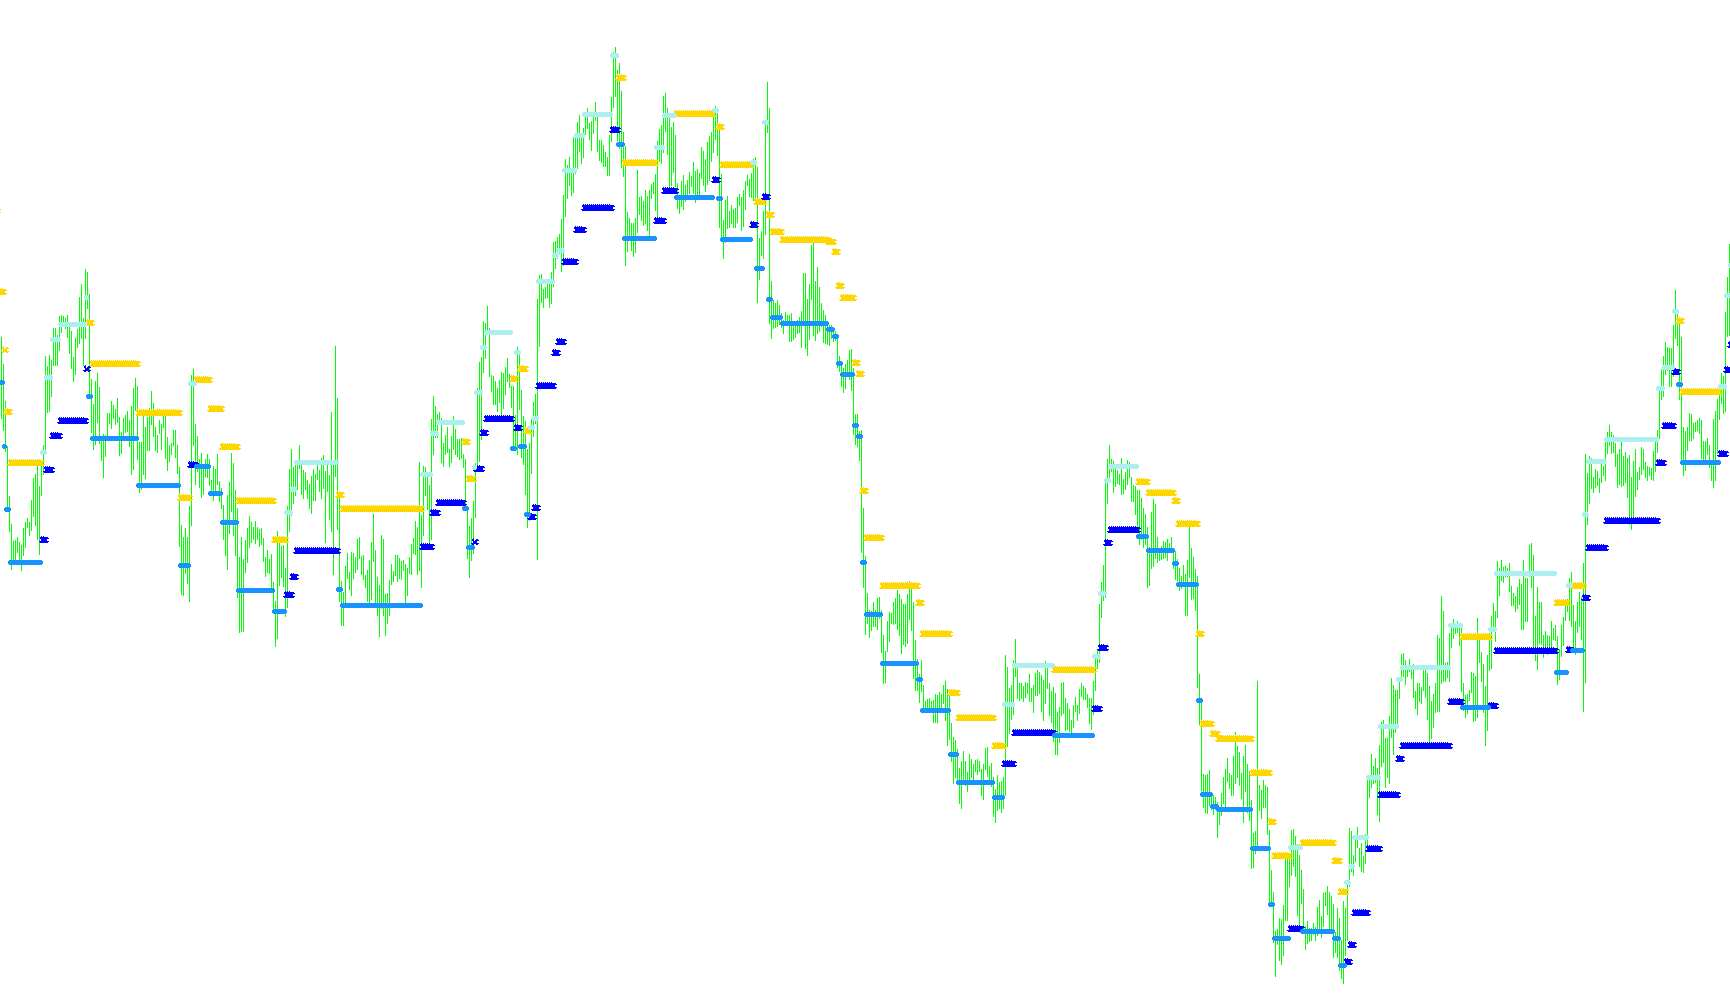
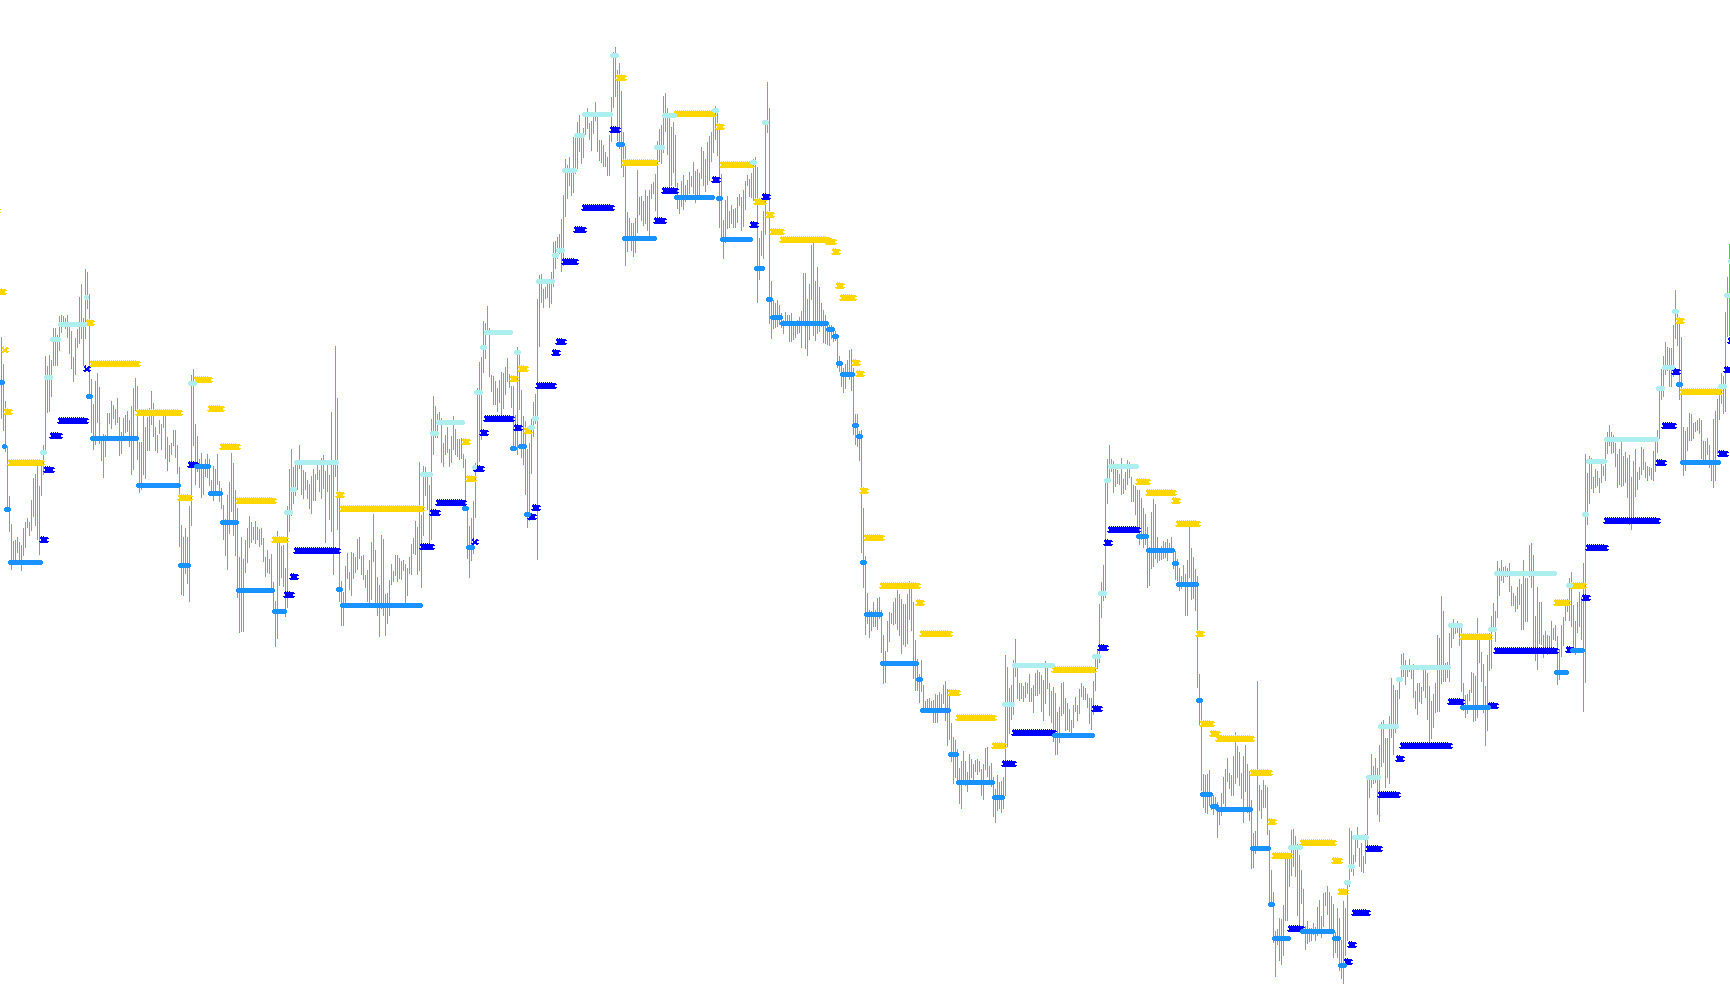
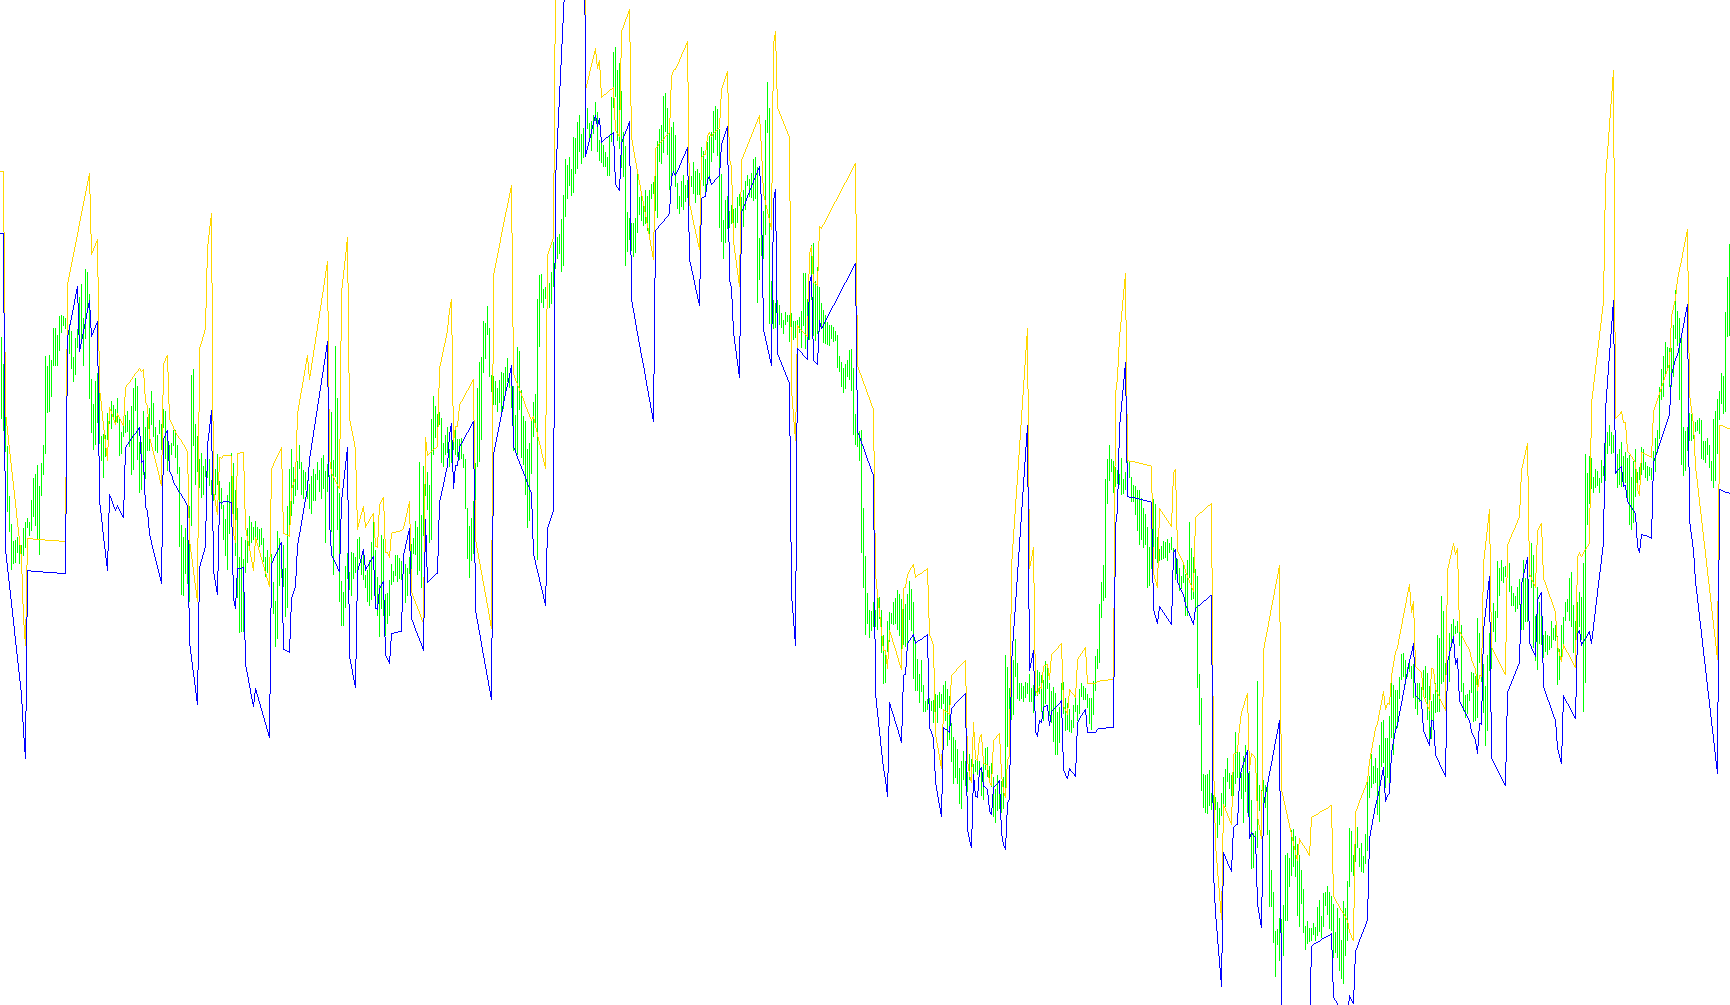
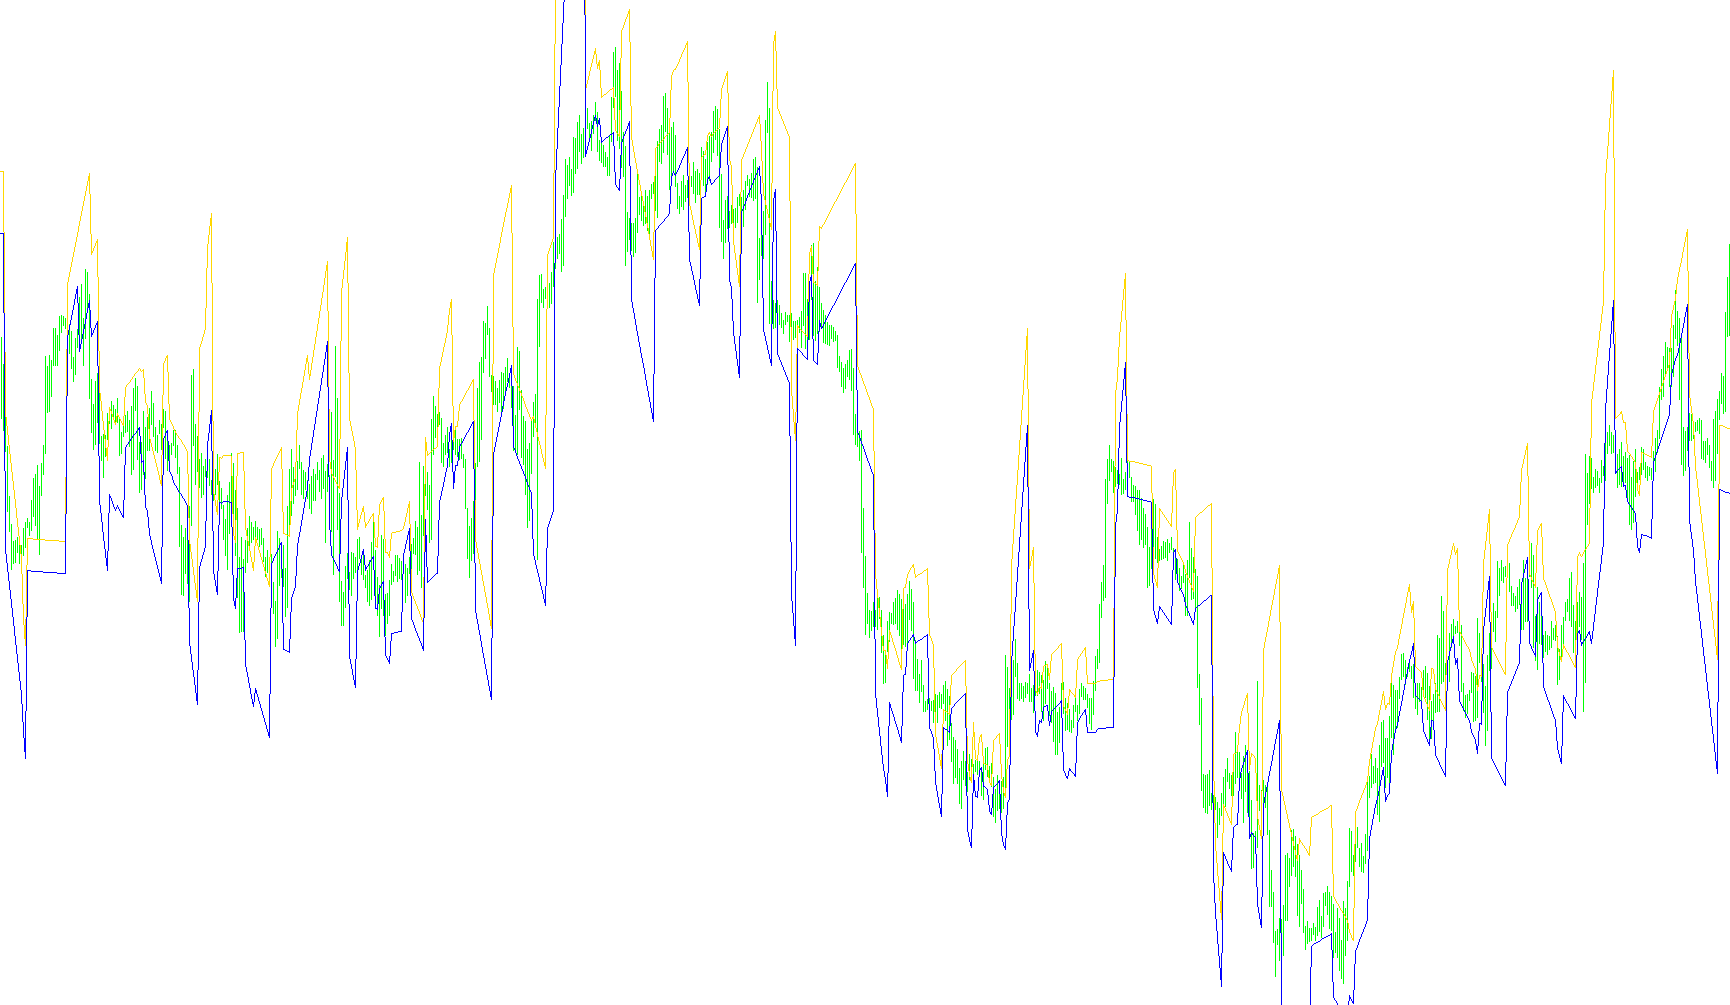
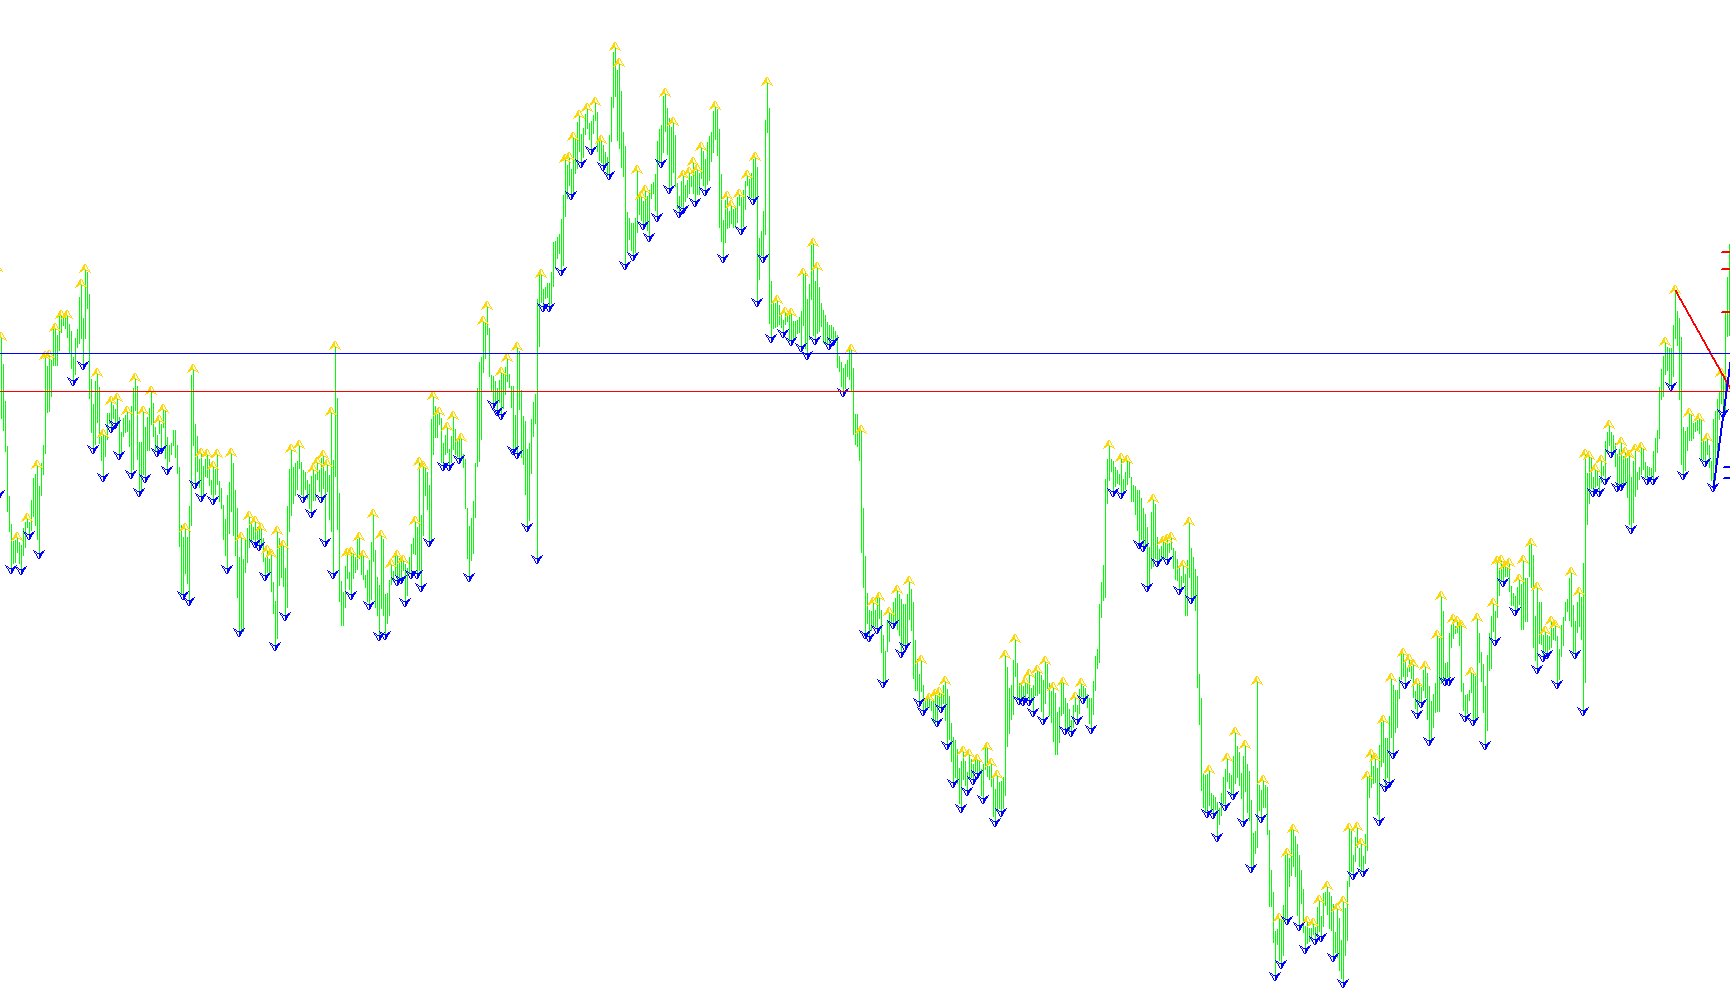
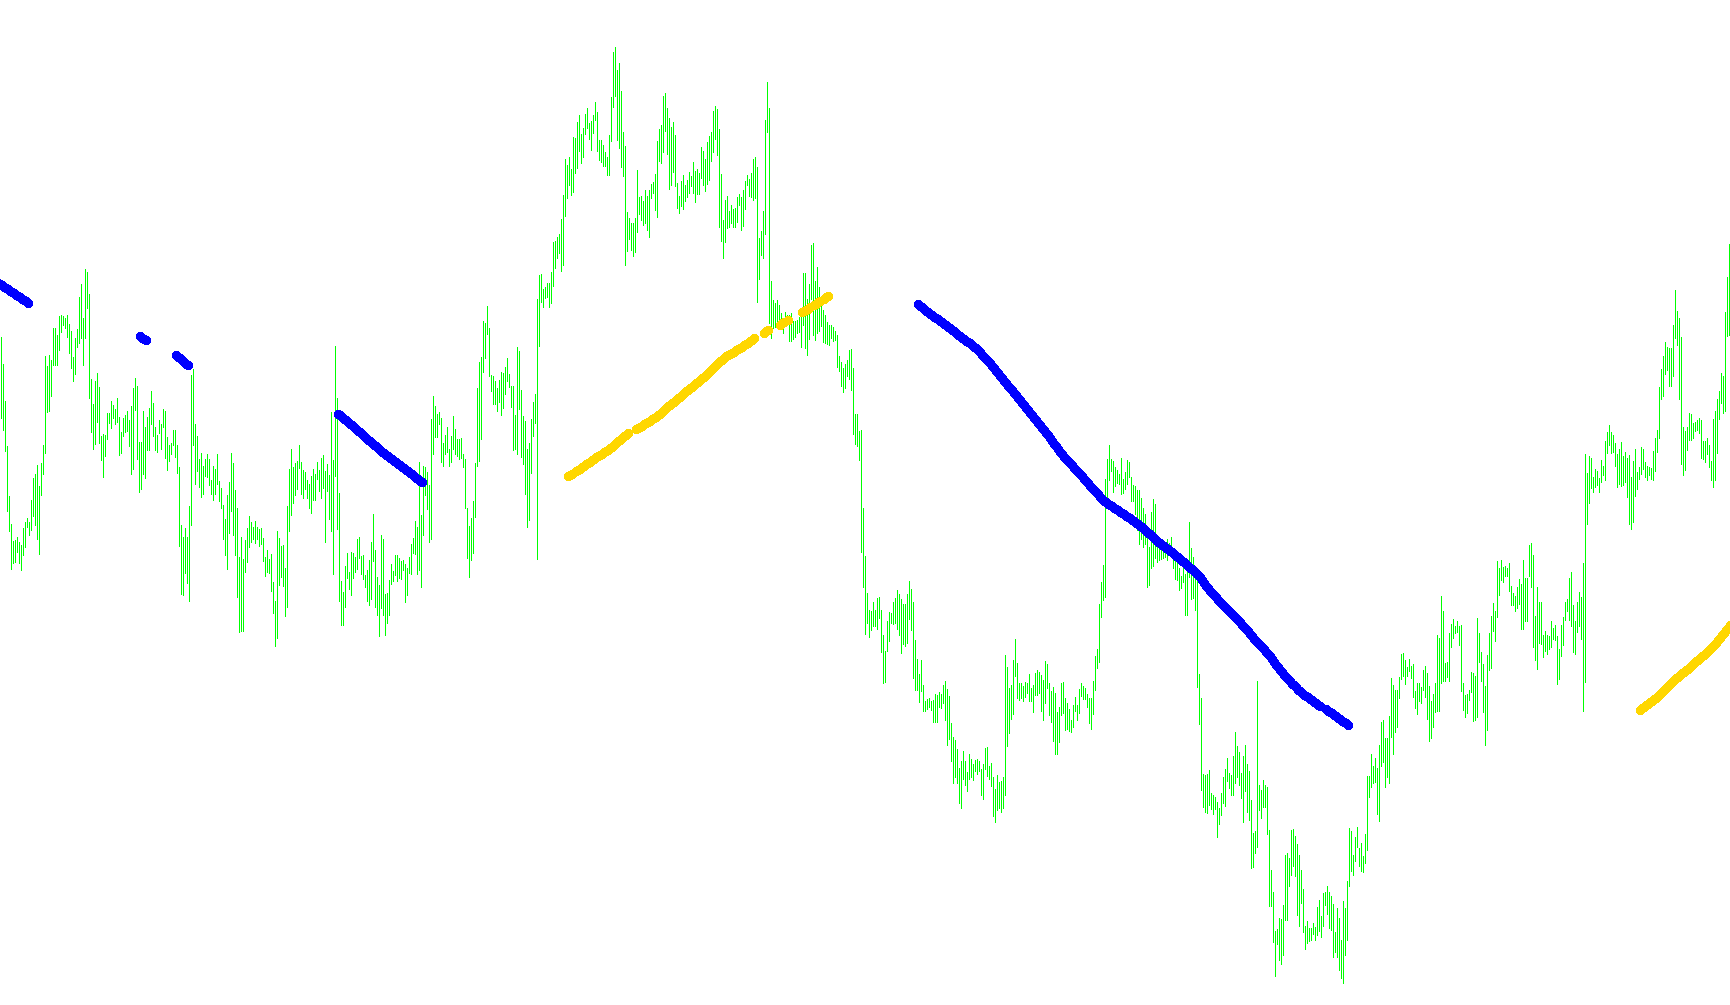
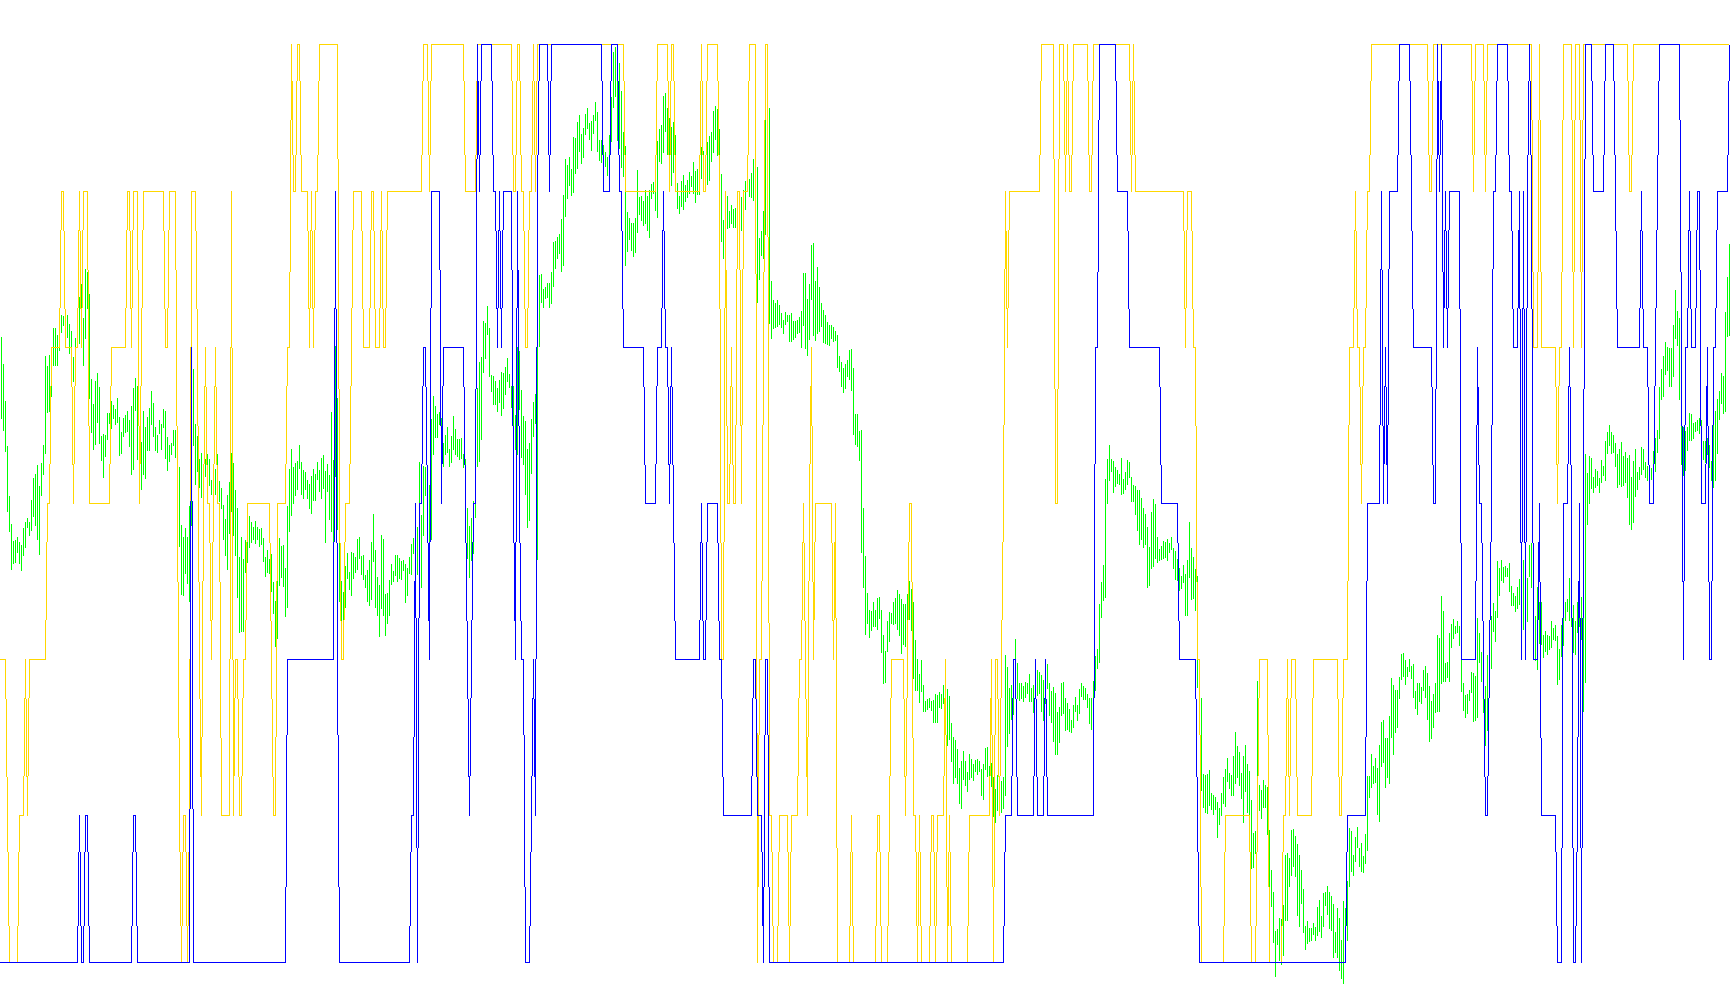
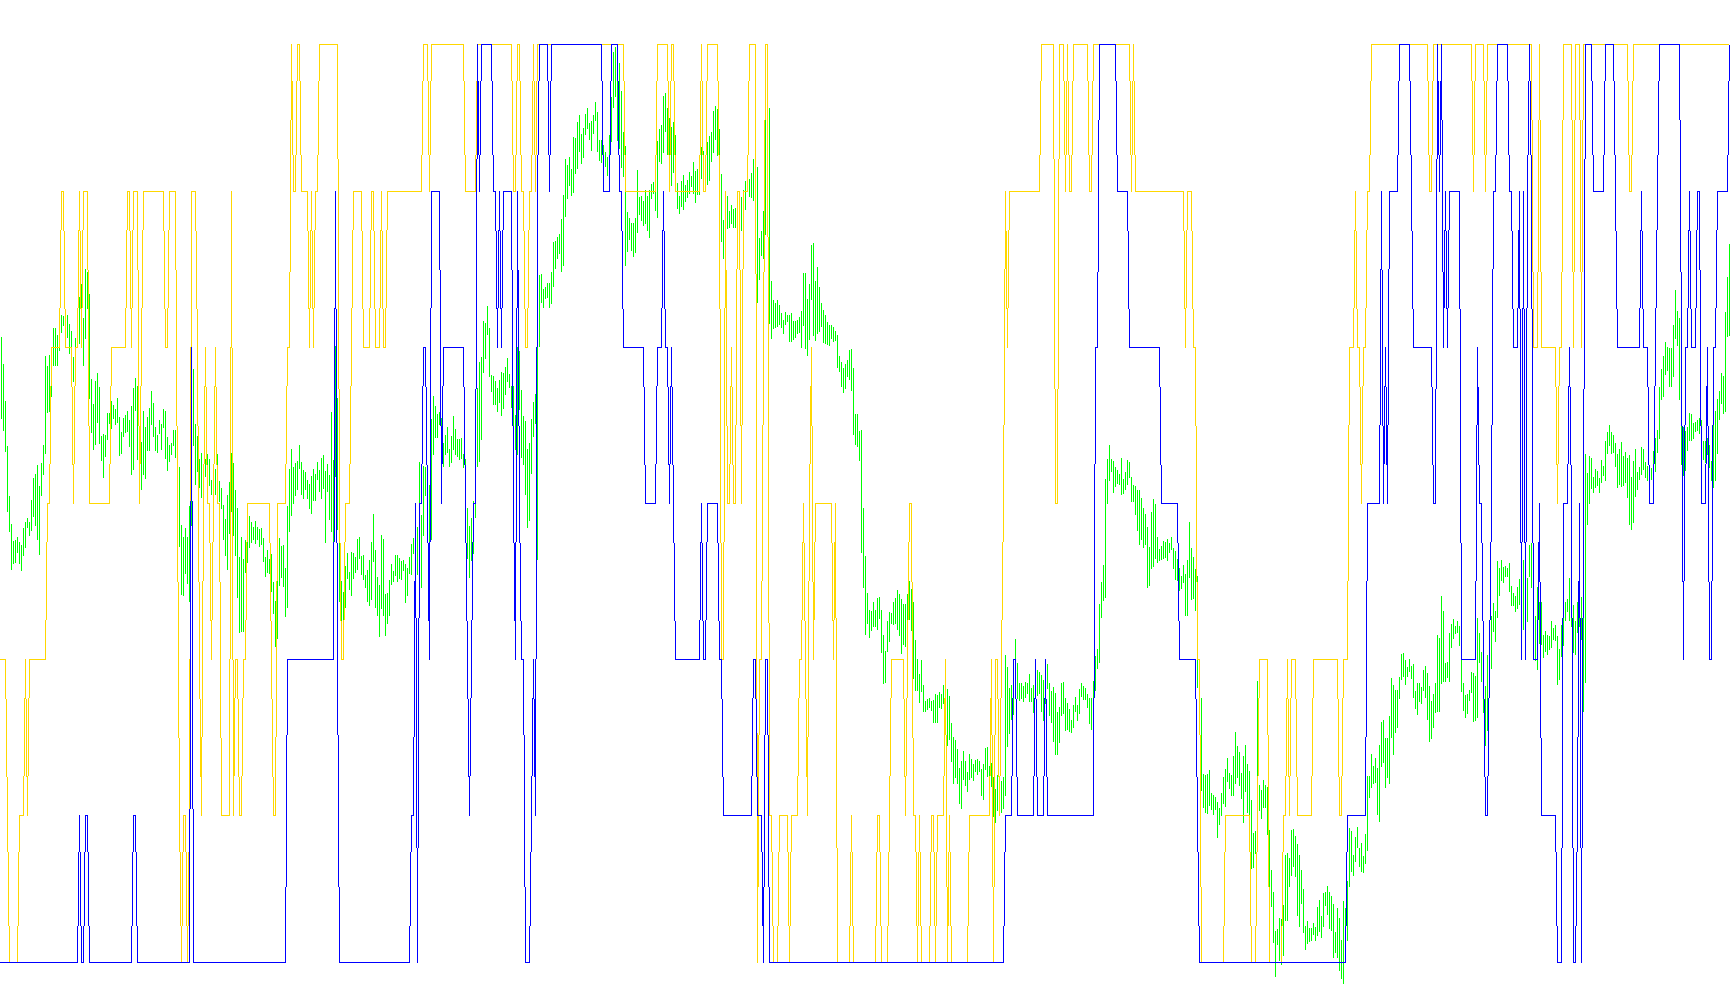
This indicator quantifies the relative position of the current closing price within a dynamic volatility range by normalizing it against the historical high-low amplitude.
IND InverseB_v1
Indicator

IND InverseB_v1

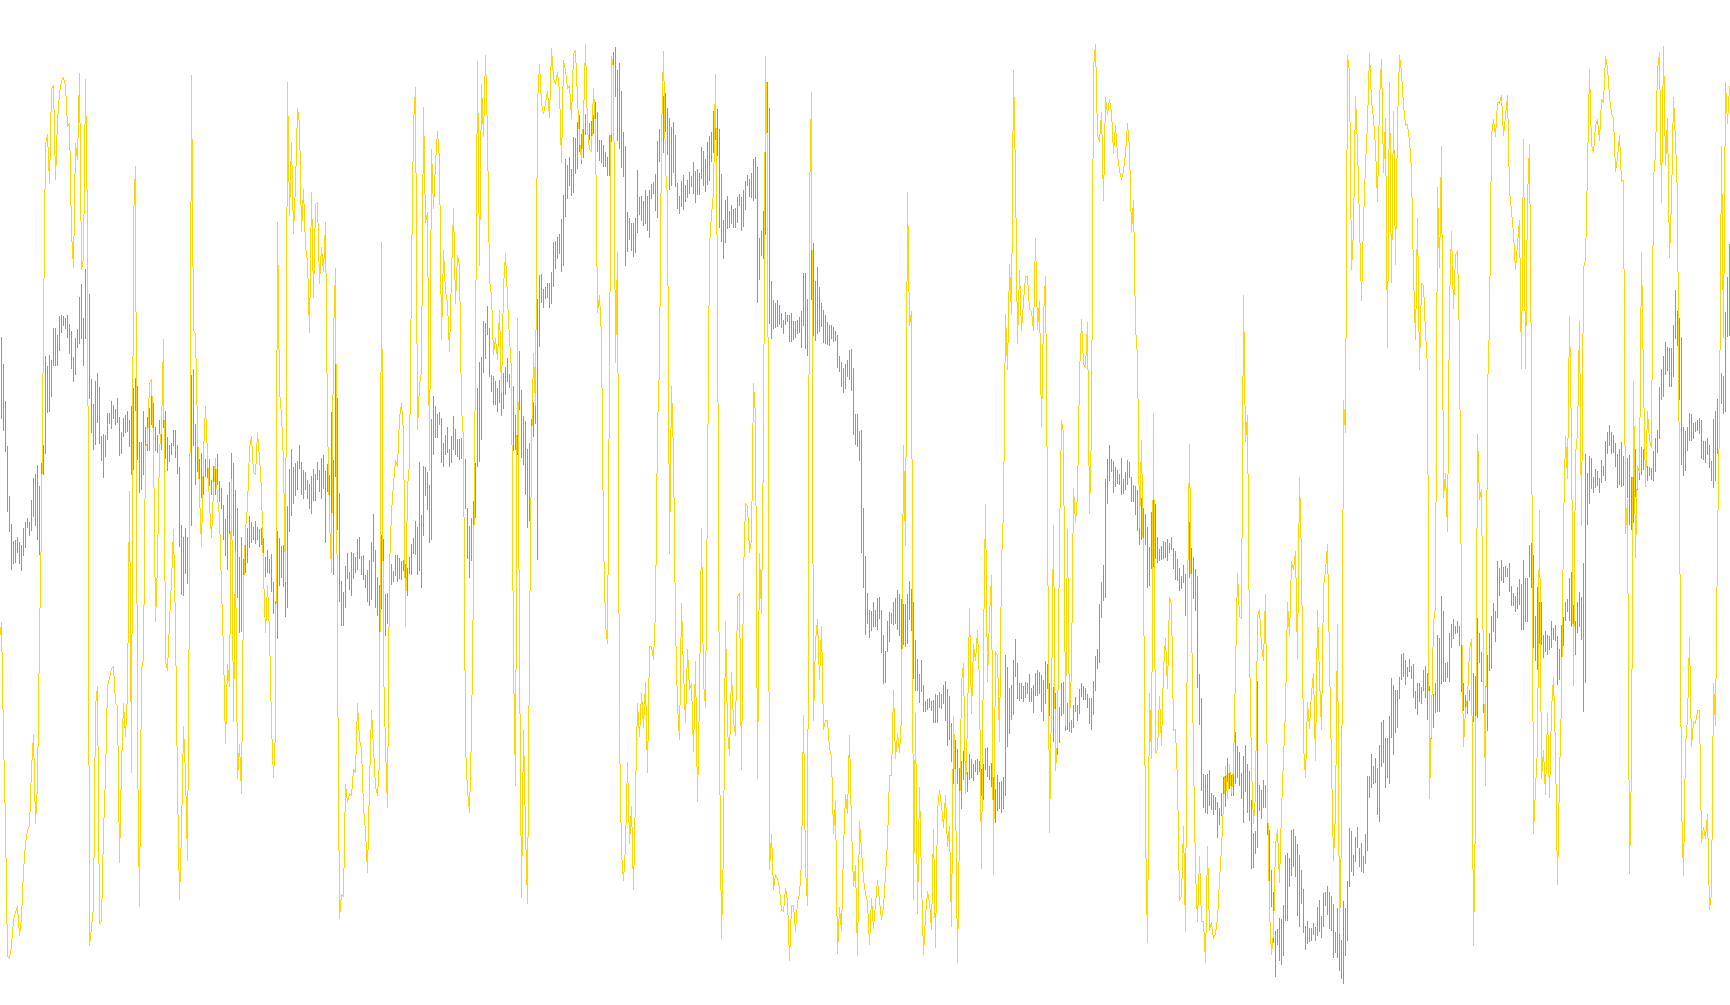
This indicator normalizes the current closing price against a dynamic range established by historical high and low extremes to identify relative momentum.

IND Inverse_v1
Indicator

IND Inverse_v1

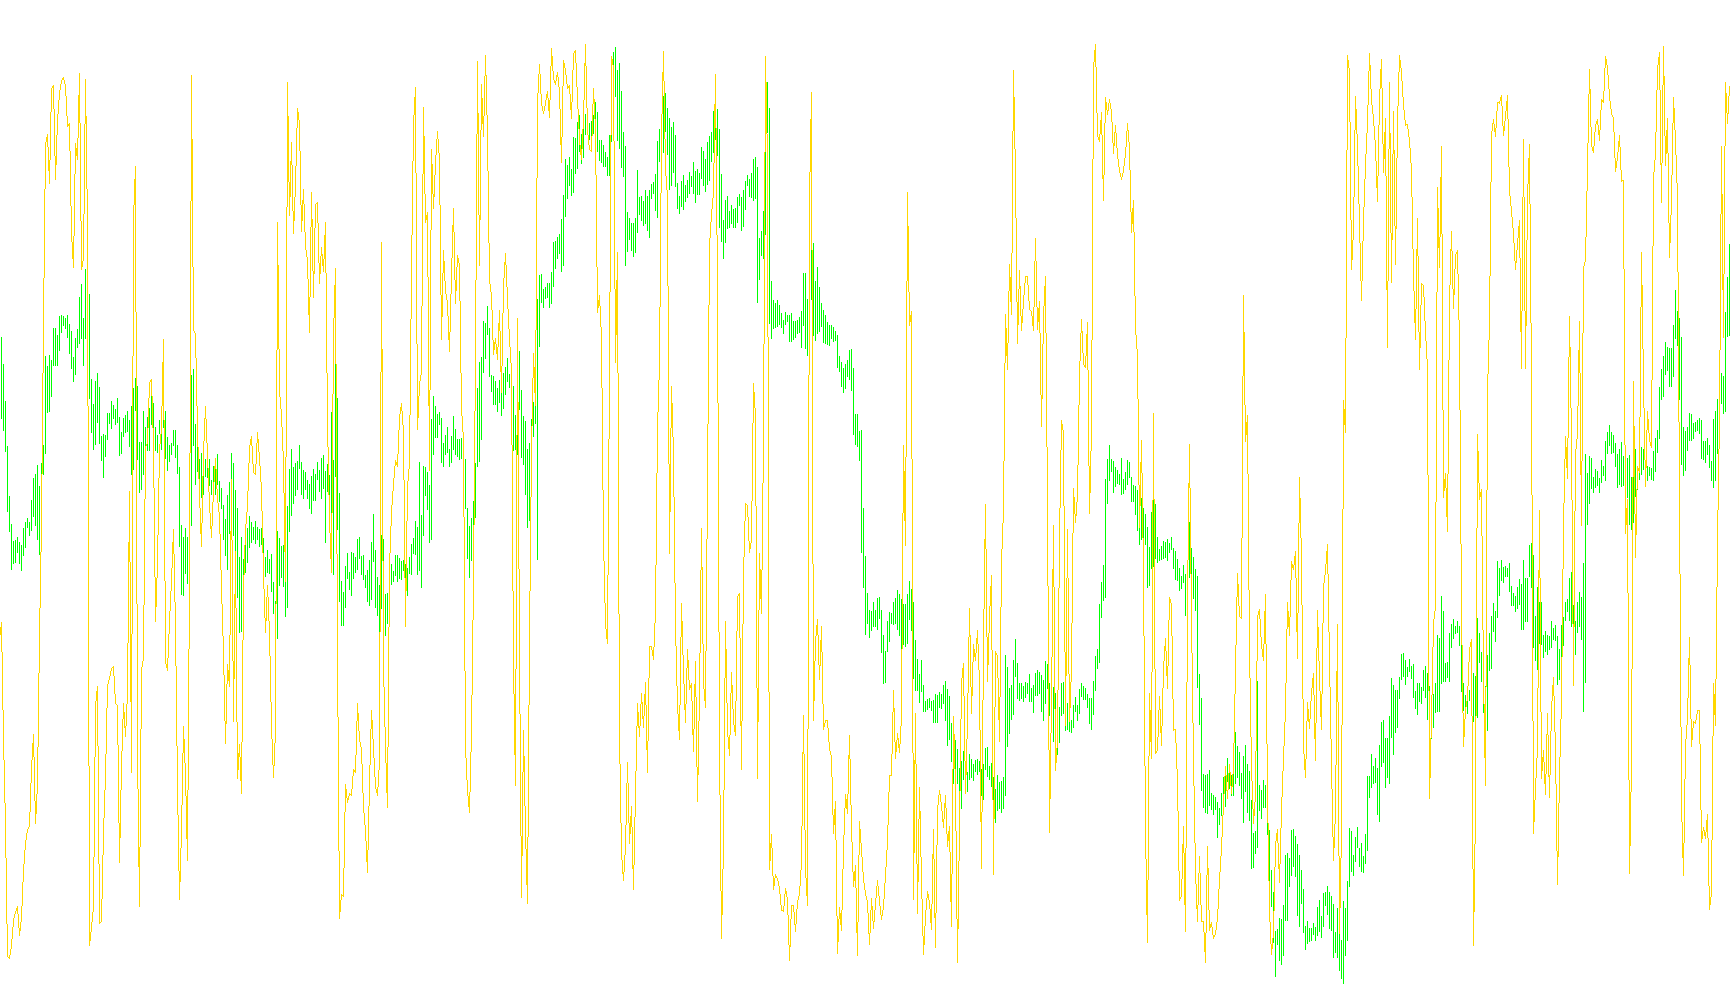
This indicator calculates a normalized price position relative to the range between the highest high and lowest low over a rolling window to identify momentum extremes.

Indicator

Ind-Fractals-1(08SEP05)

Indicator

Ind-Fractals-1(08SEP05)_v1

Indicator

Ind-Fractals-1

Indicator

Ind-Fractals-1b

iATR
Indicator

Ind-Fractals-1_001

Indicator

Ind-Fractals-1_002

Indicator

Ind-Fractals-1_v1

Indicator

Ind-Fractals-alltf-1.1.1(1)

Ind-GG01-101
Indicator

Ind-GG01-101

iBandsiMAiSAR

This indicator identifies high-probability entry points by synchronizing Parabolic SAR trend reversals with smoothed moving average crossovers and expanding Bollinger Band volatility expansion.

Ind-GG01
Indicator

Ind-GG01

iBandsiMAiSAR

Identifies high-momentum entries by correlating smoothed moving average crossovers, parabolic SAR price action, and expanding Bollinger Band volatility thresholds.

Ind-GG01M
Indicator

Ind-GG01M

iBandsiMAiSARiStdDev

Identifies trend reversals by synchronizing smoothed moving average crossovers with Parabolic SAR filters and expanding Bollinger Band volatility thresholds.

Ind-GG01M1
Indicator

Ind-GG01M1

iBandsiMAiSARiStdDev

This indicator identifies trend reversal points by synthesizing smoothed moving average crossovers, Parabolic SAR positioning, and expanding Bollinger Band width to filter for high-momentum volatility.

Ind-GG01M_sw
Indicator

Ind-GG01M_sw

iBandsiMAiSARiStdDev

This indicator identifies high-probability reversal points by synchronizing Parabolic SAR trend breaks with expanding Bollinger Band dynamics and smoothed moving average deviations.

Ind-Murrey_Math_MT4_VG-1
Indicator

Ind-Murrey_Math_MT4_VG-1

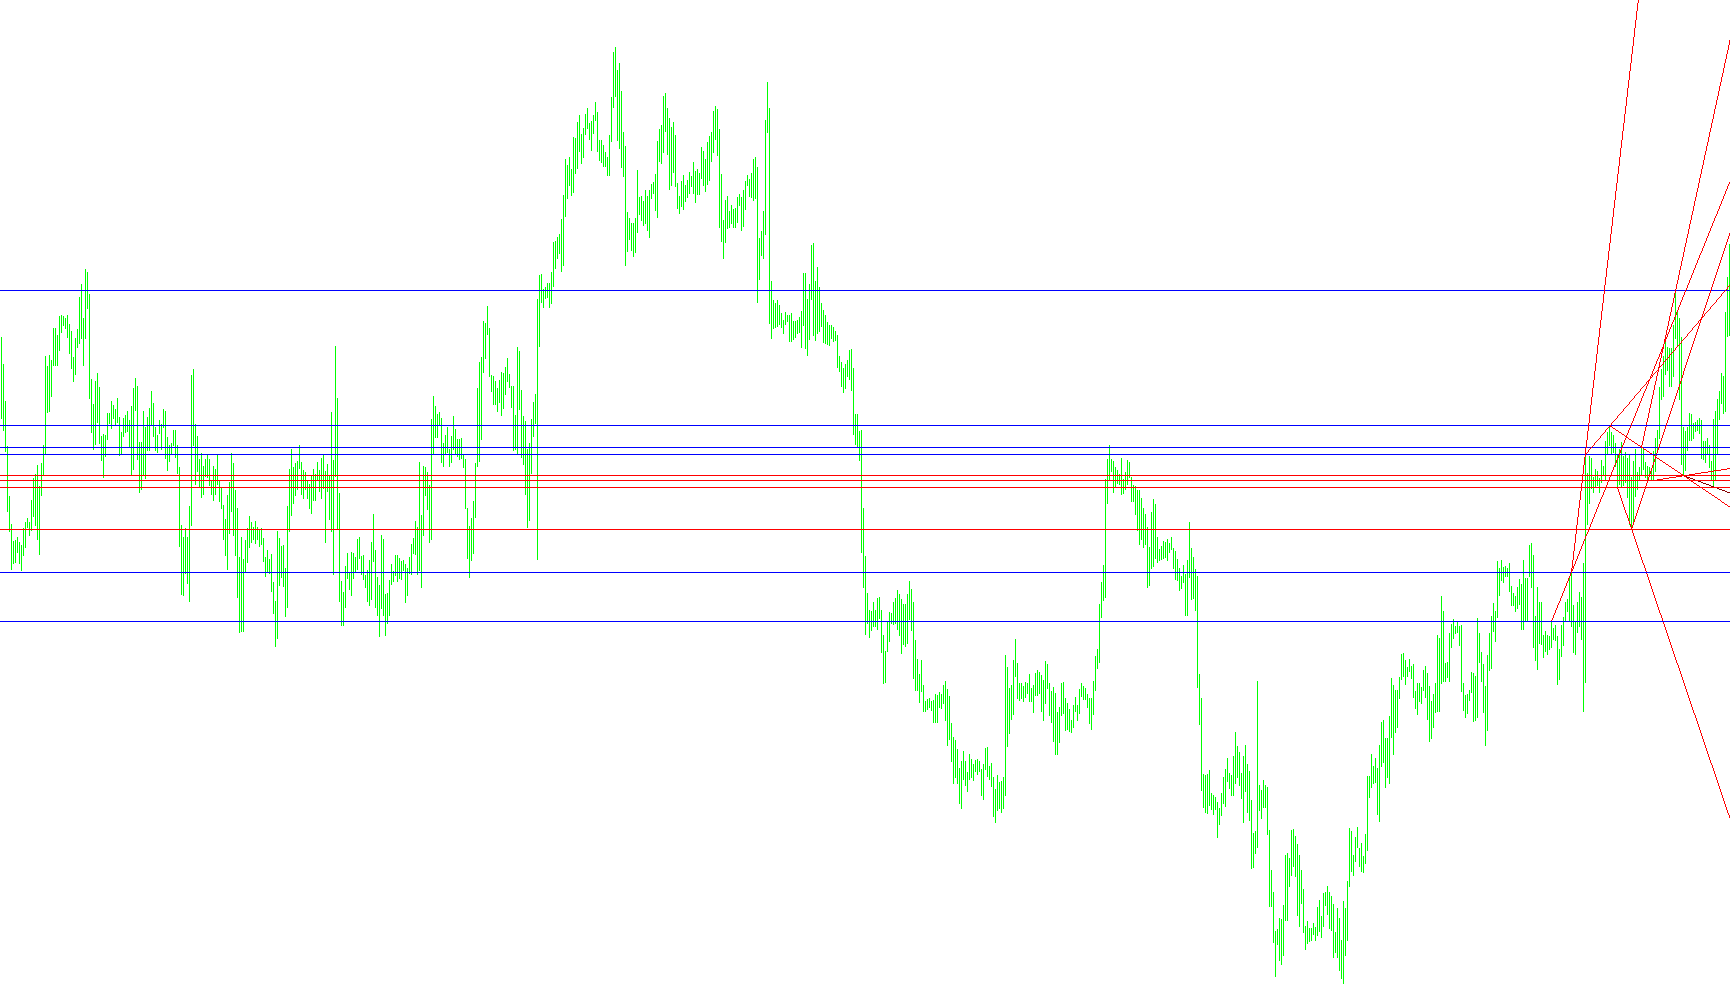
This indicator identifies multi-layered support and resistance zones by calculating logarithmic price fluctuations and projecting octave-based pivot points.

Ind-NRTR-1
Indicator

Ind-NRTR-1

iATR

This indicator identifies trend shifts by monitoring price breaches of ATR-based volatility boundaries and dynamically updates support/resistance levels.

Ind-NRTR-3Period
Indicator

Ind-NRTR-3Period

iATR

This indicator identifies directional momentum by dynamically adjusting volatility-based support and resistance levels across H1, H4, and D1 timeframes.

Ind-NRTR
Indicator

Ind-NRTR

iATR

This indicator identifies dynamic trend reversals by monitoring price breaches of volatility-adjusted ceilings and floors derived from ATR calculations.

Ind-NRTR_v1
Indicator

Ind-NRTR_v1

iATR

This indicator identifies trend shifts by calculating volatility-adjusted price boundaries and detecting breakout signals based on ATR-scaled buffers.

Ind-SKB-1
Indicator

Ind-SKB-1

iFractals
Ind-SKB-1_v1
Indicator

Ind-SKB-1_v1

iFractals
Ind-SKB-1_v2
Indicator

Ind-SKB-1_v2

iFractals
Ind-StDev-AVG
Indicator

Ind-StDev-AVG

iStdDev

This indicator generates a histogram by applying multiple moving average types (SMA, EMA, SMMA, LWMA) to standard deviation data to filter market noise and highlight underlying volatility trends.

Ind-TD-DeMark-3-1-new
Indicator

Ind-TD-DeMark-3-1-new

This indicator identifies DeMark and Fractal pivot points to project linear trend boundaries and automated take-profit targets based on historical high-low price action.

Ind-TD-DeMark-3-1
Indicator

Ind-TD-DeMark-3-1

This indicator identifies DeMark termination points and fractals to project trendlines, horizontal support/resistance levels, and multiple potential profit targets.

Ind-TD-DeMark-3-1_eng
Indicator

Ind-TD-DeMark-3-1_eng

This indicator identifies structural swing points using DeMark methodology or Fractals to project trendlines and automated take-profit targets based on multi-step pivot analysis.

Ind-TD-DeMark-3-1_eng_v1
Indicator

Ind-TD-DeMark-3-1_eng_v1

This indicator identifies Tom DeMark trend points and fractal extremes to project geometric trendlines and calculate multi-tier profit targets based on historical price expansion.

Ind-TD-DeMark-3-1_v1
Indicator

Ind-TD-DeMark-3-1_v1

This indicator identifies structural pivot points and projects future price targets by calculating trendline slopes between sequential high and low DeMark levels.

Ind-TD-DeMark-3-1_v2
Indicator

Ind-TD-DeMark-3-1_v2

This indicator identifies DeMark Trend Points (TD) or Fractals to project structural trendlines and calculate multi-level take-profit targets based on price pivot analysis.

Ind-TD-DeMark-3-1_v3
Indicator

Ind-TD-DeMark-3-1_v3

This indicator identifies DeMark trend points and fractals to project linear price trajectories, providing visual trendlines and multi-level profit targets.

Ind-TD-DeMark-3
Indicator

Ind-TD-DeMark-3

This indicator identifies and projects price trendlines and potential profit targets based on Thomas DeMark sequence points and fractal extremes.

Ind-TRWscalper
Indicator

Ind-TRWscalper

iMA

Identifies directional trend shifts by detecting sequential SMA price movements that exceed a predefined volatility threshold.

Ind-Widners Oscilator
Indicator

Ind-Widners Oscilator

This indicator calculates a normalized percentage based on the average ratio of historical local extrema relative to current closing prices to identify overextended market cycles.

Ind-Widners_Oscilator
Indicator

Ind-Widners_Oscilator

This indicator calculates a percentage-based momentum value by normalizing the ratios of recent local highs and lows relative to current closing prices.

Ind-Widners_Oscilator_001
Indicator

Ind-Widners_Oscilator_001

This indicator calculates a percentage oscillator by evaluating the ratio between current closing prices and the six most significant historical price extremes within a defined sliding window.

Ind-Widners_Oscilator_FO
Indicator

Ind-Widners_Oscilator_FO

iMAOnArray

This indicator quantifies price momentum by calculating the ratio between historical highest/lowest peaks and current closing prices, then smoothing the result through moving averages and hyperbolic tangent transformations.

Ind-WSO+WRO+Trend Line
Indicator

Ind-WSO+WRO+Trend Line

This indicator identifies and plots dynamic support and resistance levels based on recent price extremes, drawing trend lines to visually represent these potential turning points.

ind2
Indicator

ind2

iMA

This indicator identifies trend reversals by detecting price crossovers between the moving average of highs and lows, plotting directional arrows based on consecutive momentum shifts.

ind3
Indicator

ind3

This indicator synthesizes an Adaptive Moving Average with a noise-weighted error ratio and Bollinger Band deviations to detect significant momentum shifts and trend reversals.

Index of Chart Sentiment
Indicator

Index of Chart Sentiment

iMAOnArray

This indicator quantifies candle geometry by assigning numerical weights to body size and wick proportions relative to Bollinger Band volatility thresholds, then applies multi-stage smoothing to identify balanced momentum.

IndexDollar
Indicator

IndexDollar

This indicator calculates a composite valuation index by aggregating weighted price deviations of the GBP, EUR, CHF, and JPY currency pairs against fixed baseline benchmarks.

Indexes_v4
Indicator

Indexes_v4

iCCIOnArrayiMomentumOnArrayiMAOnArrayiRSIOnArray

This indicator synthesizes real-time price action from multiple currency pairs to compute and smooth synthetic global currency indices using customizable oscillators.

Indexes_v7
Indicator

Indexes_v7

iCCIOnArrayiMomentumOnArrayiMAOnArrayiRSIOnArray

This indicator calculates and visualizes the relative strength of major currencies by normalizing price actions into a unified index, optionally overlaying technical oscillators like RSI or MACD to identify momentum shifts.

Indexes_v7L
Indicator

Indexes_v7L

iCCIOnArrayiMomentumOnArrayiMAOnArrayiRSIOnArray

This indicator normalizes and synchronizes major currency performance into a unified 100-point scale to visualize relative strength and cross-currency divergence.

Indexes_v8L
Indicator

Indexes_v8L

iCCIOnArrayiMomentumOnArrayiMAOnArrayiRSIOnArray

This indicator calculates and normalizes real-time performance indices for major global currencies, providing a unified comparative view of relative strength using customizable oscillators and moving averages.

Indexes_v9L
Indicator

Indexes_v9L

This indicator calculates the relative performance of major currency pairs against a base currency by tracking percentage deviations from a specific historical starting point to visualize multi-currency equilibrium.

Index_pair_Dev_v1
Indicator

Index_pair_Dev_v1

iMAOnArrayiMAiRSIOnArrayiStdDev

This indicator calculates synthetic currency strength indices using geometric means of standard deviations and moving averages across multiple forex pairs, subsequently applying a smoothed RSI filter to identify momentum.

Index_pair_v22
Indicator

Index_pair_v22

iMAOnArrayiMAiRSIOnArray

This indicator synthesizes multi-pair exchange rate data into synthetic currency indices, applying an RSI filter with EMA smoothing to identify momentum trends across major fiat markets.