InsideBar_histo_mtf
Download script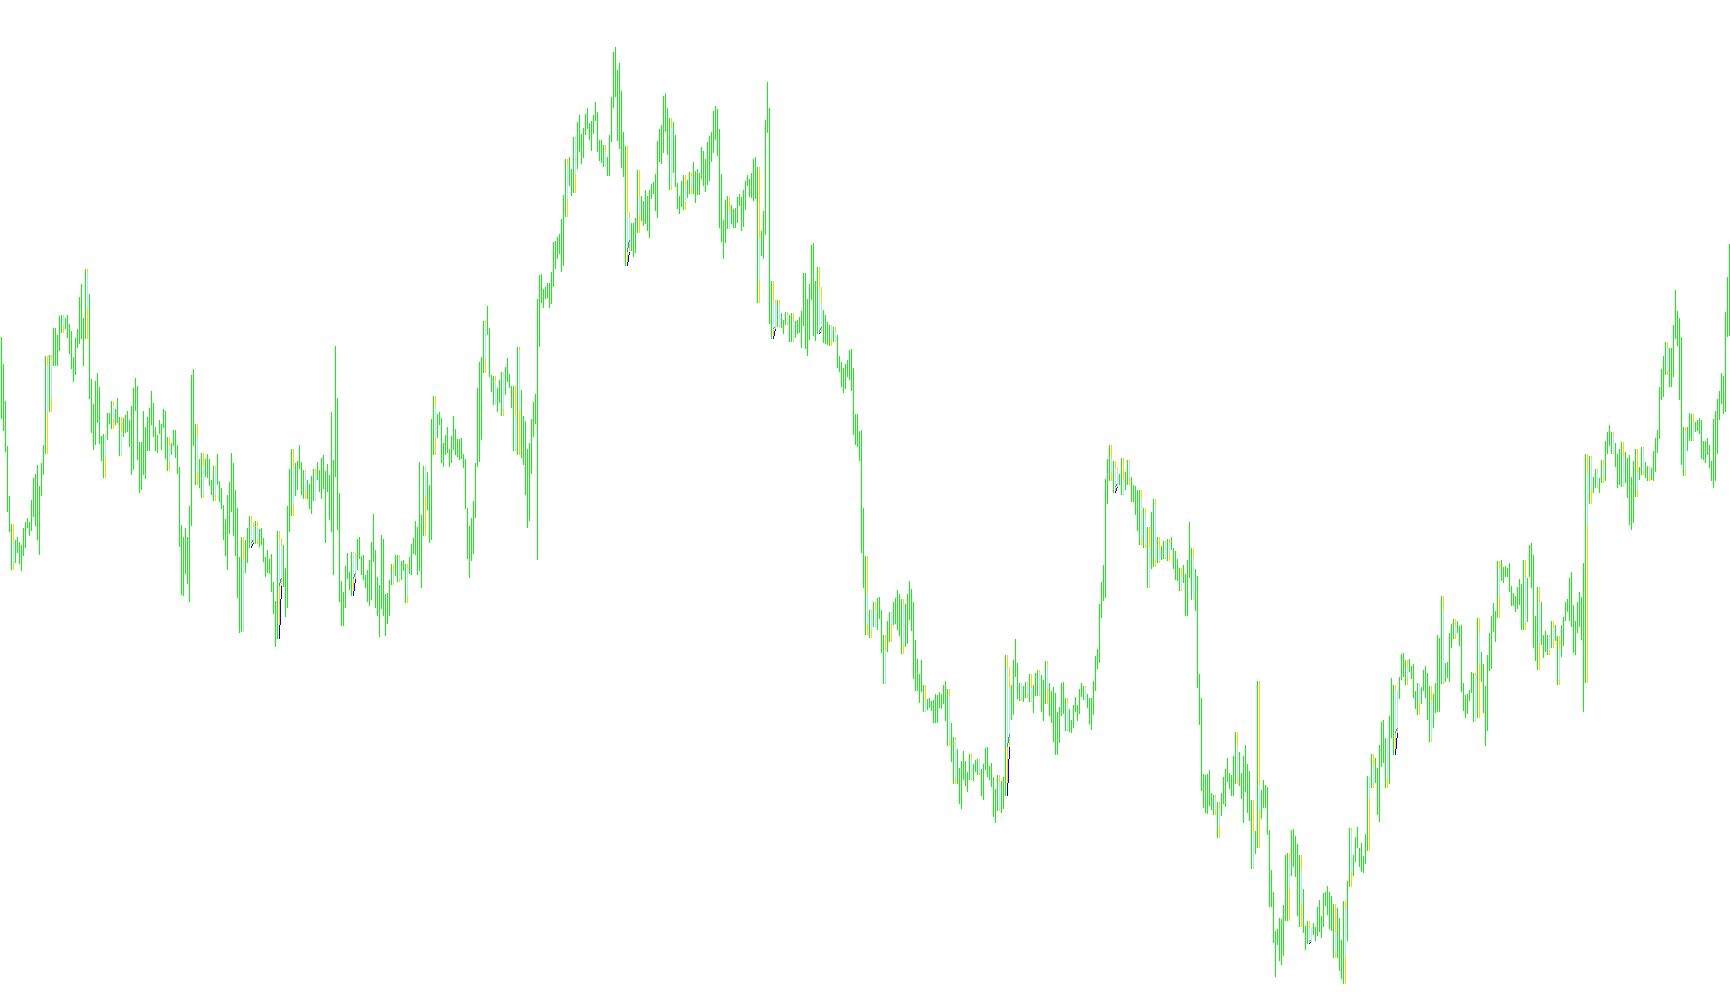
This script is designed to analyze price movements on a trading chart by identifying specific patterns related to "Inside Bars." In simple terms, it acts as a visual aid that helps traders spot moments where the current price action is contained within the range of a previous, larger price movement.
Core Functionality
The primary goal of this tool is to monitor multiple timeframes simultaneously and highlight instances where a "nested" price action occurs. It specifically looks for a situation where:
- The current bar (the most recent price activity) has a high and a low point that are both lower/higher than the highs and lows of the previous bar.
- This signifies a period of consolidation or "squeezing," where the market is trading within a previously established boundary.
Key Features and Logic
1. Multi-Timeframe Analysis The script does not just look at the candles you are currently viewing. It allows the tool to scan higher timeframes (such as 1-hour, 4-hour, or Daily charts) while you remain on a smaller timeframe (like 5-minute or 15-minute charts). This helps traders see "the bigger picture" without switching screens.
2. Dynamic Data Alignment To ensure the information is accurate, the script automatically calculates the distance between different timeframes. It adjusts the visual placement of the data so that the information aligns correctly with the current time on your chart, ensuring you aren't looking at "misplaced" historical data.
3. Visual Identification When the script detects an "Inside Bar" pattern (where a bar is completely engulfed by the one preceding it), it generates visual indicators on the chart:
- It identifies the boundaries of the previous larger bar.
- It identifies the boundaries of the current smaller bar.
Practical Use
By highlighting these specific price boundaries, the script assists traders in identifying areas of potential support and resistance. It makes it easier to see when the market is "tightening" before a possible breakout, providing a clearer visual representation of price structure than what is visible on a standard chart alone.
//+------------------------------------------------------------------+
//|                                                    DOSR_Dots.mq4 |
//|                                                          Kalenzo |
//| InnBar mtf                               http://www.fxservice.eu |
//+------------------------------------------------------------------+
//mod2008 fxtsd  ki

#property copyright "Kalenzo"
#property link      "http://www.fxservice.eu"
#property indicator_buffers 4
#property indicator_color1 Maroon
#property indicator_color2 CLR_NONE
#property indicator_color3 MediumVioletRed
#property indicator_color4 CLR_NONE

#property indicator_width3 3

double val1[];
double val2[];
double val11[];
double val12[];

extern int TimeFrame =60;
extern string  TimeFrames="M1;5,15,30,60H1;240H4;1440D1;10080W1;43200MN|0-CurrTF";

#property indicator_chart_window

//+---


int init()
  {
//---

   IndicatorBuffers (4);

   SetIndexBuffer(0,val11);
   SetIndexBuffer(1,val12);
   SetIndexBuffer(2,val1);
   SetIndexBuffer(3,val2);


   SetIndexStyle(0,DRAW_HISTOGRAM);
   SetIndexStyle(2,DRAW_HISTOGRAM);

   TimeFrame=MathMax(TimeFrame,Period());
   if (TimeFrame>Period())
      {
   SetIndexShift(0,1);
   SetIndexShift(2,TimeFrame/Period()-1);
      }
   else
      {
      SetIndexShift(0,0);
      SetIndexShift(2,0);
      }

   SetIndexEmptyValue(0,EMPTY_VALUE);
   SetIndexEmptyValue(1,EMPTY_VALUE);
   SetIndexEmptyValue(2,EMPTY_VALUE);
   SetIndexEmptyValue(3,EMPTY_VALUE);


   SetIndexLabel(0,"insideBar hi lo");
   SetIndexLabel(1,"prev Bar hi lo");


   return(0);
  }
//+--

int deinit()
  {

   return(0);
  }
//+---

int start()
  {
      datetime TimeArray[];

      int i,y,limit;
      int counted_bars=IndicatorCounted();

      if(counted_bars<0) return(-1);
      if(counted_bars>0) counted_bars--;


      limit=Bars-counted_bars;
      limit=MathMax(limit,TimeFrame/Period());

      ArrayCopySeries(TimeArray, MODE_TIME,Symbol(),TimeFrame);


      for( i=0, y=0; i<limit; i++)
      {
       if (Time[i]<TimeArray[y]) y++;


    double      H1 = iHigh(Symbol(),TimeFrame,y+1);
    double      L1 = iLow (Symbol(),TimeFrame,y+1);

    double      H  = iHigh(Symbol(),TimeFrame,y);
    double      L  = iLow (Symbol(),TimeFrame,y);

       if  (H1>H && L1<L)
            {
               if  (Time[i]==TimeArray[y])
                     {
                     val1[i]=H;
                     val2[i]=L;

                     val11[i]=H1;
                     val12[i]=L1;
                      }

              }

      }


//----
   return(0);
  }
//+------------------------------------------------------------------+
Comments