InstantTrendLine
Download script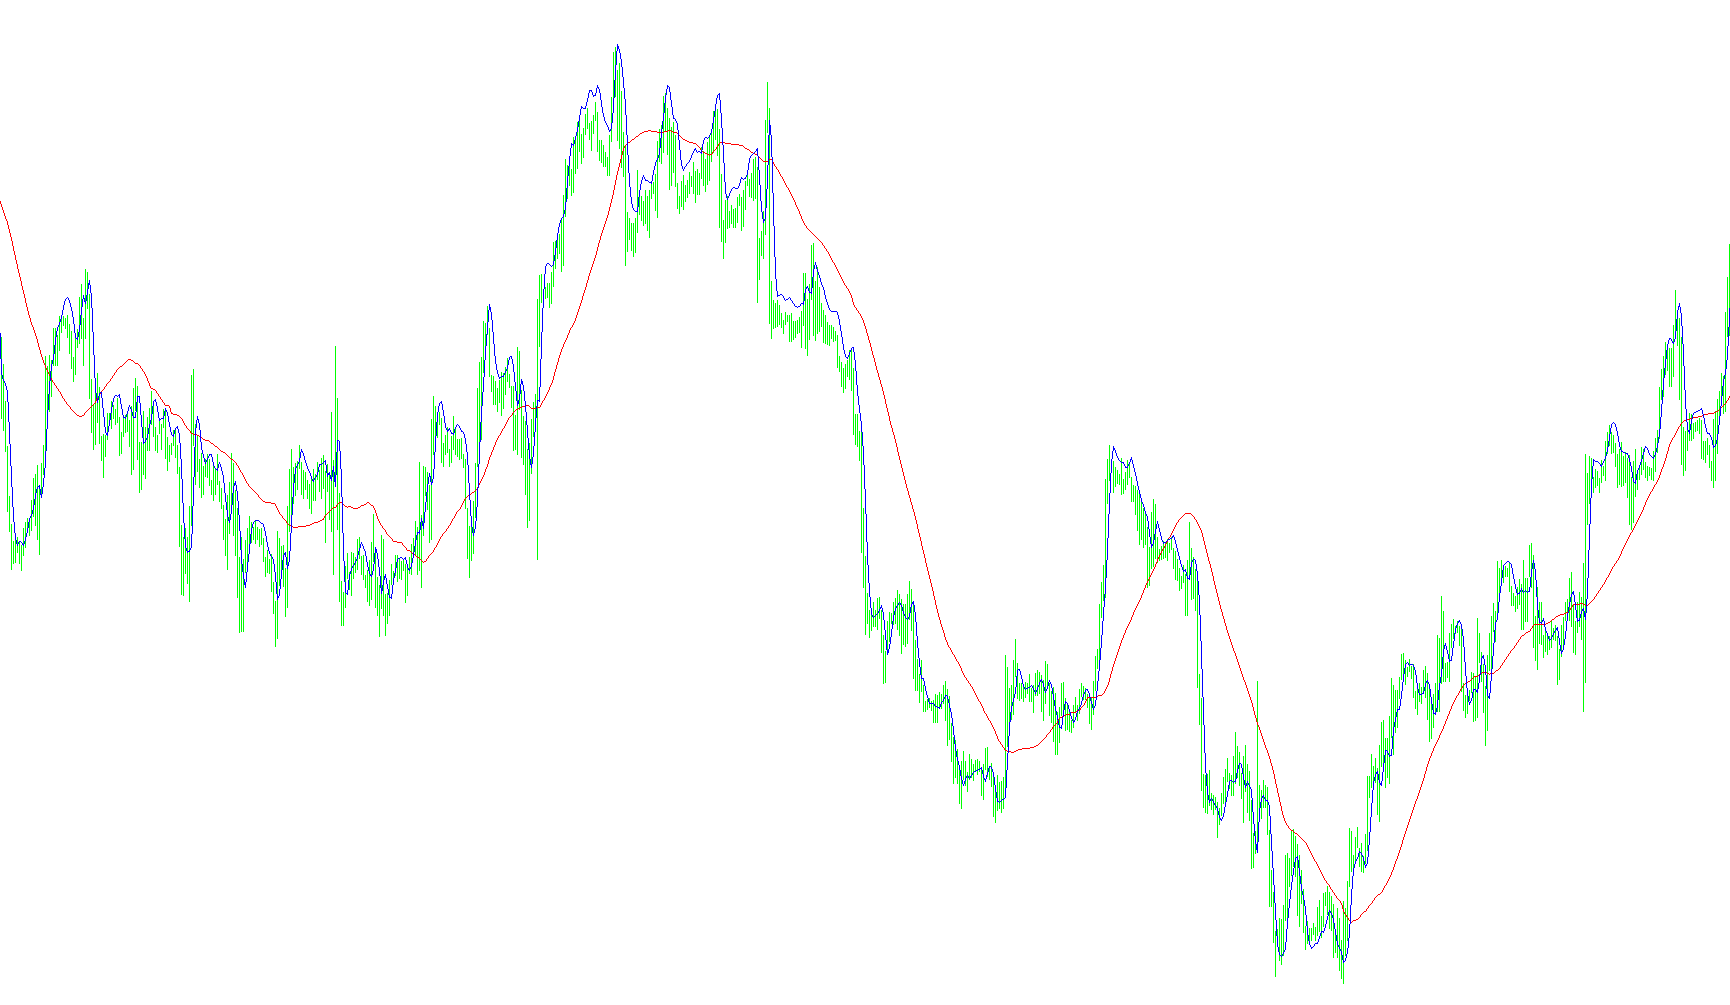
This script implements a sophisticated technical analysis tool designed to identify and visualize market trends by calculating the "instantaneous" cycle of price movements. Unlike standard moving averages that use a fixed time frame (like a 20-day or 50-day average), this logic dynamically adjusts itself based on the current behavior of the market.
Core Logic Overview
The primary goal of this tool is to determine how fast the market is currently cycling or trending and then calculate a trend line based specifically on that observed speed. It breaks down the process into four main conceptual stages:
1. Signal Processing (Phase Analysis) The script begins by treating price movement as a complex wave rather than just a sequence of numbers. It extracts the "In-Phase" and "Quadrature" components of the market's movement. By analyzing these components, it can determine the current "phase"—essentially identifying where the market currently sits within its natural cycle (e.g., whether it is peaking, bottoming, or transitioning).
2. Instantaneous Period Detection Once the phase is identified, the script measures the "Delta Phase," which is the change in the market's cycle from one moment to the next. It then performs a unique calculation: it looks backward through recent price data to see how long it takes for the market to complete a full 360-degree cycle. This result is the "Instantaneous Period." Because it calculates this constantly, the tool knows if the market is moving in a fast, volatile cycle or a slow, steady one.
3. Dynamic Trendline Calculation After determining the current dominant cycle period, the script creates a trend line. Instead of using a permanent setting, it takes the average price over the specific number of bars identified in the previous step. If the market cycle is currently fast, the trend line becomes more responsive; if the market cycle slows down, the trend line automatically broadens its focus to capture the larger move.
4. Smoothing and Output To ensure the visual data isn't too erratic for a human trader to read, the script applies smoothing filters to both the period detection and the final price values. The output provides two distinct visual elements:
- The Trendline: A representation of the dominant market direction based on the current cycle length.
- The Zero-Line Reference: A secondary smoothed price component used to help identify equilibrium points or significant shifts in momentum.
Summary for the User
In simple terms, this script "listens" to the heartbeat of the market. It figures out how fast that heartbeat is currently beating and then draws a trend line that matches that specific rhythm. This allows it to adapt to changing market conditions more fluidly than traditional indicators, which remain static regardless of whether the market is moving quickly or slowly.
//+------------------------------------------------------------------+
//|                          Instantaneous Trend Line by John Ehlers |
//|                               Copyright © 2004, Poul_Trade_Forum |
//|                                                         Aborigen |
//|                                          http://forex.kbpauk.ru/ |
//+------------------------------------------------------------------+
#property copyright "Poul Trade Forum"
#property link      "http://forex.kbpauk.ru/"
#property indicator_separate_window
#property indicator_buffers 2
#property indicator_color1 Red
#property indicator_color2 Blue

//---- buffers
double TRBuffer[];
double ZLBuffer[];
double Value1[],Value2,Value3,Value4,Value5[2],Value11[2];
double Price[],InPhase[2],Quadrature[2],Phase[2],DeltaPhase[],InstPeriod[2],Period_,Trendline;
double test[];

//+------------------------------------------------------------------+
//| Custom indicator initialization function                         |
//+------------------------------------------------------------------+
int init()
  {
   string short_name;

   IndicatorBuffers(5);
//---- indicator line
   SetIndexStyle(0,DRAW_LINE,EMPTY,1,Red);
   SetIndexStyle(1,DRAW_LINE,EMPTY,1,Blue);

   SetIndexBuffer(0,TRBuffer);
   SetIndexBuffer(1,ZLBuffer);
   SetIndexBuffer(2,Value1);
   SetIndexBuffer(3,Price);
   SetIndexBuffer(4,DeltaPhase);


   SetIndexEmptyValue(0,0);
   SetIndexEmptyValue(1,0);

//---- name for DataWindow and indicator subwindow label
   short_name="Instantaneous Trend";
   IndicatorShortName(short_name);
   SetIndexLabel(0,short_name);

//----
   SetIndexDrawBegin(0,30);
   SetIndexDrawBegin(1,30);
//----


   return(0);
  }
//+------------------------------------------------------------------+
//| Custor indicator deinitialization function                       |
//+------------------------------------------------------------------+
int deinit()
  {
//---- TODO: add your code here

//----
   return(0);
  }
//+------------------------------------------------------------------+
//| Custom indicator iteration function                              |
//+------------------------------------------------------------------+
int start()
  {
   int    counted_bars=IndicatorCounted(),i,shift,count;


//---- TODO: add your code here
if (counted_bars==0) counted_bars=100;

i=(Bars-counted_bars)-2;

for (shift=i; shift>=0;shift--)
{

InPhase[1] =InPhase[0]; Quadrature[1] =Quadrature[0];
Phase[1]=Phase[0]; InstPeriod[1] = InstPeriod[0];
Value5[1] =Value5[0];Value11[1] =Value11[0];

Price[shift]=(High[shift+1]+Low[shift+1])/2;

//  {Compute InPhase and Quadrature components}
   Value1[shift] = Price[shift] - Price[shift+6];
   Value2 =Value1[shift+3];
   Value3 =0.75*(Value1[shift] - Value1[shift+6]) + 0.25*(Value1[shift+2] - Value1[shift+4]);
   InPhase[0] = 0.33*Value2 + 0.67*InPhase[1];
   Quadrature[0] = 0.2*Value3 + 0.8*Quadrature[1];

//   {Use ArcTangent to compute the current phase}
if (MathAbs(InPhase[0]+InPhase[1])>0) Phase[0]=MathArctan(MathAbs((Quadrature[0]+Quadrature[1])/(InPhase[0]+InPhase[1])));

//   {Resolve the ArcTangent ambiguity}
   if (InPhase[0] < 0 && Quadrature[0] > 0)  Phase[0] = 180 - Phase[0];
   if (InPhase[0] < 0 && Quadrature[0] < 0)  Phase[0] = 180 + Phase[0];
   if (InPhase[0] > 0 && Quadrature[0] < 0)  Phase[0] = 360 - Phase[0];

//   {Compute a differential    phase, resolve phase wraparound, and limit delta phase errors}
   DeltaPhase[shift] = Phase[1] - Phase[0];

   if (Phase[1] < 90 &&  Phase[0] > 270) DeltaPhase[shift] = 360 + Phase[1] - Phase[0];
   if (DeltaPhase[shift] < 1)  DeltaPhase[shift] = 1;
   if (DeltaPhase[shift] > 60) DeltaPhase[shift] = 60;

//   {Sum DeltaPhases  to reach 360  degrees. The sum is the instantaneous period.}
   InstPeriod[0] = 0;
   Value4 = 0;
   for (count = 0;count<=40;count++)
      {
       Value4 = Value4 + DeltaPhase[shift+count];
       if  (Value4 > 360 && InstPeriod[0]  == 0) InstPeriod[0] = count;
     }

//   {Resolve Instantaneous  Period    errors and  smooth}
   if (InstPeriod[0] == 0) InstPeriod[0] = InstPeriod[1];
   Value5[0] = 0.25*(InstPeriod[0]) + 0.75*Value5[1];

//   {Compute Trendline as simple average over the measured dominant cycle period}
   Period_ = MathCeil(Value5[0]); Trendline = 0;///Period_ = IntPortion(Value5)

   for    (count = 0;count<=Period_ + 1;count++)
       { Trendline = Trendline + Price[shift+count]; }


   if (Period_ > 0) Trendline = Trendline    / (Period_  + 2);
   Value11[0] = 0.33*(Price[shift] + 0.5*(Price[shift] - Price[shift+3])) + 0.67*Value11[1];

   TRBuffer[shift]=Trendline;
   ZLBuffer[shift]=Value11[0];


//----

}

   return(0);
  }
//+------------------------------------------------------------------+
Comments