InnOutBar_mtf
Download script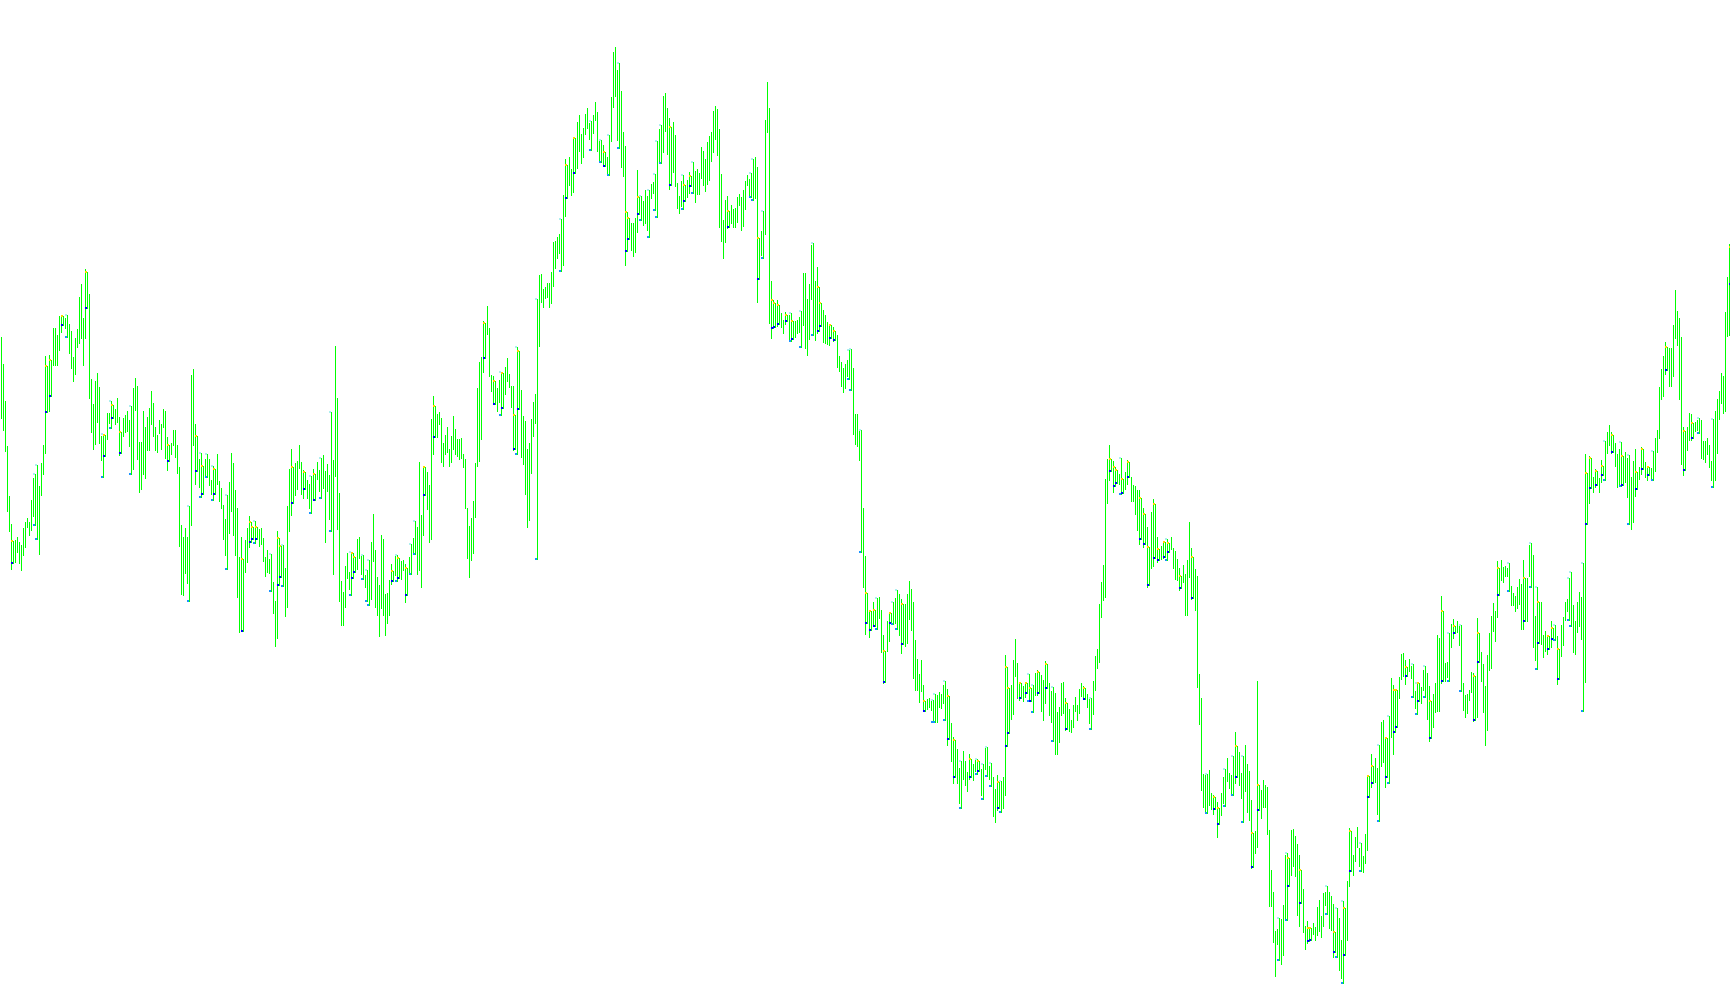
The DOSR_Dots script is a visual trading tool designed to identify specific structural shifts in price movement by comparing the highs and lows of candlesticks across different timeframes. Its primary purpose is to highlight "engulfing" actions—where the current price action completely encompasses or breaks out of the previous price range.
Core Logic Overview
The indicator works by analyzing the relationship between two consecutive bars on a higher timeframe (which you can customize, such as the 1-hour chart) and projecting those signals onto your current viewing screen. It looks for two specific types of price behavior:
1. Interior Envelopes (In High / In Low)
The script detects instances where the current price bar has expanded significantly compared to the previous one in a "neutral" or overlapping fashion. Specifically, it identifies scenarios where:
- The previous high was higher than the current high.
- The previous low was lower than the current low.
When this occurs, the script places dots on the chart to signal that the price is currently contained within a broader range established by the preceding candle.
2. Exterior Breakouts (Out High / Out Low)
Conversely, the script identifies aggressive "breakout" behavior. It looks for moments where the current candle moves completely outside the boundaries of the previous candle:
- The current high is higher than the previous high.
- The current low is lower than the previous low.
When these conditions are met, the indicator places distinct dots to highlight that the price has successfully "broken out" of the prior structure.
Key Features for the User
- Multi-Timeframe Awareness: The logic allows you to monitor higher timeframe trends while staying on a lower timeframe chart. This helps in identifying significant structural changes that might be missed on smaller scales.
- Visual Signaling: Instead of complex lines or messy drawings, the script uses clean dots (dots/arrows) to provide immediate visual cues. This allows traders to see at a glance where significant price expansion or contraction has occurred.
- Customizable Sensitivity: Through the timeframe setting, users can adjust which "higher" context they want the script to monitor, making it adaptable to different trading styles—from scalping to long-term swing trading.
//+------------------------------------------------------------------+
//|                                                    DOSR_Dots.mq4 |
//|                                                          Kalenzo |
//|                                          http://www.fxservice.eu |
//+------------------------------------------------------------------+
//mod InnOutBar mtf
#property copyright "Kalenzo"
#property link      "http://www.fxservice.eu"
#property indicator_buffers 4
#property indicator_color1 Magenta
#property indicator_color2 MediumVioletRed
#property indicator_color3 DodgerBlue
#property indicator_color4 RoyalBlue
#property indicator_width1 2
#property indicator_width2 2
#property indicator_width3 2
#property indicator_width4 2


double val1[];
double val2[];
double val3[];
double val4[];

extern int tf=60;
#property indicator_chart_window
//+------------------------------------------------------------------+
//| Custom indicator initialization function                         |
//+------------------------------------------------------------------+
int init()
  {
//---- indicators

   SetIndexBuffer(0,val1);
   SetIndexBuffer(1,val2);
   SetIndexBuffer(2,val3);
   SetIndexBuffer(3,val4);

   SetIndexStyle(0,DRAW_ARROW);
   SetIndexStyle(1,DRAW_ARROW);
   SetIndexStyle(2,DRAW_ARROW);
   SetIndexStyle(3,DRAW_ARROW);

   SetIndexArrow(0,158);
   SetIndexArrow(1,158);
   SetIndexArrow(2,158);
   SetIndexArrow(3,158);

   SetIndexEmptyValue(0,EMPTY_VALUE);
   SetIndexEmptyValue(1,EMPTY_VALUE);
   SetIndexEmptyValue(2,EMPTY_VALUE);
   SetIndexEmptyValue(3,EMPTY_VALUE);

   SetIndexLabel(0,"in hi");
   SetIndexLabel(1,"in lo");
   SetIndexLabel(2,"out hi");
   SetIndexLabel(3,"out lo");


//----
   return(0);
  }
//+------------------------------------------------------------------+
//| Custom indicator deinitialization function                       |
//+------------------------------------------------------------------+
int deinit()
  {
//----

//----
   return(0);
  }
//+------------------------------------------------------------------+
//| Custom indicator iteration function                              |
//+------------------------------------------------------------------+
int start()
  {
      int limit;
      int counted_bars=IndicatorCounted();
      if(counted_bars<0) return(-1);
      if(counted_bars>0) counted_bars--;
      limit=Bars-counted_bars+(tf/Period());

      for(int i=0; i<limit; i++)
      {
         int bs = iBarShift(Symbol(),tf,Time[i]);

         double H1 = iHigh(Symbol(),tf,bs+1);
         double L1 = iLow(Symbol(),tf,bs+1);

         double H = iHigh(Symbol(),tf,bs);
         double L = iLow(Symbol(),tf,bs);

             if ((H1>H)&&(L1<L))
              {
               val1[i]=H; val2[i]=L;
              }
             if ((H1<H)&&(L1>L))
               {
               val3[i]=H; val4[i]=L;
               }


      }


//----
   return(0);
  }
//+------------------------------------------------------------------+
Comments