InstantTrendLine_v1
Download script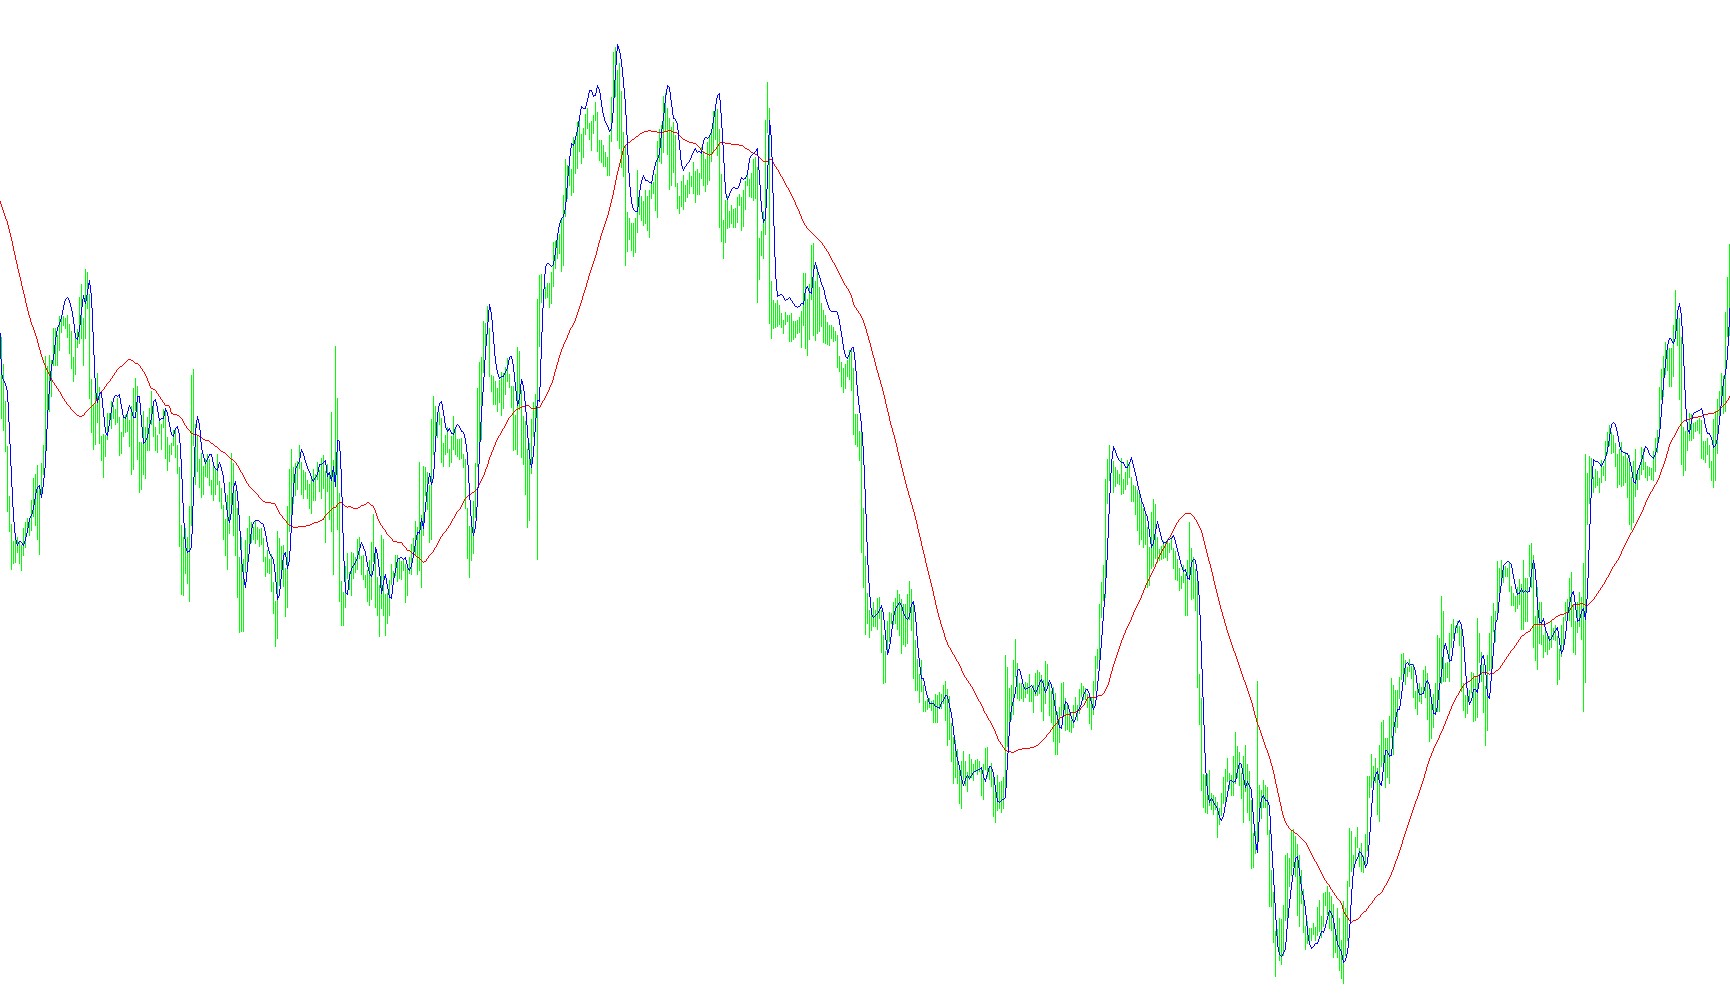
This tool is designed to identify and visualize market trends by analyzing the underlying cycles of price movement. Rather than simply looking at whether the price is going up or down in a vacuum, it attempts to calculate the "heartbeat" of the market—the natural frequency at which prices fluctuate.
How the Logic Works
1. Price Smoothing & Data Input The script begins by establishing a consistent baseline for price action. It uses the midpoint between the high and low prices of each candle to filter out minor "noise," ensuring that the analysis focuses on the primary movement of the market.
2. Cycle and Phase Analysis To understand the trend, the tool breaks down the price movements into mathematical components (InPhase and Quadrature). By comparing current price data against historical data points, it calculates a "Phase"—essentially determining where the market currently sits within its natural cycle. It then measures the change in this phase from one moment to the next to determine how quickly the market is rotating or oscillating.
3. Identifying the Instantaneous Period The core intelligence of this script lies in its ability to calculate the "Instantaneous Period." Instead of assuming that a market cycle always lasts for a fixed amount of time (e.g., always 20 bars), the logic constantly scans the recent history to see how long it takes for the price phase to complete a full rotation. It then smooths this data to provide a fluid, evolving estimate of the dominant cycle length at any given second.
4. Trendline Generation Once the tool knows the current dominant cycle period (how long the "wave" is), it calculates the trendline. It does this by taking a simple average of the price over that specific discovered period. This allows the resulting line to adapt dynamically: if the market cycle slows down, the trendline adjusts its calculation accordingly; if the cycle speeds up, the trendline reacts to that new pace.
5. Visual Output The script produces two distinct visual lines in a separate window:
- The Primary Trendline: A representation of the smoothed price based on the automatically detected cycle length.
- A Secondary Smoothing Line: A secondary calculation that helps provide context to the primary trend, allowing users to observe the relationship between immediate price action and the broader cyclical trend.
Summary for the User
In short, this script does not rely on fixed settings. It "listens" to the market to determine how fast it is currently moving in cycles and then draws a trendline that corresponds to that specific speed. This makes it highly adaptive to different market conditions, as it changes its own internal math based on the current behavior of the price.
/*-----------------------------+
|			       |
| Shared by www.Aptrafx.com    |
|			       |
+------------------------------*/

//+------------------------------------------------------------------+
//|                          Instantaneous Trend Line by John Ehlers |
//|                               Copyright © 2004, Poul_Trade_Forum |
//|                                                         Aborigen |
//|                                          http://forex.kbpauk.ru/ |
//+------------------------------------------------------------------+
#property copyright "Poul Trade Forum"
#property link      "http://forex.kbpauk.ru/"
#property indicator_separate_window
#property indicator_buffers 2
#property indicator_color1 Red
#property indicator_color2 Blue

//---- buffers
double TRBuffer[];
double ZLBuffer[];
double Value1[],Value2,Value3,Value4,Value5[2],Value11[2];
double Price[],InPhase[2],Quadrature[2],Phase[2],DeltaPhase[],InstPeriod[2],Period_,Trendline;
double test[];

//+------------------------------------------------------------------+
//| Custom indicator initialization function                         |
//+------------------------------------------------------------------+
int init()
  {
   string short_name;

   IndicatorBuffers(5);
//---- indicator line
   SetIndexStyle(0,DRAW_LINE,EMPTY,1,Red);
   SetIndexStyle(1,DRAW_LINE,EMPTY,1,Blue);

   SetIndexBuffer(0,TRBuffer);
   SetIndexBuffer(1,ZLBuffer);
   SetIndexBuffer(2,Value1);
   SetIndexBuffer(3,Price);
   SetIndexBuffer(4,DeltaPhase);


   SetIndexEmptyValue(0,0);
   SetIndexEmptyValue(1,0);

//---- name for DataWindow and indicator subwindow label
   short_name="Instantaneous Trend";
   IndicatorShortName(short_name);
   SetIndexLabel(0,short_name);

//----
   SetIndexDrawBegin(0,30);
   SetIndexDrawBegin(1,30);
//----


   return(0);
  }
//+------------------------------------------------------------------+
//| Custor indicator deinitialization function                       |
//+------------------------------------------------------------------+
int deinit()
  {
//---- TODO: add your code here

//----
   return(0);
  }
//+------------------------------------------------------------------+
//| Custom indicator iteration function                              |
//+------------------------------------------------------------------+
int start()
  {
   int    counted_bars=IndicatorCounted(),i,shift,count;


//---- TODO: add your code here
if (counted_bars==0) counted_bars=100;

i=(Bars-counted_bars)-2;

for (shift=i; shift>=0;shift--)
{

InPhase[1] =InPhase[0]; Quadrature[1] =Quadrature[0];
Phase[1]=Phase[0]; InstPeriod[1] = InstPeriod[0];
Value5[1] =Value5[0];Value11[1] =Value11[0];

Price[shift]=(High[shift+1]+Low[shift+1])/2;

//  {Compute InPhase and Quadrature components}
   Value1[shift] = Price[shift] - Price[shift+6];
   Value2 =Value1[shift+3];
   Value3 =0.75*(Value1[shift] - Value1[shift+6]) + 0.25*(Value1[shift+2] - Value1[shift+4]);
   InPhase[0] = 0.33*Value2 + 0.67*InPhase[1];
   Quadrature[0] = 0.2*Value3 + 0.8*Quadrature[1];

//   {Use ArcTangent to compute the current phase}
if (MathAbs(InPhase[0]+InPhase[1])>0) Phase[0]=MathArctan(MathAbs((Quadrature[0]+Quadrature[1])/(InPhase[0]+InPhase[1])));

//   {Resolve the ArcTangent ambiguity}
   if (InPhase[0] < 0 && Quadrature[0] > 0)  Phase[0] = 180 - Phase[0];
   if (InPhase[0] < 0 && Quadrature[0] < 0)  Phase[0] = 180 + Phase[0];
   if (InPhase[0] > 0 && Quadrature[0] < 0)  Phase[0] = 360 - Phase[0];

//   {Compute a differential    phase, resolve phase wraparound, and limit delta phase errors}
   DeltaPhase[shift] = Phase[1] - Phase[0];

   if (Phase[1] < 90 &&  Phase[0] > 270) DeltaPhase[shift] = 360 + Phase[1] - Phase[0];
   if (DeltaPhase[shift] < 1)  DeltaPhase[shift] = 1;
   if (DeltaPhase[shift] > 60) DeltaPhase[shift] = 60;

//   {Sum DeltaPhases  to reach 360  degrees. The sum is the instantaneous period.}
   InstPeriod[0] = 0;
   Value4 = 0;
   for (count = 0;count<=40;count++)
      {
       Value4 = Value4 + DeltaPhase[shift+count];
       if  (Value4 > 360 && InstPeriod[0]  == 0) InstPeriod[0] = count;
     }

//   {Resolve Instantaneous  Period    errors and  smooth}
   if (InstPeriod[0] == 0) InstPeriod[0] = InstPeriod[1];
   Value5[0] = 0.25*(InstPeriod[0]) + 0.75*Value5[1];

//   {Compute Trendline as simple average over the measured dominant cycle period}
   Period_ = MathCeil(Value5[0]); Trendline = 0;///Period_ = IntPortion(Value5)

   for    (count = 0;count<=Period_ + 1;count++)
       { Trendline = Trendline + Price[shift+count]; }


   if (Period_ > 0) Trendline = Trendline    / (Period_  + 2);
   Value11[0] = 0.33*(Price[shift] + 0.5*(Price[shift] - Price[shift+3])) + 0.67*Value11[1];

   TRBuffer[shift]=Trendline;
   ZLBuffer[shift]=Value11[0];


//----

}

   return(0);
  }
//+------------------------------------------------------------------+
Comments