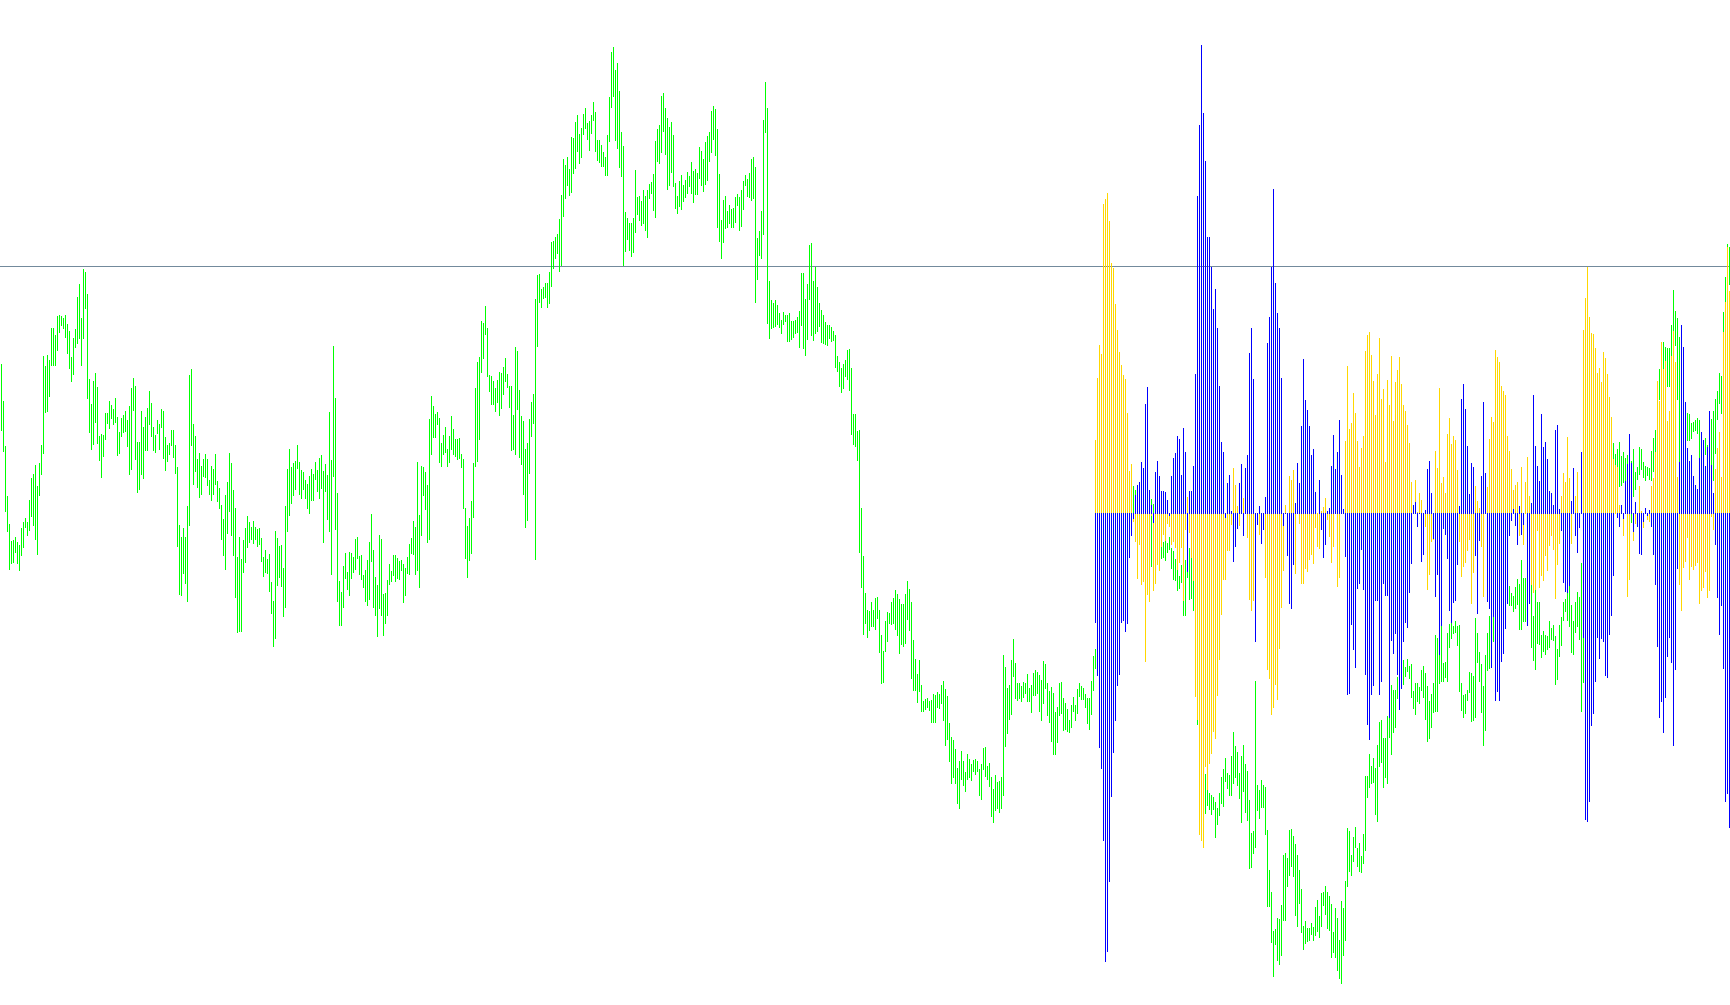
Okay, here's a breakdown of the script's logic in plain language, avoiding technical jargon and code snippets.
Overall Purpose
This script creates a custom indicator for a trading chart. An indicator is a tool that analyzes price data and displays it in a way that can help traders identify potential trading opportunities. This particular indicator aims to show a trend, potentially highlighting overbought or oversold conditions. It's designed to be visually represented as a histogram (a series of bars) on the chart.
Key Components and How They Work
-
Input Parameters (Customizable Settings):
- The script allows you to adjust several settings to tailor the indicator's behavior. These settings are like knobs you can turn to fine-tune how the indicator looks and reacts.
- Bands Mode: This determines whether the indicator focuses on the main trend, the low prices, or the high prices.
- Power Price: This setting chooses which price data (open, high, low, close, etc.) is used in calculations.
- Price Type: This setting determines which price is used for the main calculations.
- Bands Period: This controls how many past data points are considered when calculating the trend. A higher period means the indicator will be less sensitive to short-term price fluctuations.
- Bands Deviation: This setting adjusts the sensitivity of the indicator to price changes.
- Power Period: This setting controls the number of past data points used to calculate a "power" or momentum value.
- Count Bars: This determines how many bars (data points) the indicator will look back to calculate its values.
-
Initialization:
- When the indicator is first loaded or the chart settings are changed, the script performs some initial setup.
- It defines how the indicator will be displayed on the chart (as a histogram).
- It sets the name of the indicator and labels for the displayed data.
- It prepares the data area for the indicator.
-
Main Calculation (The
start()Function):- This is where the core logic of the indicator resides. It's executed repeatedly as new price data becomes available.
- Data Selection: The script first determines which price data to use based on the "Power Price" and "Price Type" settings.
- Trend Calculation: The script calculates a value that represents the trend. This calculation involves subtracting a "band" value from the selected price data. The "band" value is derived from past price data, and its calculation is influenced by the "Bands Period" and "Bands Deviation" settings.
- Power Calculation: The script calculates a "power" value, which represents the strength or momentum of the trend. This calculation uses past price data and is influenced by the "Power Period" and "Power Price" settings.
- Display: The calculated trend and power values are then displayed as a histogram on the chart.
In Simpler Terms
Imagine you're trying to understand if a stock is trending up or down. This indicator does something similar, but using mathematical formulas. It looks at past prices, calculates a trend line, and then compares the current price to that line. The difference between the current price and the trend line is what's displayed as the histogram. The "power" calculation tries to measure how strong that trend is.
Important Notes
- The specific formulas used in the trend and power calculations are complex and not explained in detail here. They are part of the underlying code.
- The indicator's effectiveness depends on the chosen settings and the specific market conditions.
- Like all indicators, this one should be used as a tool to support trading decisions, not as a guaranteed predictor of future price movements.
//+------------------------------------------------------------------+
//|                                                       iTrend.mq4 |
//|                      Copyright © 2004, MetaQuotes Software Corp. |
//|                                        http://www.metaquotes.net |
//+------------------------------------------------------------------+
#property copyright "Copyright © 2004, MetaQuotes Software Corp."
#property link      "http://www.metaquotes.net"

#property indicator_separate_window
#property indicator_buffers 2
#property indicator_color1 Blue
#property indicator_color2 Red
//---- input parameters
extern int Bands_Mode_0_2 = 0;  // =0-2 MODE_MAIN, MODE_LOW, MODE_HIGH
extern int Power_Price_0_6 = 0; // =0-6 PRICE_CLOSE,PRICE_OPEN,PRICE_HIGH,PRICE_LOW,PRICE_MEDIAN,PRICE_TYPICAL,PRICE_WEIGHTED
extern int Price_Type_0_3 = 0;  // =0-3 PRICE_CLOSE,PRICE_OPEN,PRICE_HIGH,PRICE_LOW
extern int Bands_Period = 20;
extern int Bands_Deviation = 2;
extern int Power_Period = 13;
extern int CountBars = 300;
//---- buffers
double value[];
double value2[];
//+------------------------------------------------------------------+
//| Custom indicator initialization function                         |
//+------------------------------------------------------------------+
int init()
  {
//   string short_name;
//---- indicator line
   IndicatorBuffers(2);
   SetIndexStyle(0, DRAW_HISTOGRAM);
   SetIndexStyle(1, DRAW_HISTOGRAM);
   SetIndexBuffer(0, value);
   SetIndexBuffer(1, value2);
//---- name for DataWindow and indicator subwindow label
   IndicatorShortName("iTrend (" + Bands_Period + ", " + Bands_Deviation + ")");
   SetIndexLabel(0, "iTrend1 (" + Bands_Period + ", " + Bands_Deviation + ")");
   SetIndexLabel(1, "iTrend2 (" + Bands_Period + ", " + Bands_Deviation + ")");
//----
   SetIndexDrawBegin(0, Bars - CountBars + Bands_Period + 1);
   SetIndexDrawBegin(1, Bars - CountBars + Bands_Period + 1);
//----
   return(0);
  }
//+------------------------------------------------------------------+
//| Trend                                                         |
//+------------------------------------------------------------------+
int start()
  {
   int i, CurrentBar, Bands_Mode, counted_bars = IndicatorCounted();
   double Power_Price, CurrentPrice;
//----
   if(Bars <= Bands_Period)
       return(0);
//---- initial zero
   if(counted_bars < Bands_Period)
     {
       for(i = 1; i <= Bands_Period; i++)
           value[Bars-i] = 0.0;
       for(i = 1; i <= Bands_Period; i++)
           value2[Bars-i] = 0.0;
     }
//----
   i = CountBars - Bands_Period - 1;
//   if(counted_bars>=Bands_Period) i=Bars-counted_bars-1;
   if(Bands_Mode_0_2 == 1)
       Bands_Mode = MODE_LOW;
   if(Bands_Mode_0_2 == 2)
       Bands_Mode = MODE_HIGH;
   if(Bands_Mode_0_2 == 0)
       Bands_Mode = MODE_MAIN;

   if(Power_Price_0_6 == 1)
       Power_Price = PRICE_OPEN;
   if(Power_Price_0_6 == 2)
       Power_Price = PRICE_HIGH;
   if(Power_Price_0_6 == 3)
       Power_Price = PRICE_LOW;
   if(Power_Price_0_6 == 4)
       Power_Price = PRICE_MEDIAN;
   if(Power_Price_0_6 == 5)
       Power_Price = PRICE_TYPICAL;
   if(Power_Price_0_6 == 6)
       Power_Price = PRICE_WEIGHTED;
   if(Power_Price_0_6 == 6)
       Power_Price = PRICE_CLOSE;

   for(i = CountBars - 1; i >= 0; i--)
     {
       if(Price_Type_0_3 == 1)
           CurrentPrice = Open[i];

       if(Price_Type_0_3 == 2)
           CurrentPrice = High[i];

       if(Price_Type_0_3 == 3)
           CurrentPrice = Low[i];
       if(Price_Type_0_3 == 0)
           CurrentPrice = Close[i];

       value[i] = CurrentPrice - iBands(NULL, 0, Bands_Period, Bands_Deviation,
                                        0, Bands_Mode, Power_Price, i);
       value2[i] = -(iBearsPower(NULL, 0, Power_Period, Power_Price, i) +
                     iBullsPower(NULL, 0, Power_Period, Power_Price, i));
     }
   return(0);
  }
//+------------------------------------------------------------------+
Comments