Inverse Fisher Transform of RSI_001
Download script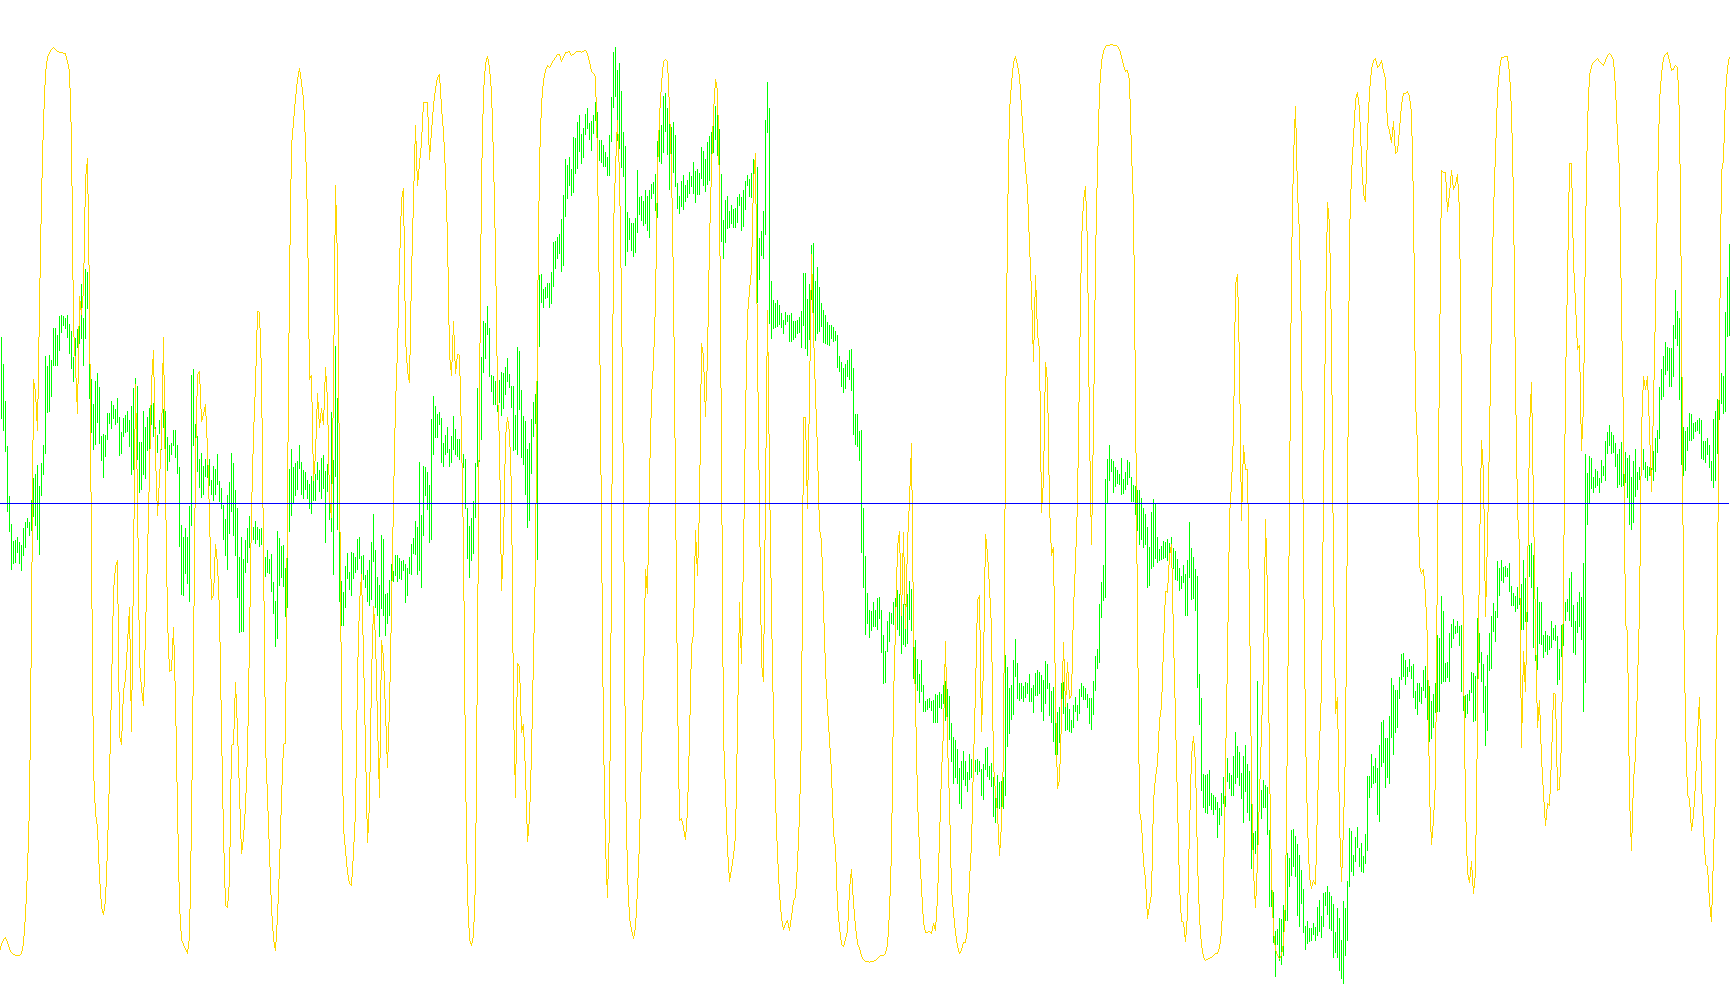
This script is a technical trading indicator designed to transform standard market momentum data into a smoothed, bounded oscillation. It takes the Relative Strength Index (RSI)—a common tool used to measure the speed and change of price movements—and applies several mathematical layers to make it more sensitive to trend shifts while remaining easy to read.
How the Logic Works
1. Data Input and Preparation The script starts by looking at historical price data, specifically the closing prices. It calculates the "Relative Strength" (the difference between consecutive closes) over a specific number of bars. This is used to determine if the market is currently trending upward or downward.
2. Custom RSI Calculation Rather than using a standard pre-built formula, the script manually calculates the RSI averages. By calculating these internally, the indicator ensures that the underlying momentum data is handled specifically for the subsequent transformations. It then "normalizes" this value, shifting it from a standard 0–100 range to a smaller scale centered around zero.
3. Smoothing via Weighted Moving Average (WMA) To remove "noise" (minor, insignificant price fluctuations) and prevent the indicator from jumping erratically, the script applies a Weighted Moving Average. Unlike a simple average where every day has equal importance, a weighted average gives more significance to recent price action. This creates a much smoother line that represents the true underlying trend of the momentum.
4. The Inverse Fisher Transform (IFish) This is the core logic of the script. The "Inverse Fisher Transform" is a mathematical technique used to take an unbounded variable (like a moving average) and convert it into a bounded value—specifically one that oscillates between -1 and 1.
- The Benefit: This makes it much easier for a trader to see when a move is reaching an extreme point. It effectively "stretches" the data near the edges, making it clearer when the market is overextended.
5. Trigger Levels Finally, the script generates a secondary visual element: a dual-value trigger line. Based on whether the transformed value is positive or negative, the script plots specific threshold levels (High and Low triggers). These serve as visual guides to help identify potential turning points in the market trend.
Summary for the User
In simple terms, this tool takes the "heartbeat" of the market (RSI), cleans up the jittery movements using a weighted average, and then mathematically compresses it into a smooth wave. This allows you to see price momentum more clearly, helping to identify whether a trend is gaining strength or becoming exhausted before it actually reverses.
//+------------------------------------------------------------------+
//|                              Inverse Fisher Transform of RSI.mq4 |
//|                                             Treberk's Conversion |
//|                                             Treberk's Conversion |
//+------------------------------------------------------------------+
#property copyright "Treberk's Conversion"
#property link      "Treberk's Conversion"

#property indicator_separate_window
#property indicator_buffers 2
#property indicator_color1 Red
#property indicator_color2 DimGray


//Inputs

 extern int  RsiBars=5; // default=5
 extern int  WmaBars=9; // default=9
 extern int  HiTrigger=0.5; // default=0.5
 extern int  LoTrigger=-0.5; // default=-0.5
 extern bool  info=0; // default=0


//---- buffers
double ExtMapBuffer1[];
double ExtMapBuffer2[];
//+------------------------------------------------------------------+
//| Custom indicator initialization function                         |
//+------------------------------------------------------------------+
int init()
  {
//---- indicators
   SetIndexStyle(0,DRAW_LINE);
   SetIndexBuffer(0,ExtMapBuffer1);
   SetIndexStyle(1,DRAW_LINE);
   SetIndexBuffer(1,ExtMapBuffer2);
//----
   return(0);
  }
//+------------------------------------------------------------------+
//| Custor indicator deinitialization function                       |
//+------------------------------------------------------------------+
int deinit()
  {
//----

//----
   return(0);
  }
//+------------------------------------------------------------------+
//| Custom indicator iteration function                              |
//+------------------------------------------------------------------+
int start()
  {
   int    counted_bars=IndicatorCounted();
//----

    // SetLoopCount(0);
//--------------------------------------------------------

//Variables: // Generic
int  shift;
int  loopBegin;
bool is_First=True;
double   prevbars;
int   count;

//Variables: // Specific
//   Name(\"InvFisher RSI\"),
double   Value2;
double    IFish;
   // for manual calc. RSI
double    SumUp;
double    SumDn;
double    AvgUp;
double    AvgDn;
double   Delta;
double   RSI;
   // for calc. WMA
double   WmaNumerator;
double   WmaDenominator;
datetime LastTime;
double   PrevAvgUp;
double   PrevAvgDn;
int      cntdown;

//Arrays:
   // for ( calc. generic WMA (weighted moving average)
   double Value1[40];


// Usage
/*[if (info ) {
   Alert(\"See Terminal>Journal Tab for ( usage of \\n\",Name);
   Print(\"|___________________\");
   Print(\"|* \",Name,\" *\");
   Print(\"|  \",\"Sell: cross under HiTrigger (or under LoTrigger if (no prior cross under  HiTrigger)\");
   Print(\"|  \",\"Buy: cross over LoTrigger (or over HiTrigger if (no prior cross over LoTrigger)\");
   Print(\"|* \",Name,\" *\");
   Print(\"|```````````````````\");
   }]*/
//--------------------------------------------------------

// Check Inputs
if (0>HiTrigger || HiTrigger>1 ) {
   Alert("Input Error:  must be 0< HiTrigger <1, Cannot=",HiTrigger);
   return(0);
}
if (-1>LoTrigger || LoTrigger>0 ) {
   Alert("Input Error:  must be -1< LoTrigger <0, Cannot=",LoTrigger);
   return(0);
}
if (0>RsiBars || RsiBars>50 ) {
   Alert("Input Error:  must be 0< RsiBars <50, Cannot=",RsiBars);
   return(0);
}
//--------------------------------------------------------

// Check for ( additional bars loading or total reloadng.
if (Bars<prevbars || Bars-prevbars>1 ) is_First=True;
prevbars=Bars;
//--------------------------------------------------------

// Pre-Loop setup
// loopbegin prevents counting of previously plotted bars excluding current Bars
if (is_First ) {
   loopBegin=Bars-1-1;// BarIndexNumber=Shift=Bars-1...0

   // Compute the initial AvgUp & AvgDn for RSI
   for ( shift=loopBegin; shift>=loopBegin-RsiBars; shift--) {
      Delta=Close[shift]-Close[shift+1];
      SumUp=SumUp+MathMax(0,Delta);
      SumDn=SumDn-MathMin(0,Delta);
   }
   AvgUp=SumUp/RsiBars;
   AvgDn=SumDn/RsiBars;
   loopBegin=loopBegin-RsiBars;
}
//--------------------------------------------------------

// loop from loopbegin to current bar (shift=0)
if (! is_First ) {
   if ((Time[0]!=LastTime) ) {
     PrevAvgUp = AvgUp;
     PrevAvgDn = AvgDn;
     AvgUp = 0;
     AvgDn = 0;
     for ( count=WmaBars-1; count>=1; count--) {
        Value1[count]=Value1[count-1];
     }
     LastTime = Time[0];
   }
} else {
  cntdown = 1;
}

for ( shift=loopBegin; shift>=cntdown; shift--) {
   // Calc RSI manually
   Delta=Close[shift]-Close[shift+1];
   if (is_First ) {
     AvgUp=((RsiBars-1)*AvgUp+MathMax(0,Delta))/RsiBars;
     AvgDn=((RsiBars-1)*AvgDn-MathMin(0,Delta))/RsiBars;
   } else {
     AvgUp=((RsiBars-1)*PrevAvgUp+MathMax(0,Delta))/RsiBars;
     AvgDn=((RsiBars-1)*PrevAvgDn-MathMin(0,Delta))/RsiBars;
   }
   RSI=100-100/(1+AvgUp/AvgDn);
   // ) scale RSI to between -5 and +5
   /* Do not use iRSI fctn because it\'s too slow
   Value1=0.1*(iRSI(RsiBars,shift)-50); */
   Value1[0]=0.1*(RSI-50);

   // Use weighted moving average to smooth Value1.
   // Ehler suggests could also use EMA, which would be simpler coding at the expense of Alpha.
   WmaNumerator=0;
   WmaDenominator=0;
   for ( count=WmaBars; count>= 1; count--) {
      WmaNumerator=WmaNumerator+count*Value1[WmaBars-count-1];
      WmaDenominator=WmaDenominator+count;
   }
   Value2=WmaNumerator/WmaDenominator;
   IFish=(MathExp(2*Value2)-1)/(MathExp(2*Value2)+1);

   ExtMapBuffer1[shift]=IFish;
//   SetIndexValue[shift]=RSI;

   // Plot dual-value Trigger Line
   if (IFish >0 )
      ExtMapBuffer2[shift]=HiTrigger;
   else
      ExtMapBuffer2[shift]=LoTrigger;
   //--------------------------------------------------------

   // Update arrays.  This technique minimizes array storage and thus allows more signal bars.
   if (is_First ) for ( count=WmaBars-1; count>= 1; count--) {
      Value1[count]=Value1[count-1];
   }
   //--------------------------------------------------------
}

is_First = False;
cntdown = 0;
loopBegin = 0;


//----
   return(0);
  }
//+------------------------------------------------------------------+
Comments