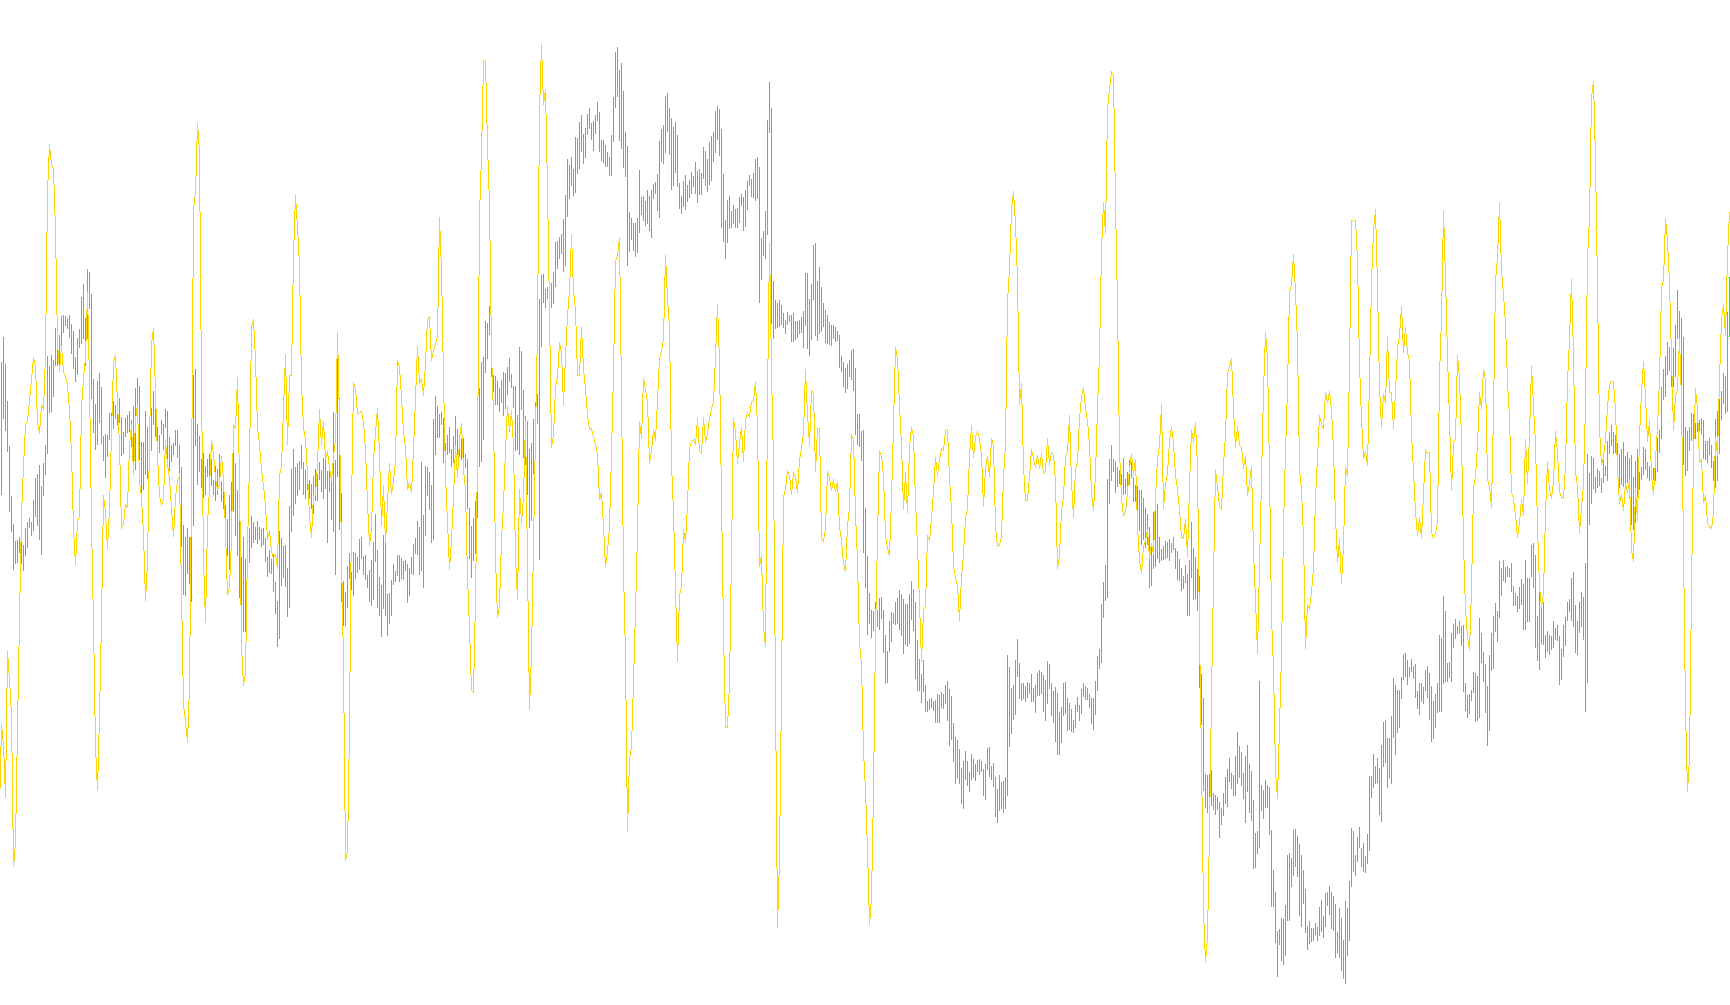
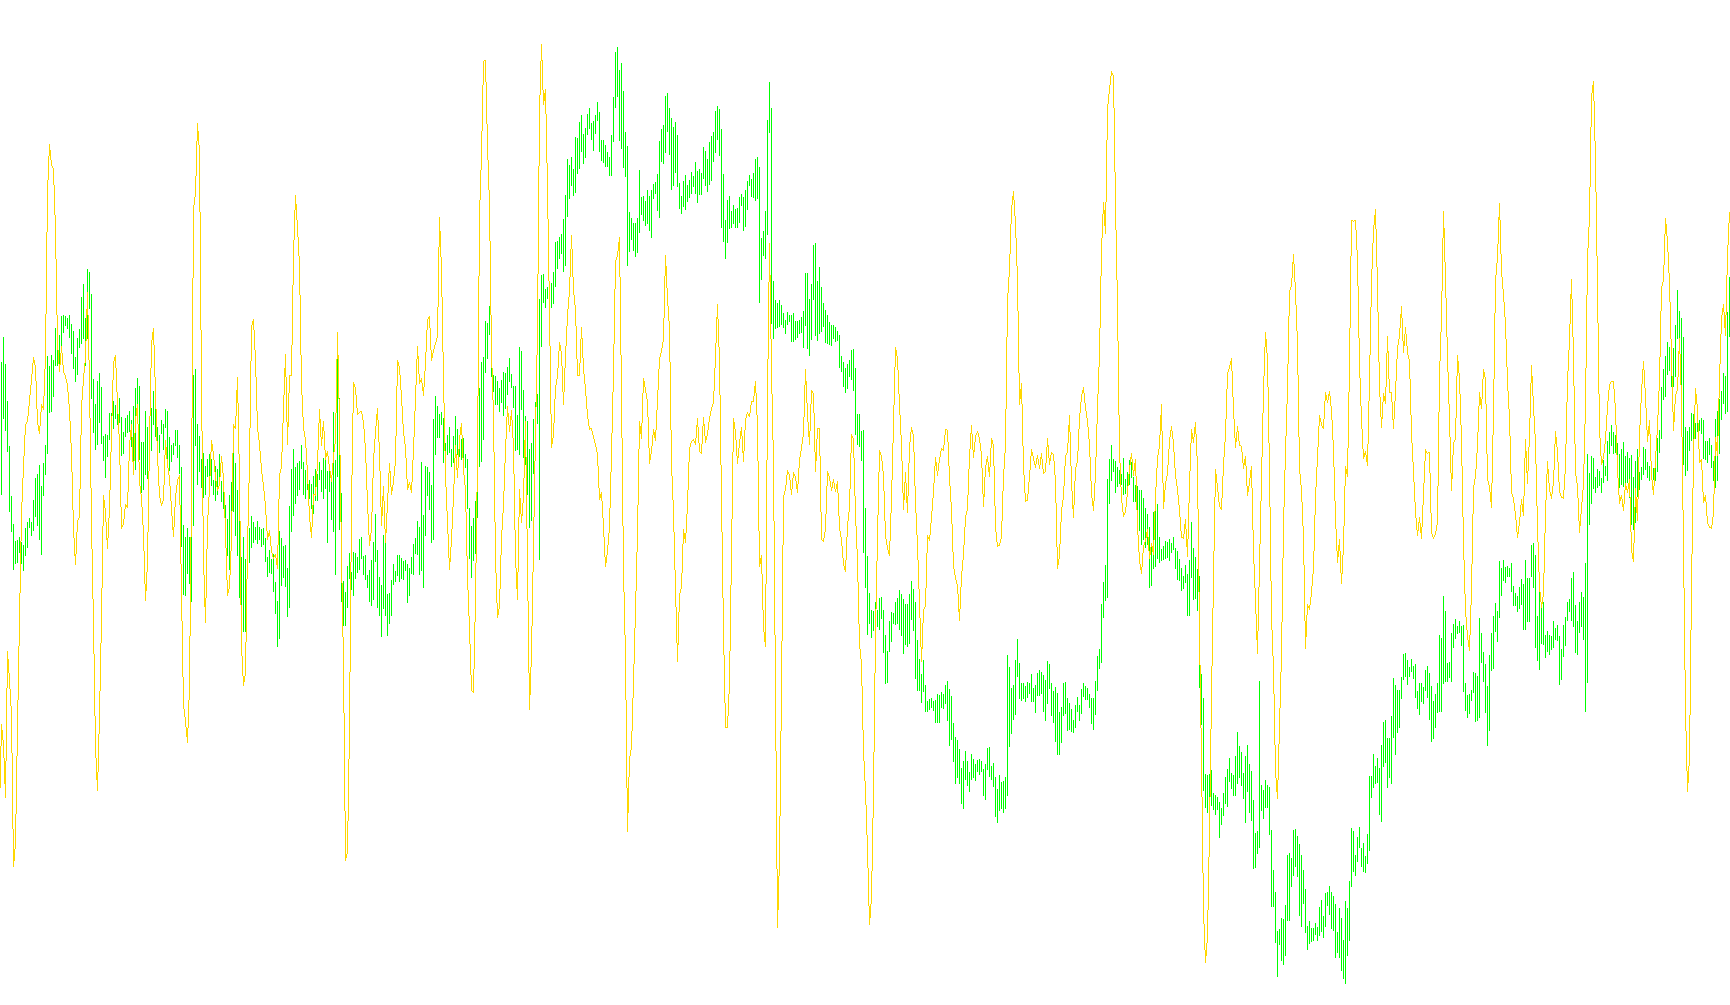
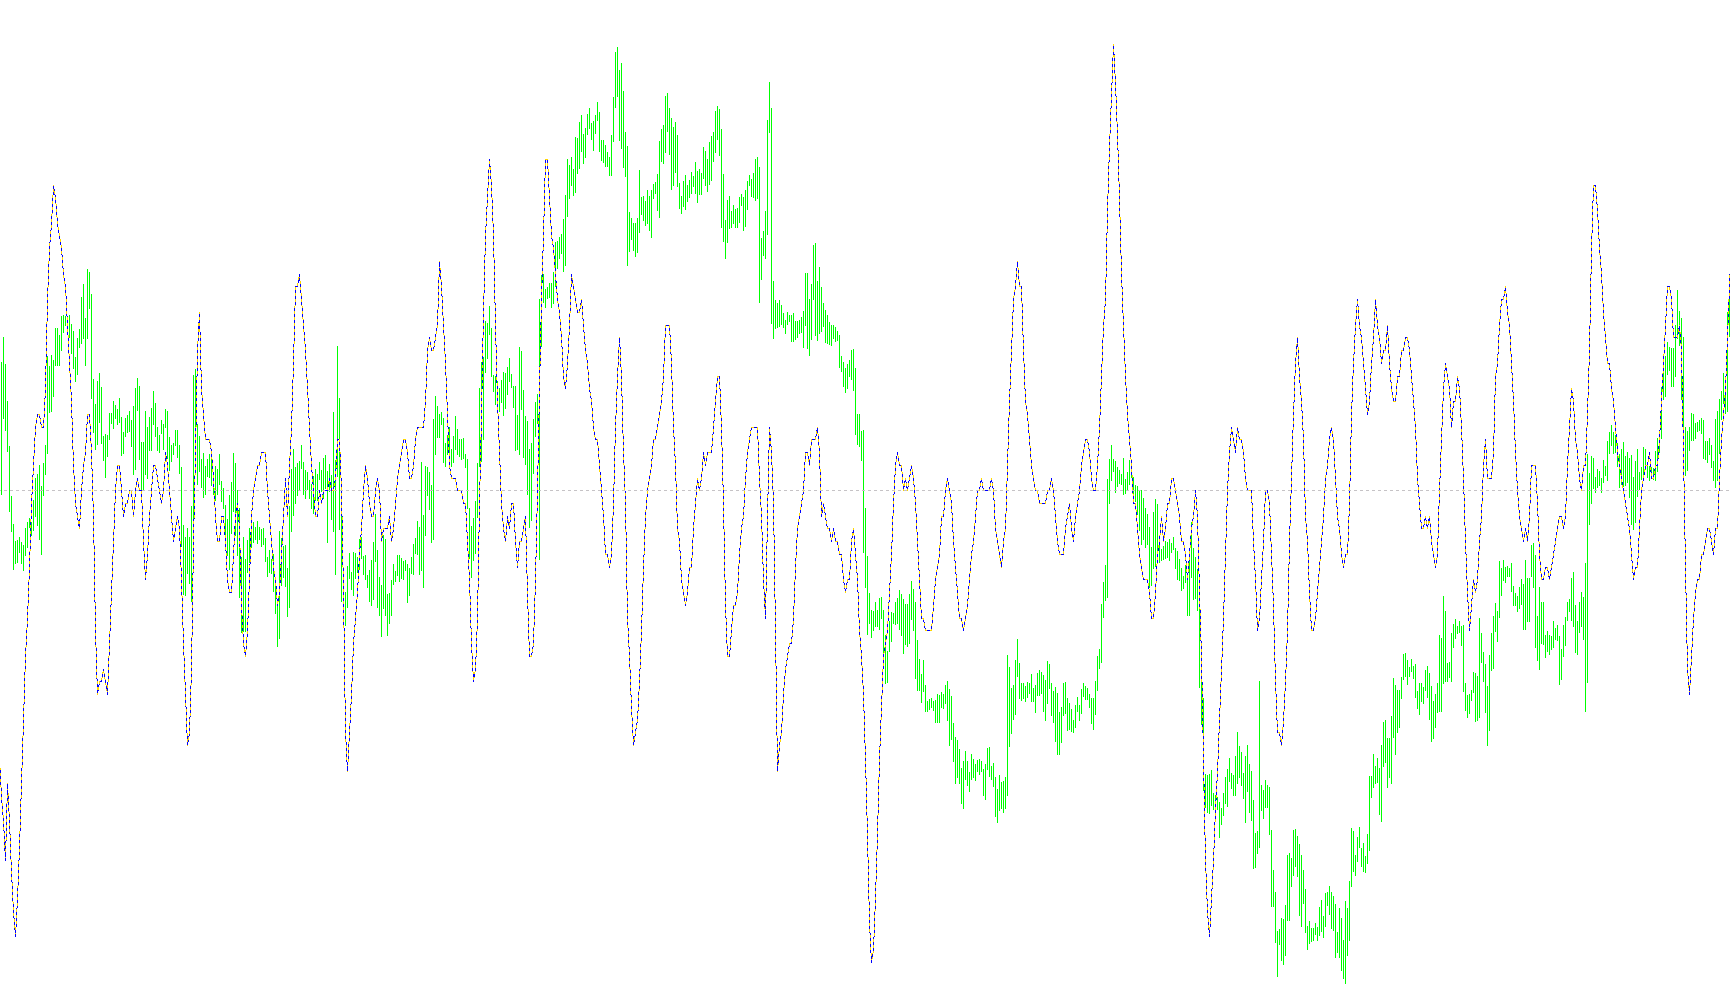
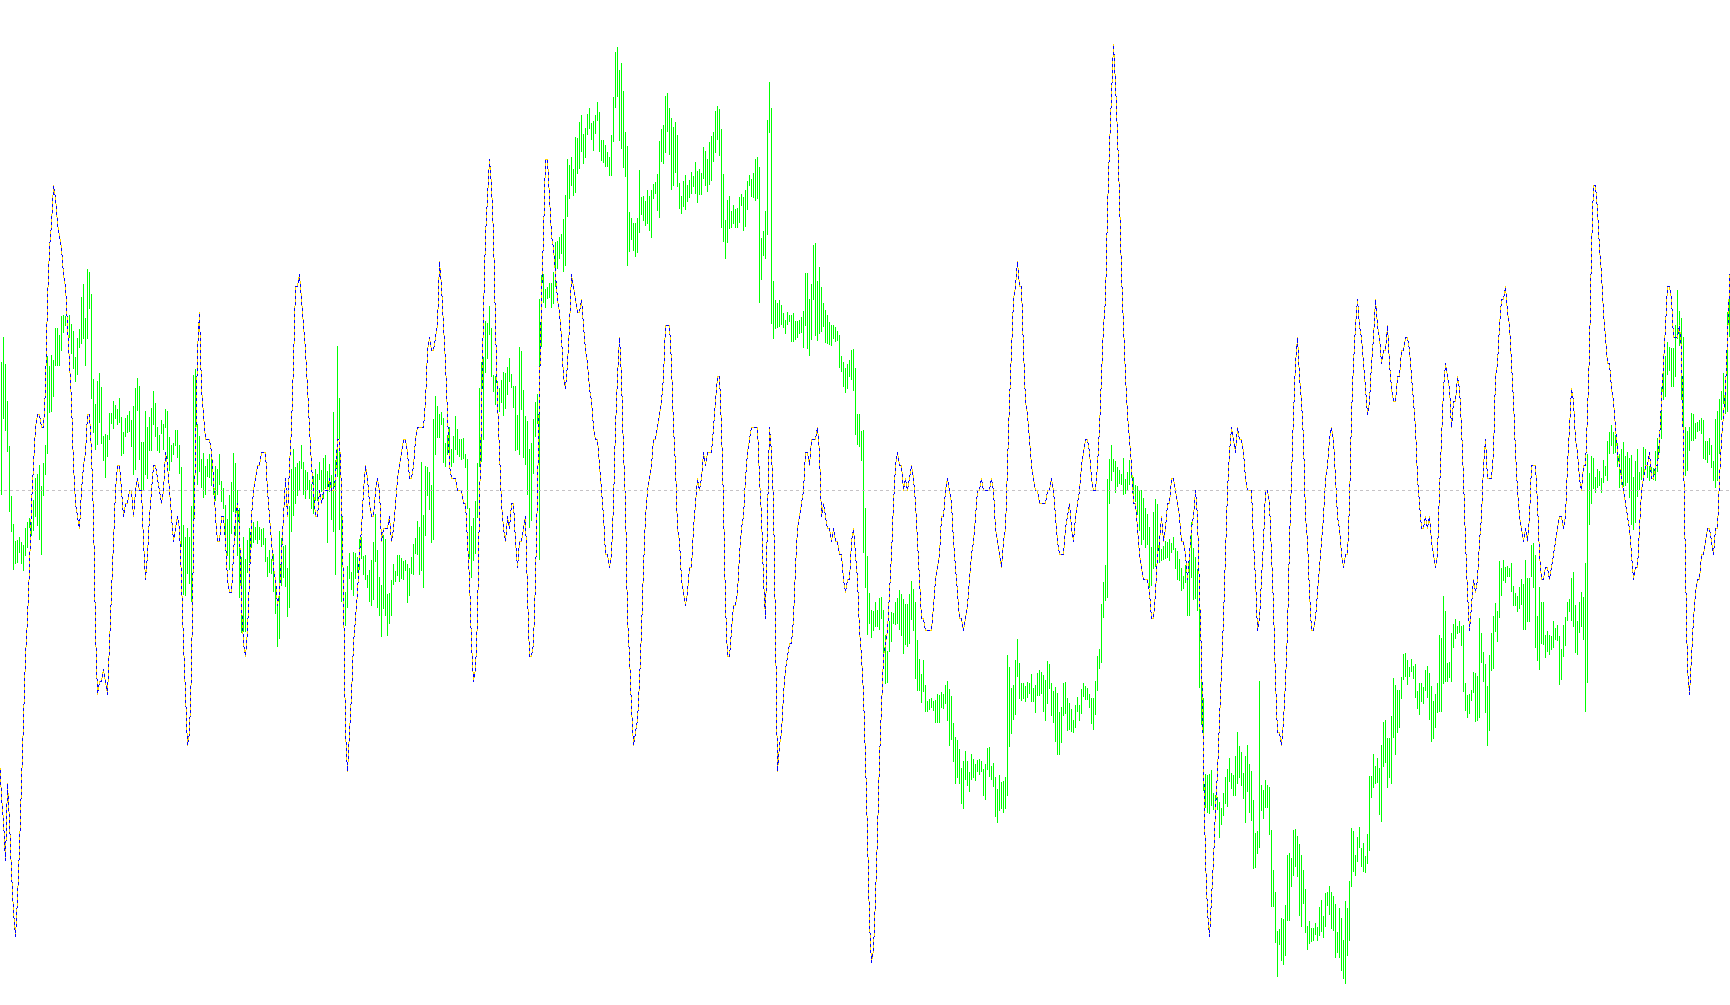
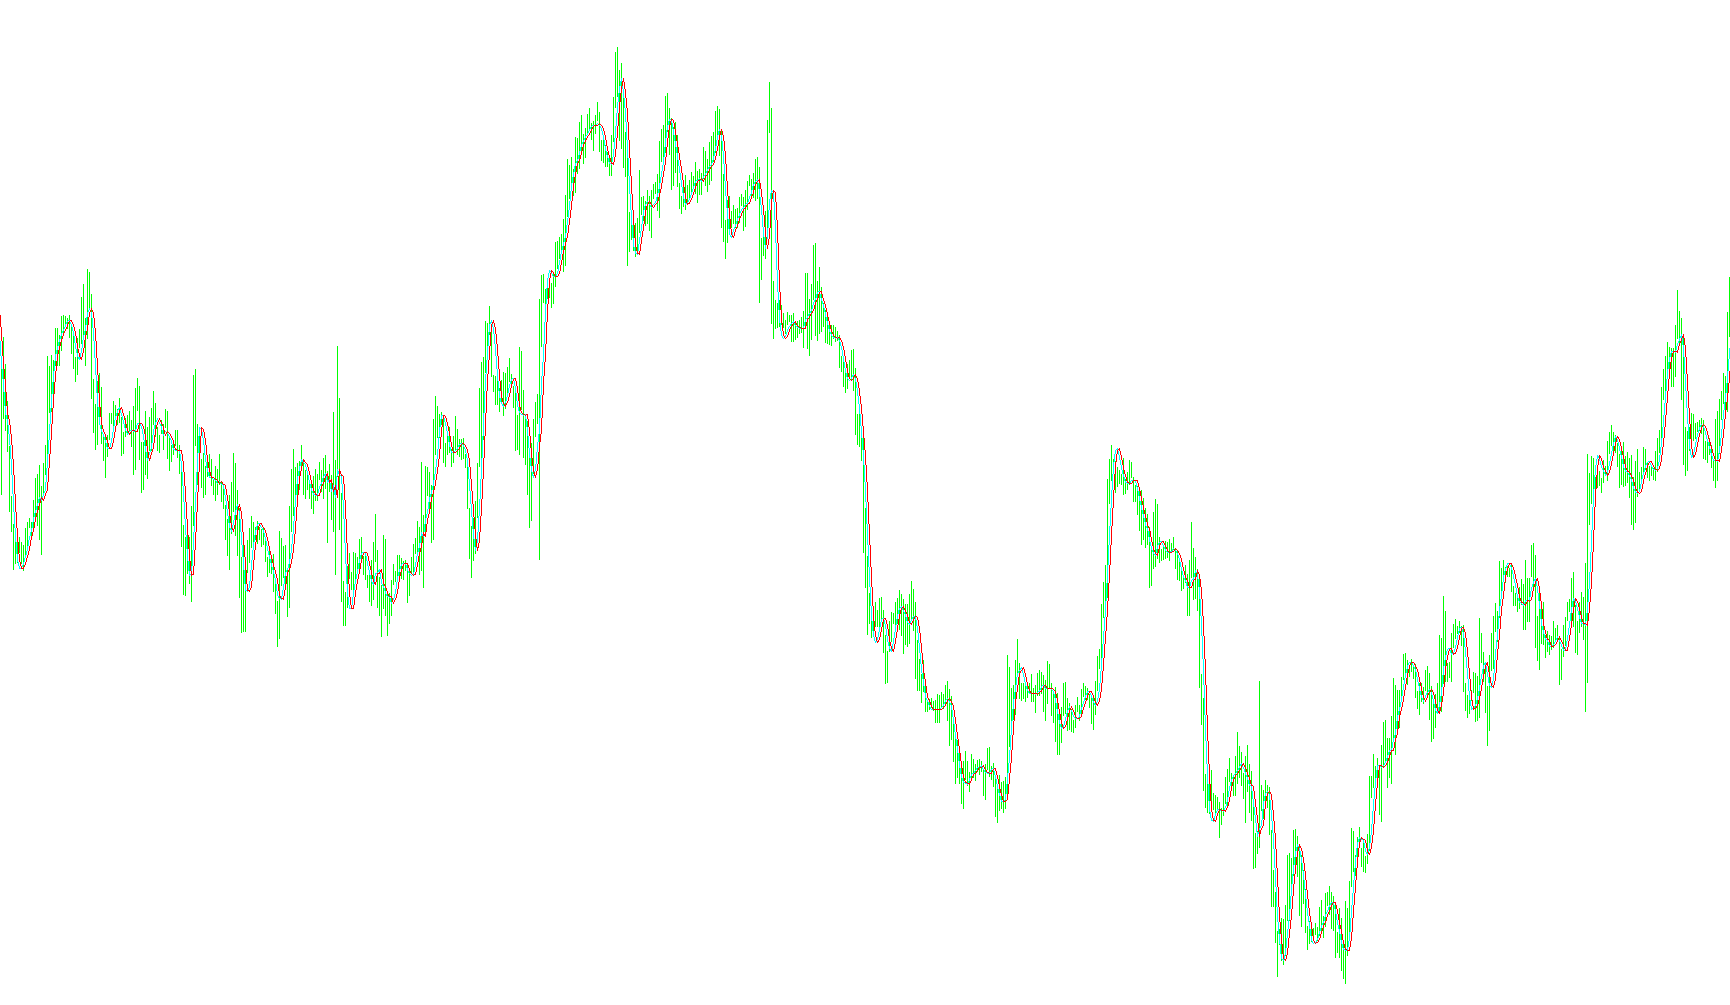
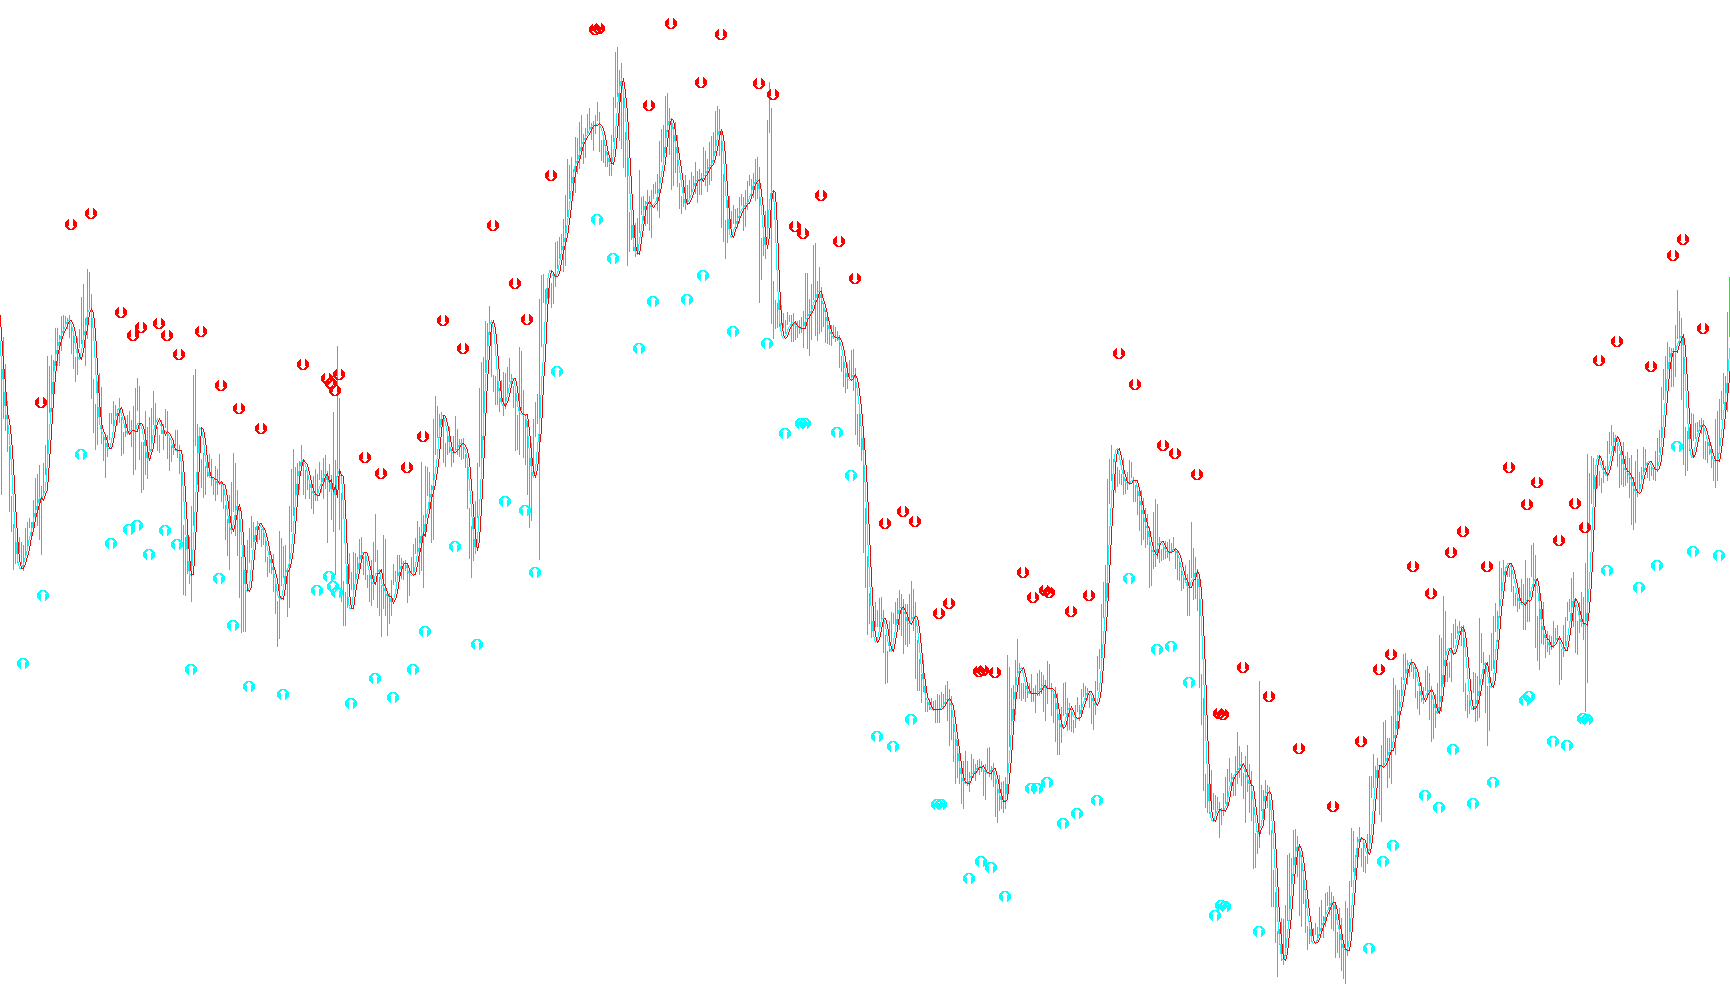
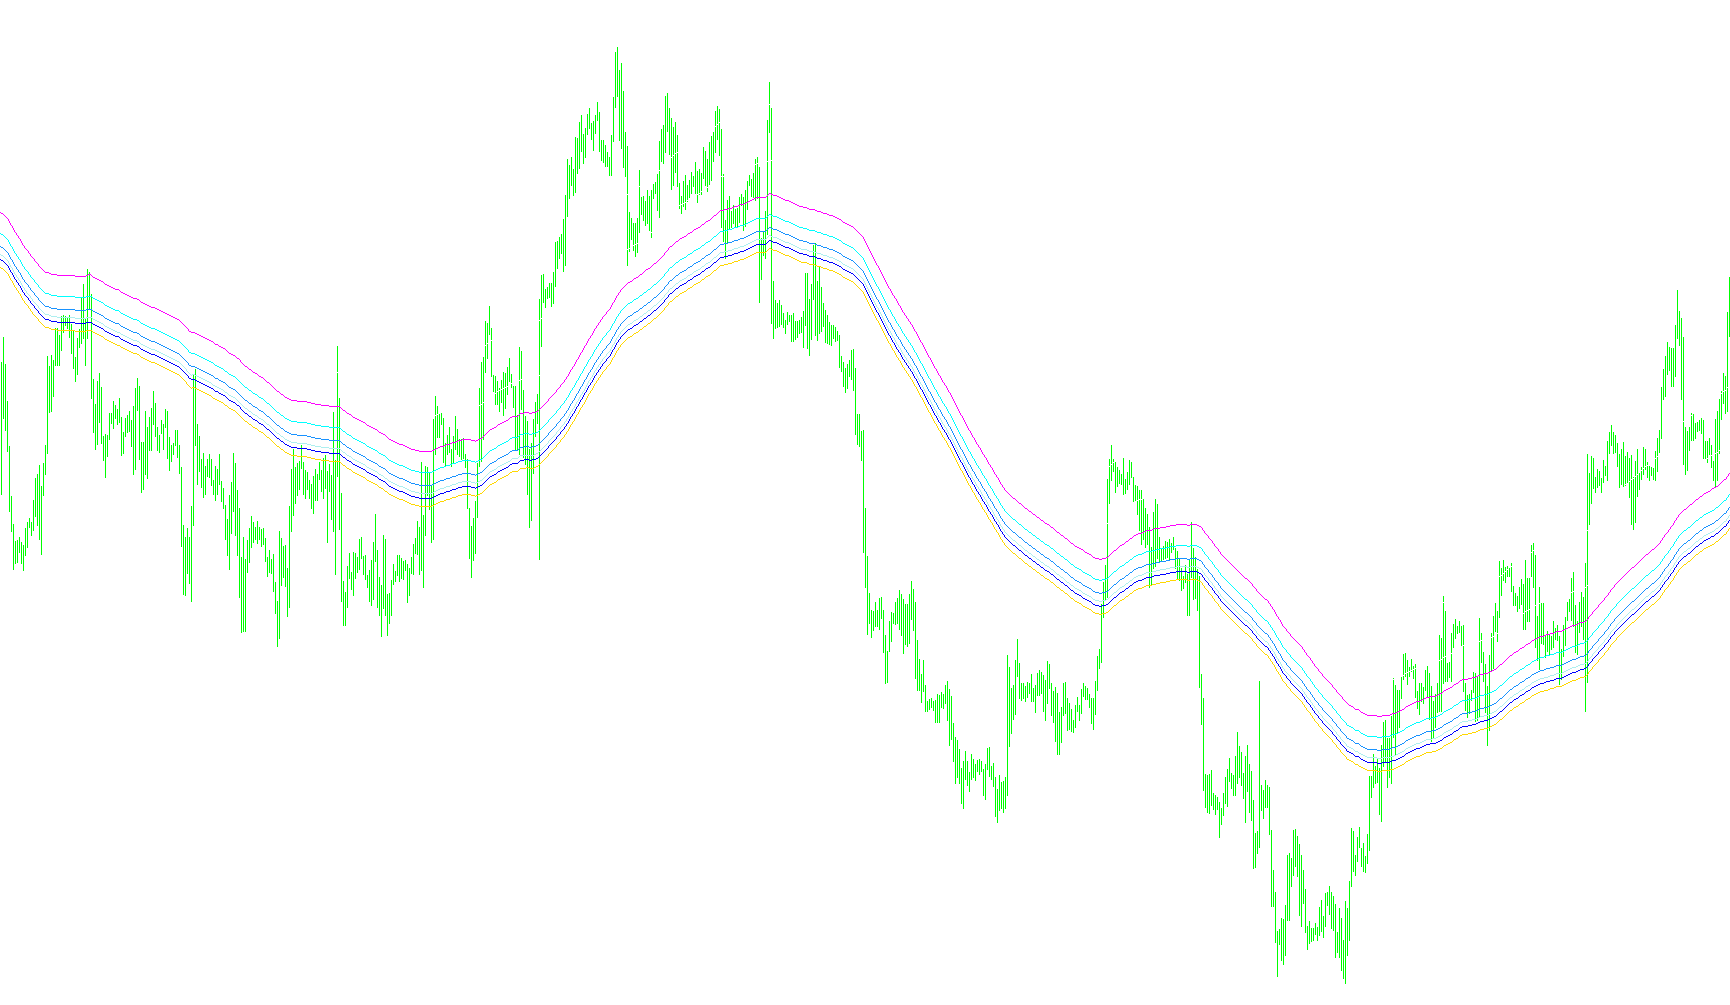
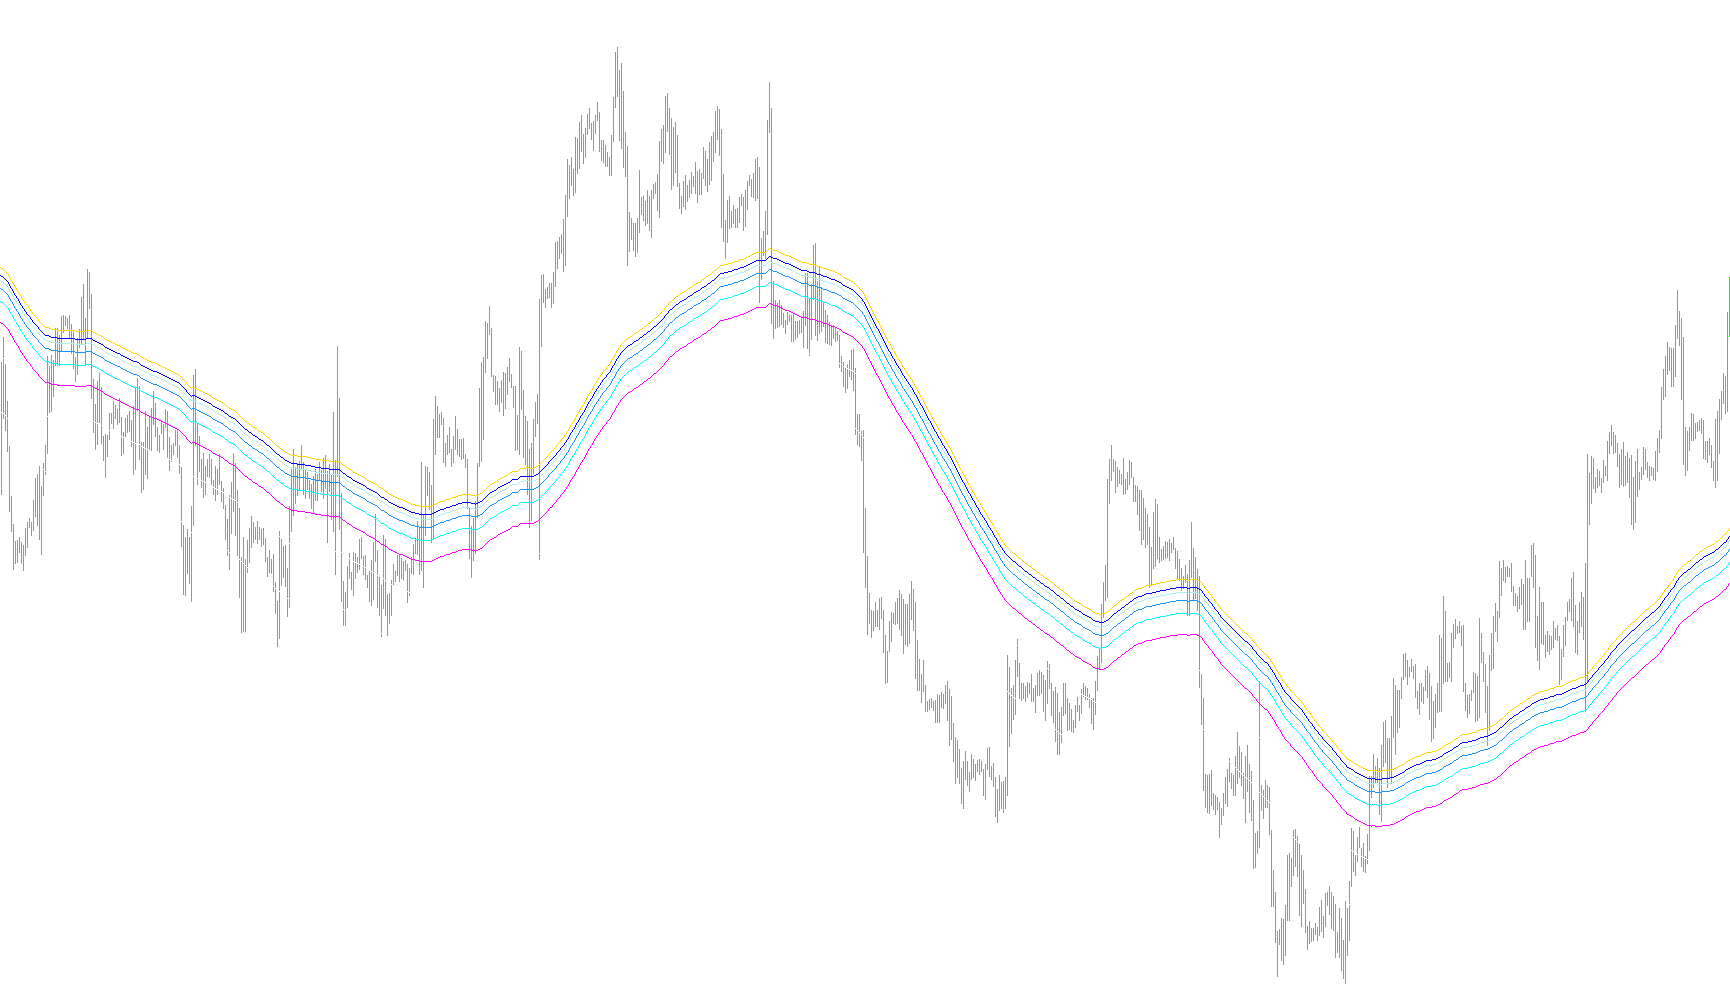
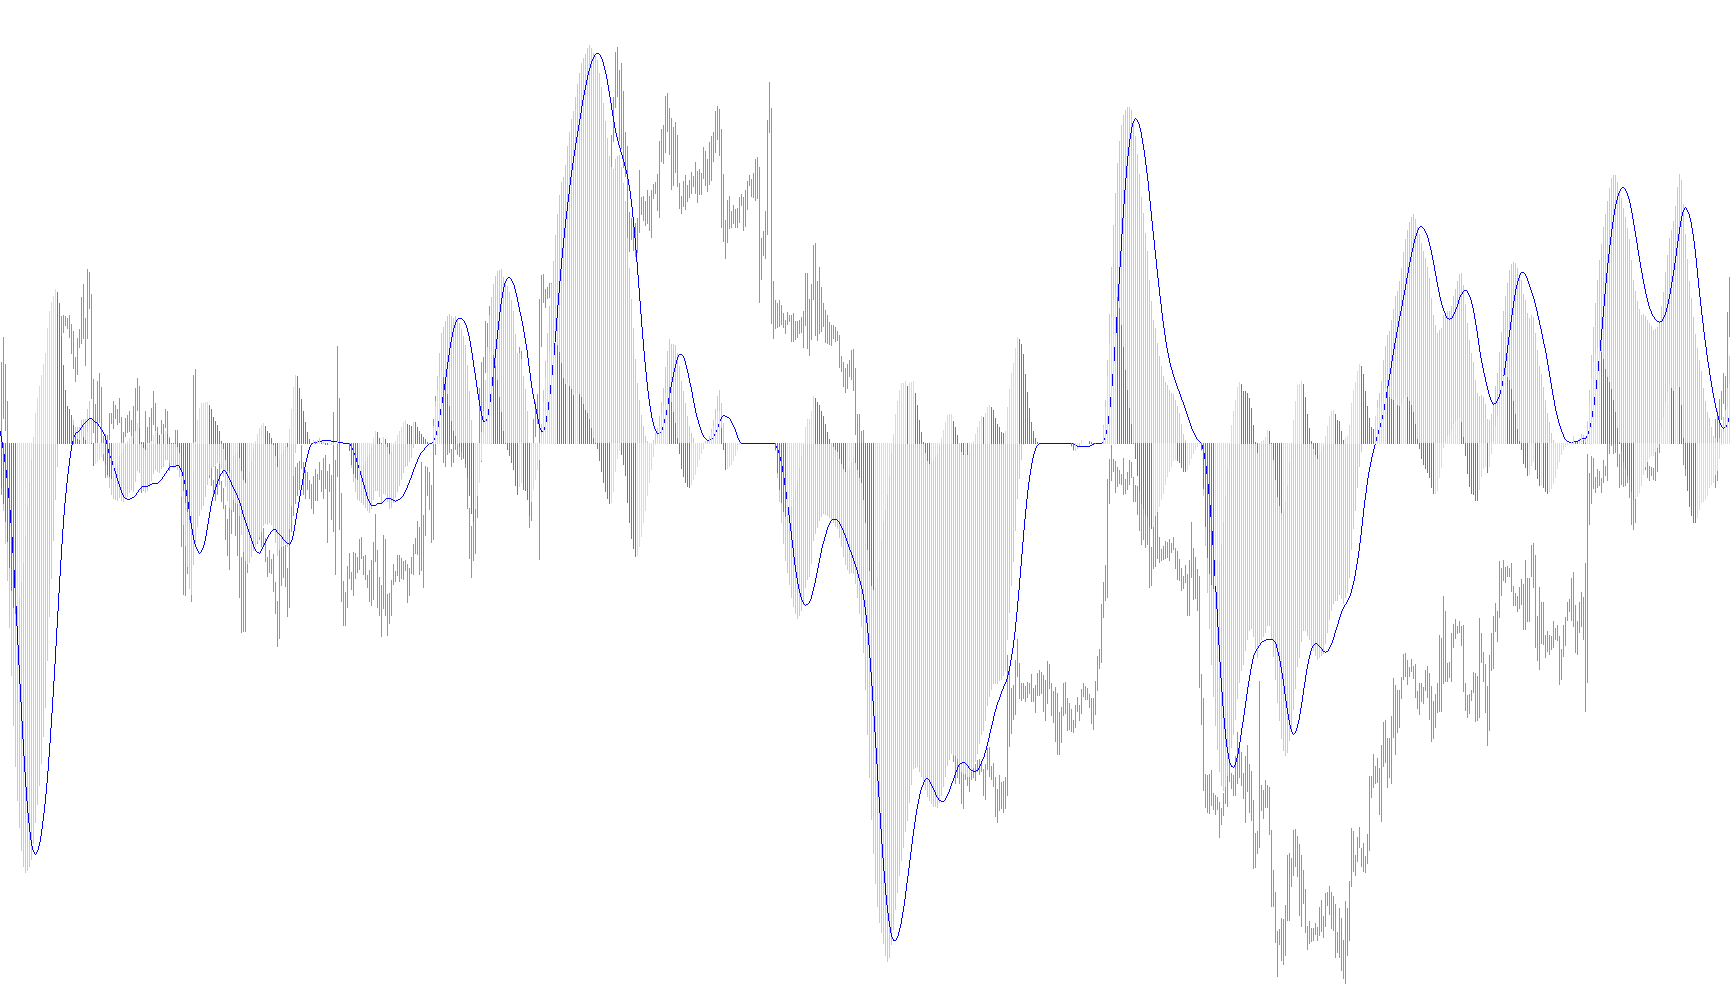
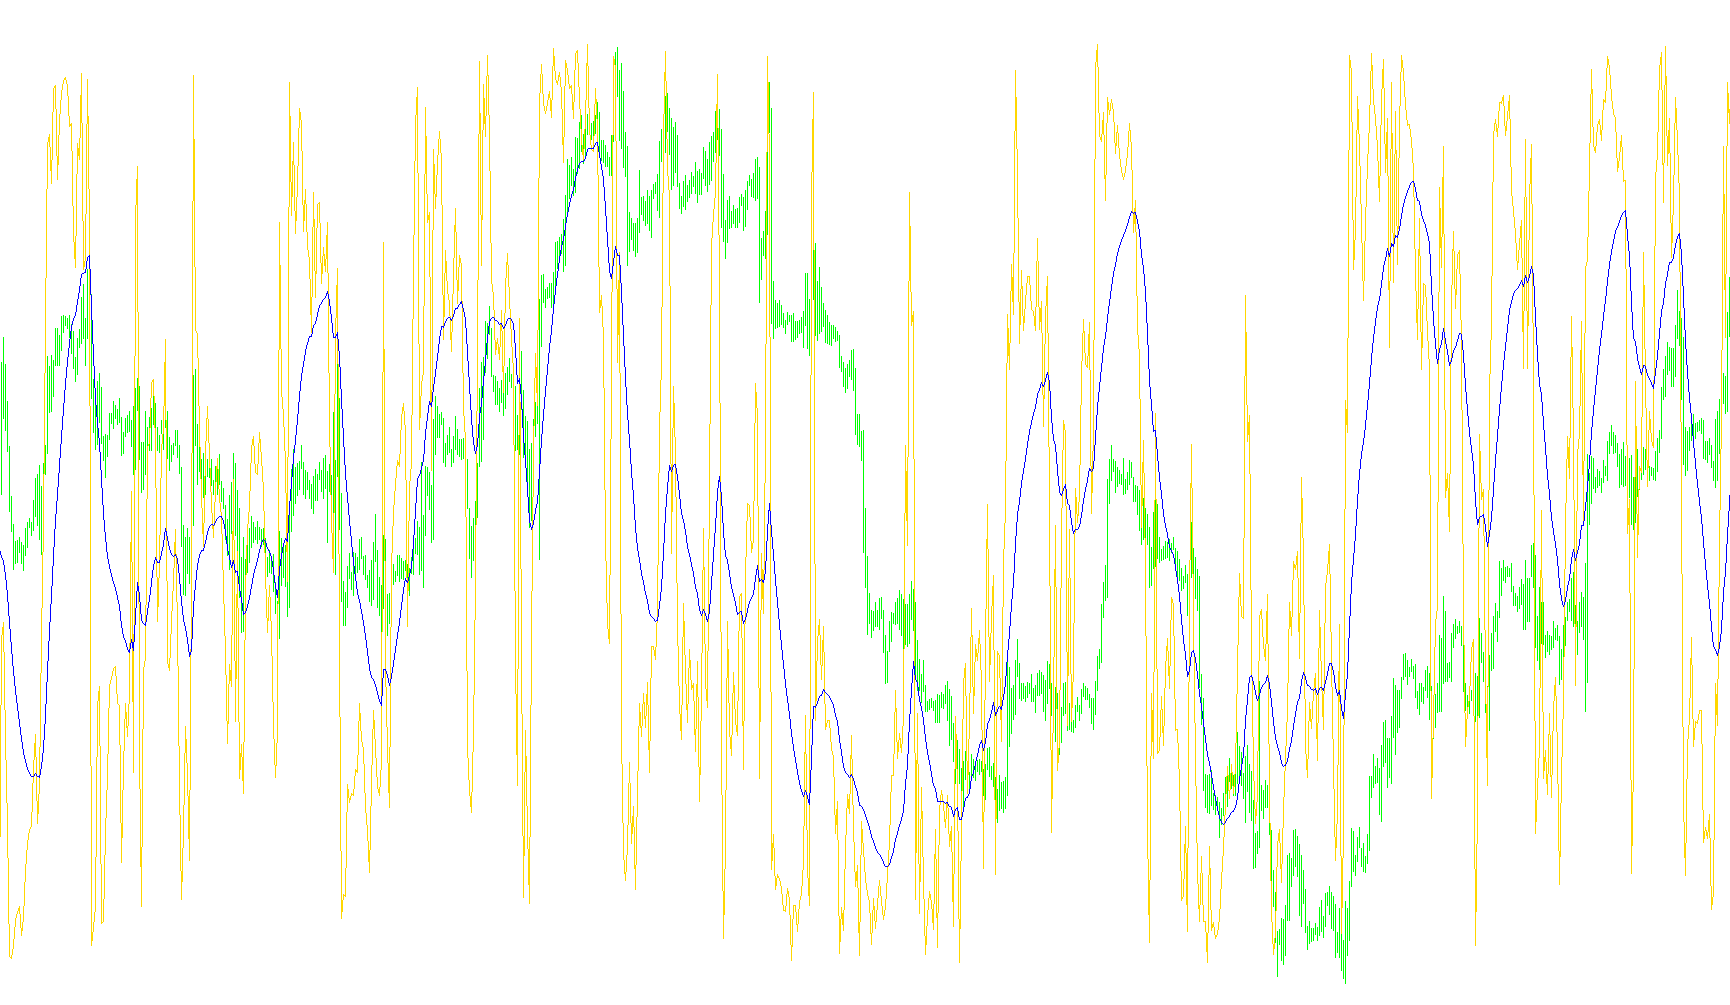
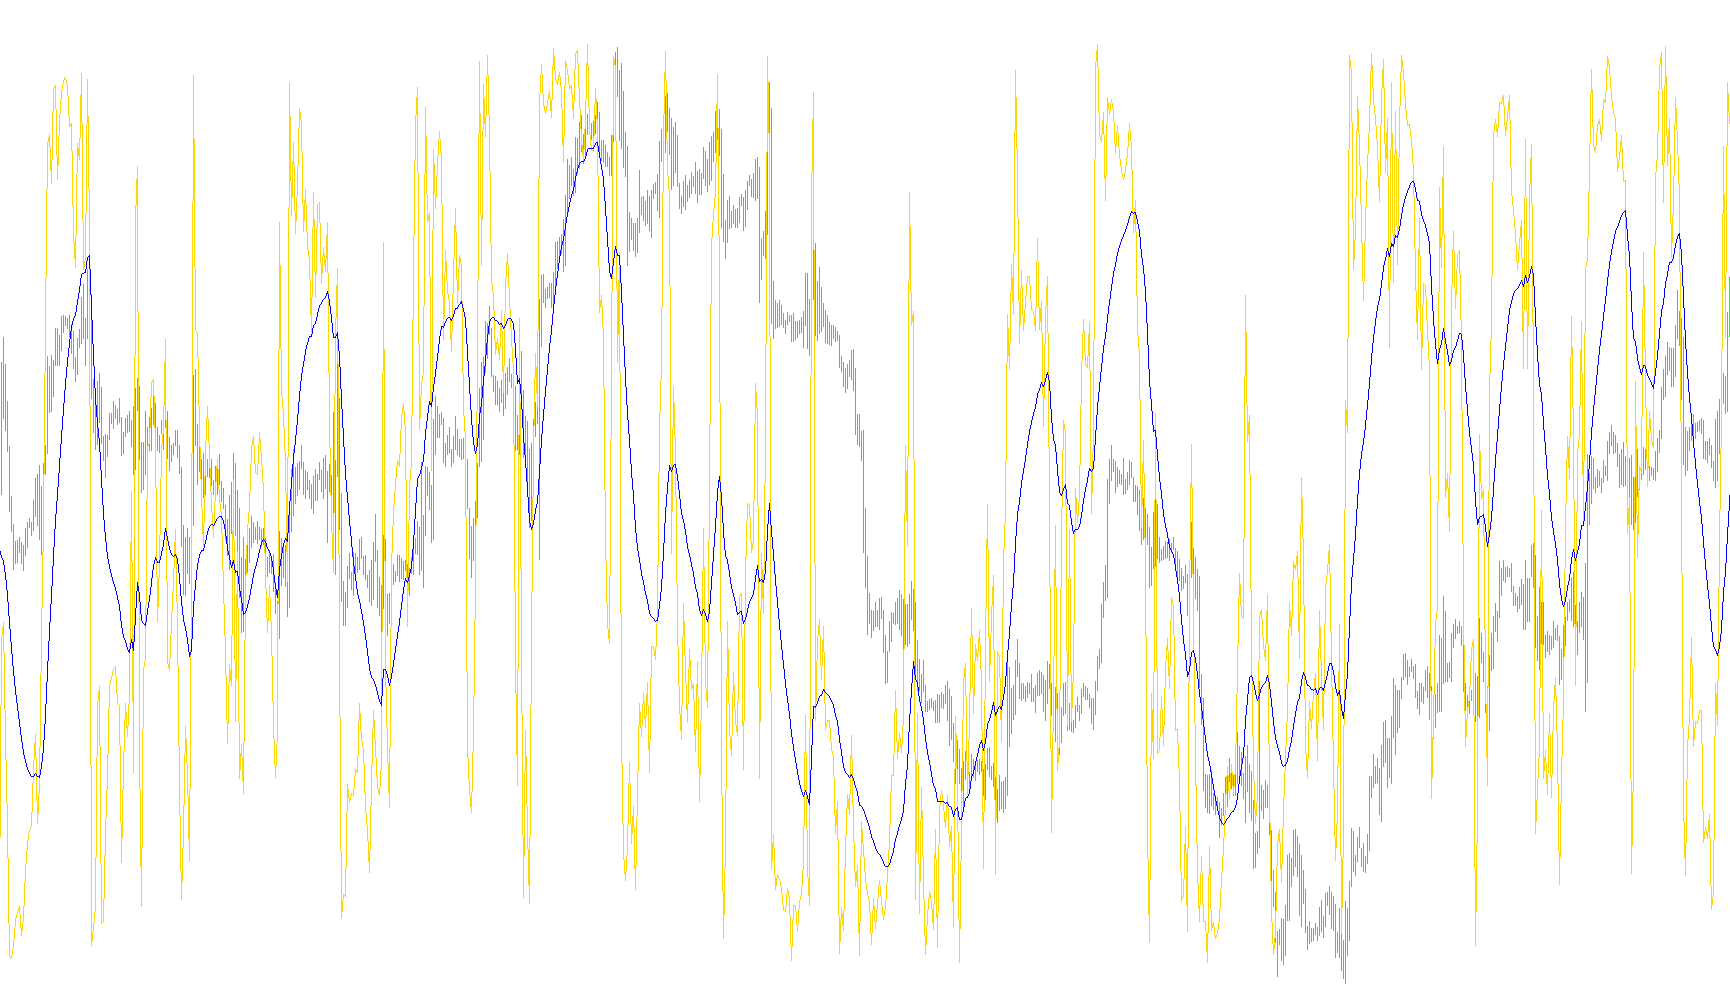
iFXAnalyser_H4_v1
Indicator

iFXAnalyser_H4_v1

iMA

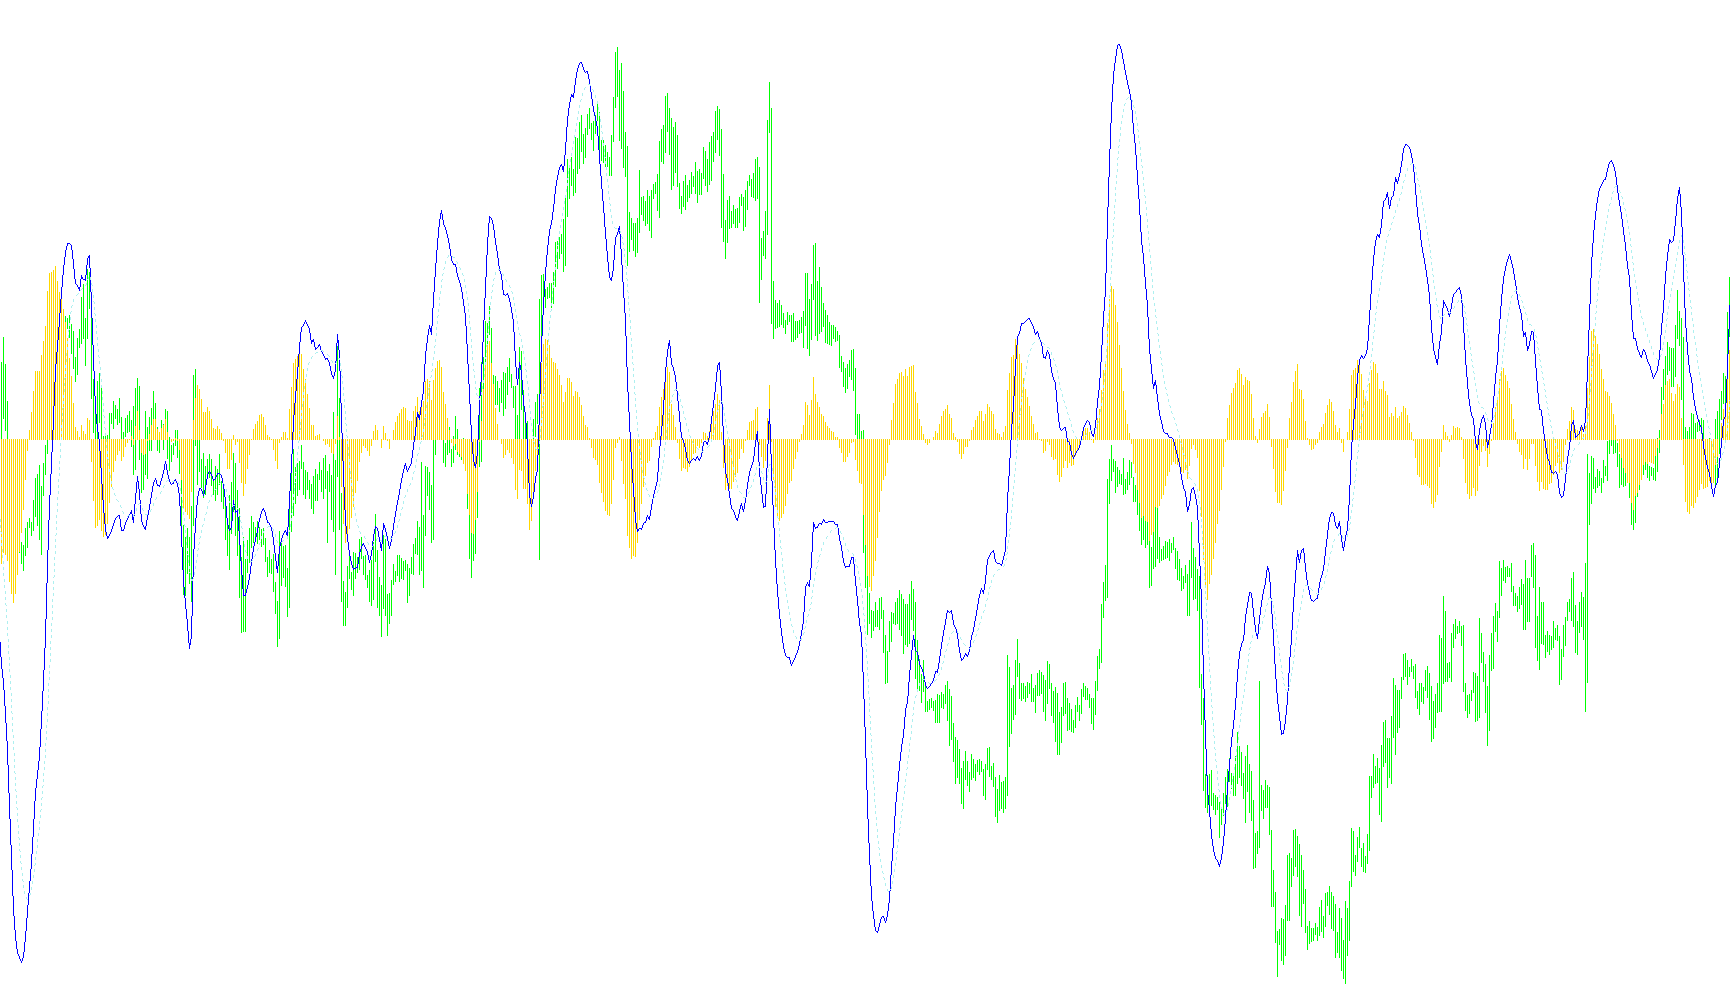
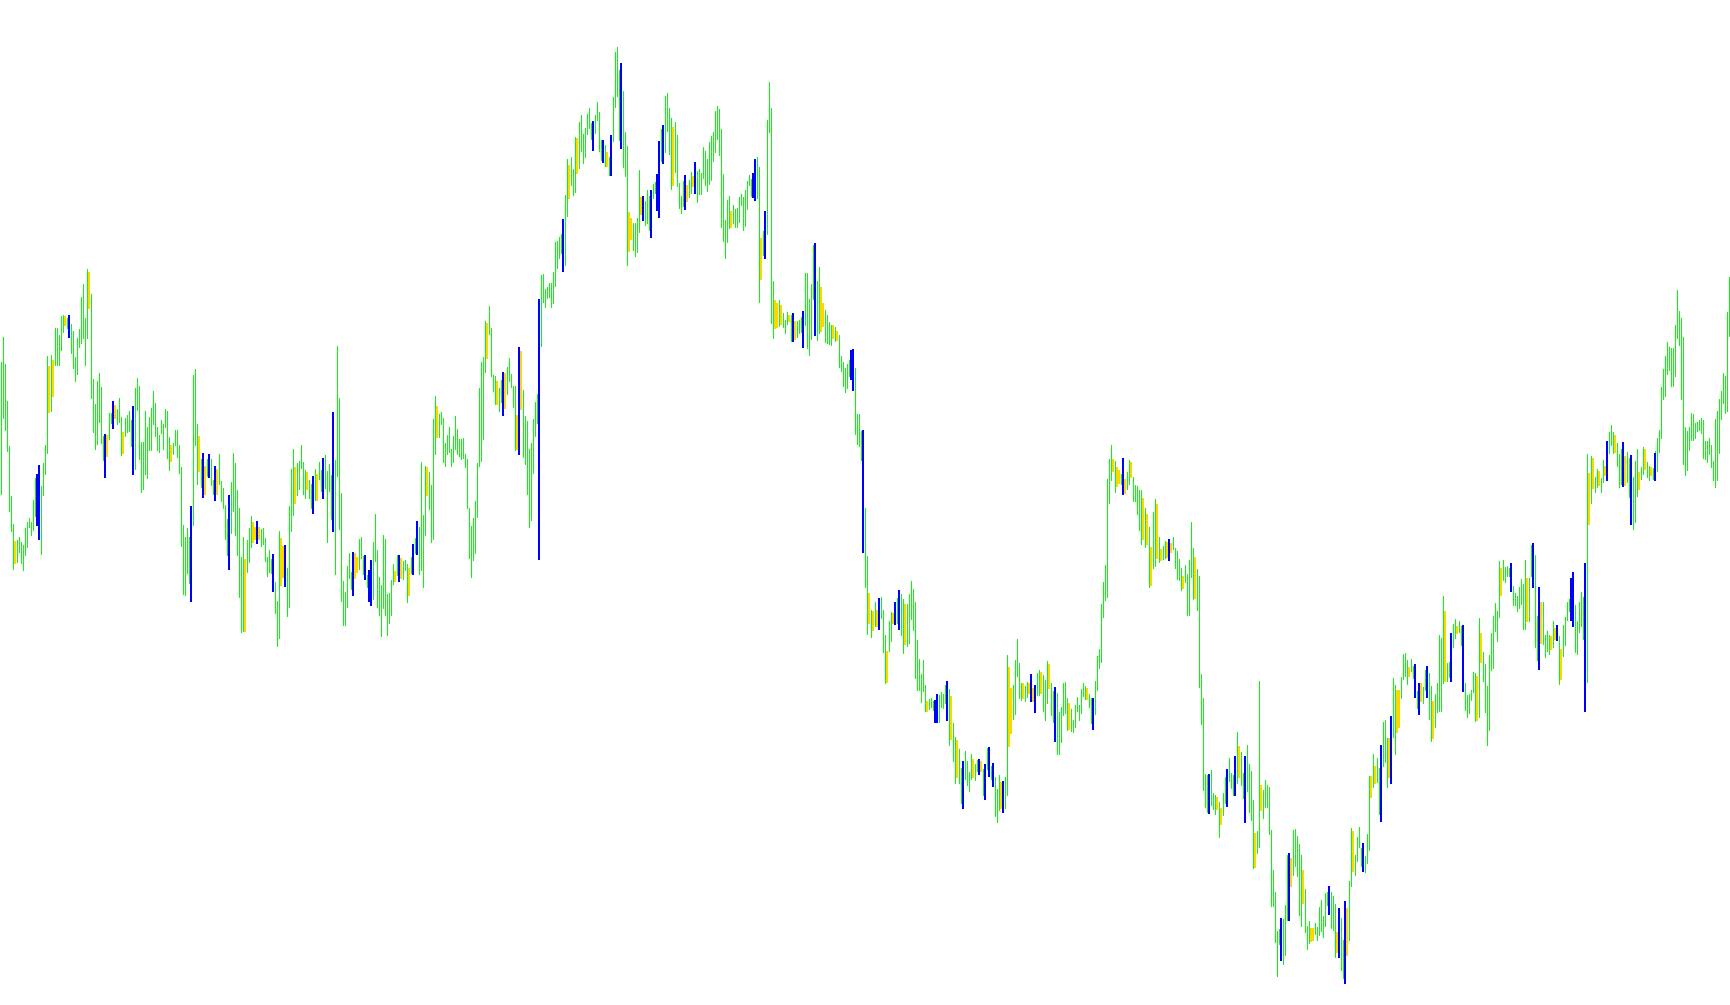
This indicator quantifies price momentum by calculating the spread between two moving averages and deriving their rate of change to identify acceleration trends.

iFXAnalyser_v1
Indicator

iFXAnalyser_v1

iMA

This indicator calculates and visualizes the progressive derivatives of moving average differences to identify divergence, price slope, and acceleration velocity.

iFXAnalyser_v2
Indicator

iFXAnalyser_v2

iMA

This indicator quantifies market dynamics by calculating the differential, first derivative (slope), and second derivative (acceleration) between two moving averages to reveal underlying price velocity.

iFXSI
Indicator

iFXSI

iBearsPoweriBandsiCCIiADX

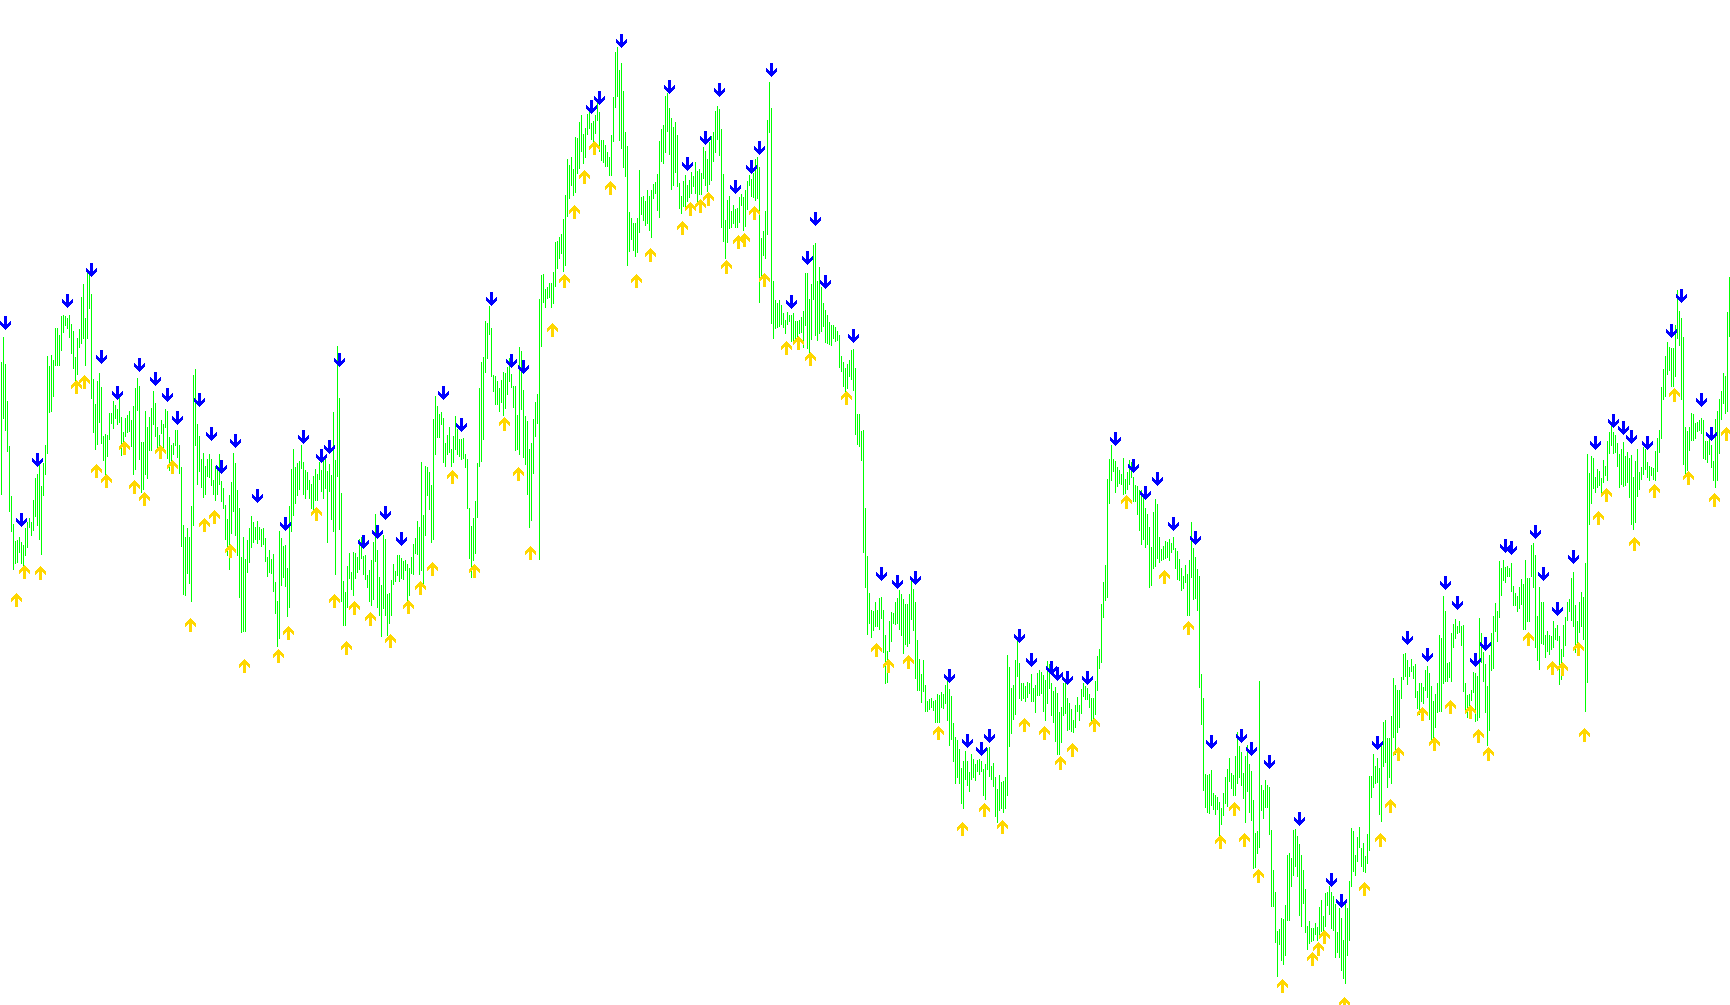
This indicator generates directional signals by validating concurrent crossovers from iTrend, ZeroLag Stochastic, and ADX components against CCI threshold filters.

iFXSI_v1
Indicator

iFXSI_v1

iBearsPoweriBandsiCCIiADX

This indicator identifies high-probability trade entries by synchronizing signal crossovers from iTrend, ZeroLag Stochastic, and ADX metrics with CCI momentum validation.

Igrok
Indicator

Igrok

This indicator identifies and projects horizontal support, resistance, and opening price levels based on multi-day range averages and historical pivot points.

iHighLow
Indicator

iHighLow

This indicator identifies and plots the highest high and lowest low values within a user-defined rolling lookback window to highlight localized price extremes.

IINWMARROWS alert
Indicator

IINWMARROWS alert

iMA

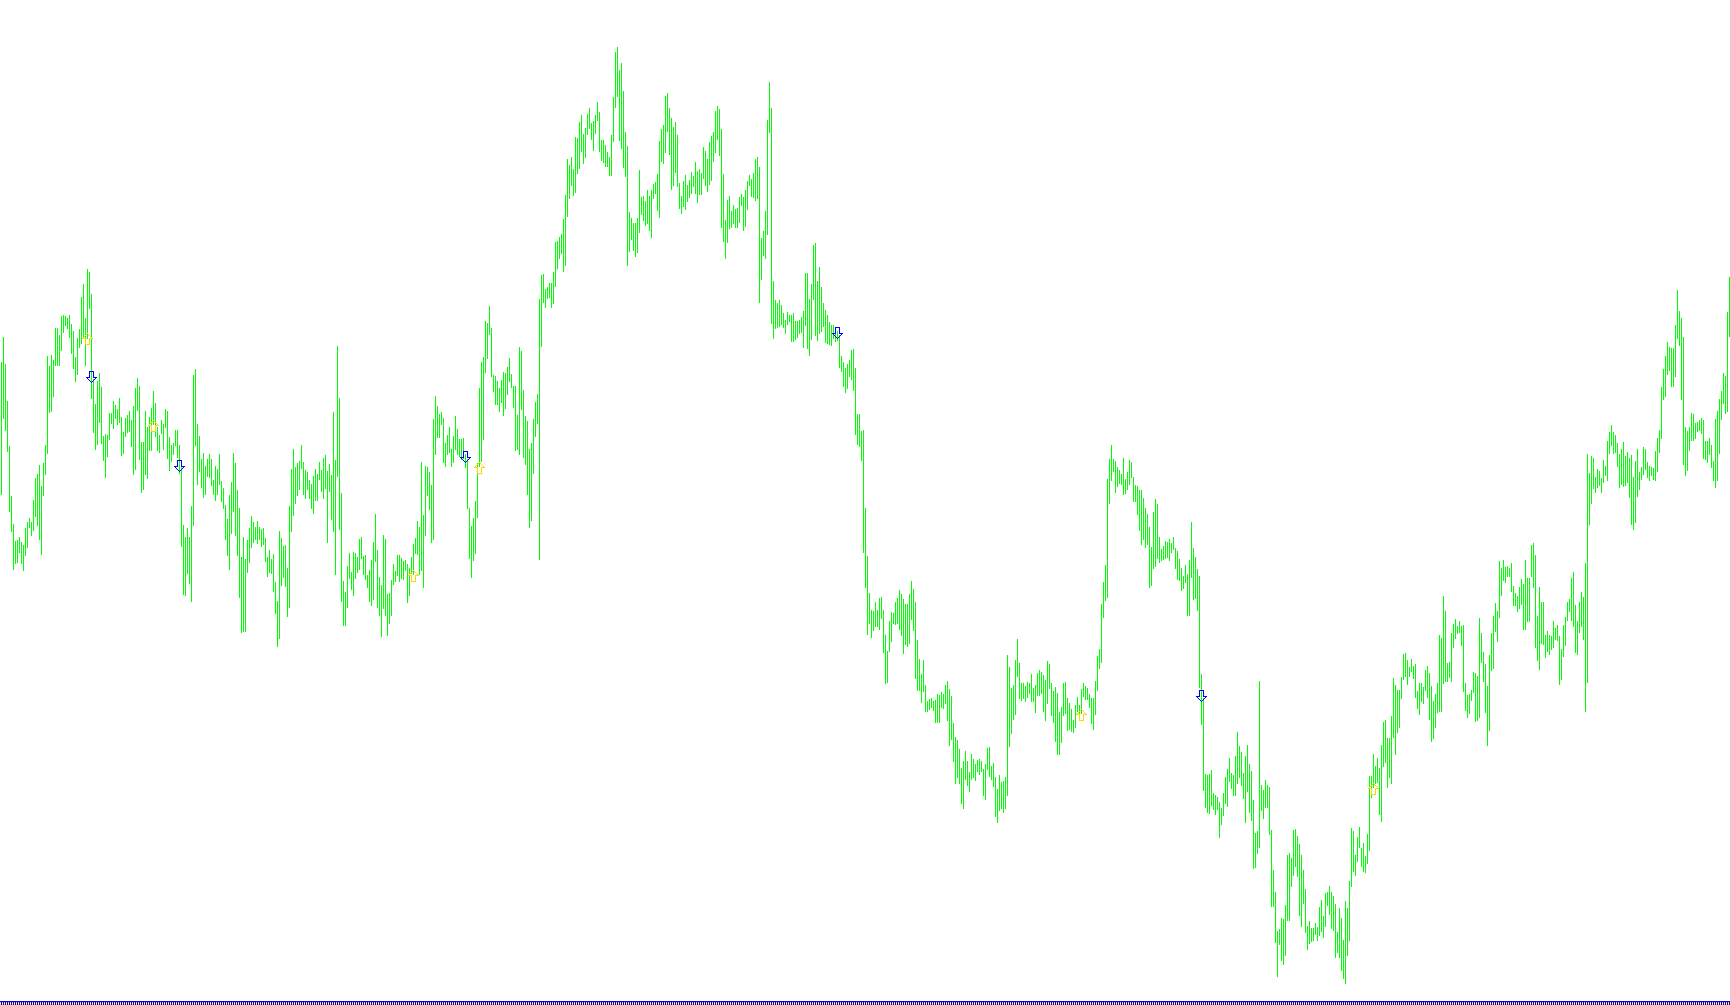
This indicator identifies high-probability trend reversals by detecting precise intersection points between two moving averages of different calculation modes and price sources.

IINWMARROWS
Indicator

IINWMARROWS

iMA

This indicator identifies trend reversals by detecting precise geometric crossovers between two distinct moving average velocities while normalizing signals against local volatility ranges.

IINWMARROWS_002
Indicator

IINWMARROWS_002

iMA

This indicator identifies trend shifts by detecting precise crossovers between two configurable moving averages of varying smoothing types, plotted as dynamic range-based signals.

IINWMARROWS_003
Indicator

IINWMARROWS_003

iMA

Identifies momentum shifts by detecting precise crossover points between high-frequency and low-frequency moving averages using configurable smoothing methods.

IINWMARROWS_004
Indicator

IINWMARROWS_004

iMA

Identifies trend shifts by detecting specific price crossovers between two customizable moving average types using a normalized volatility buffer for visual offset.

Indicator

II_SupDem

iKarakatica
Indicator

iKarakatica

iADX

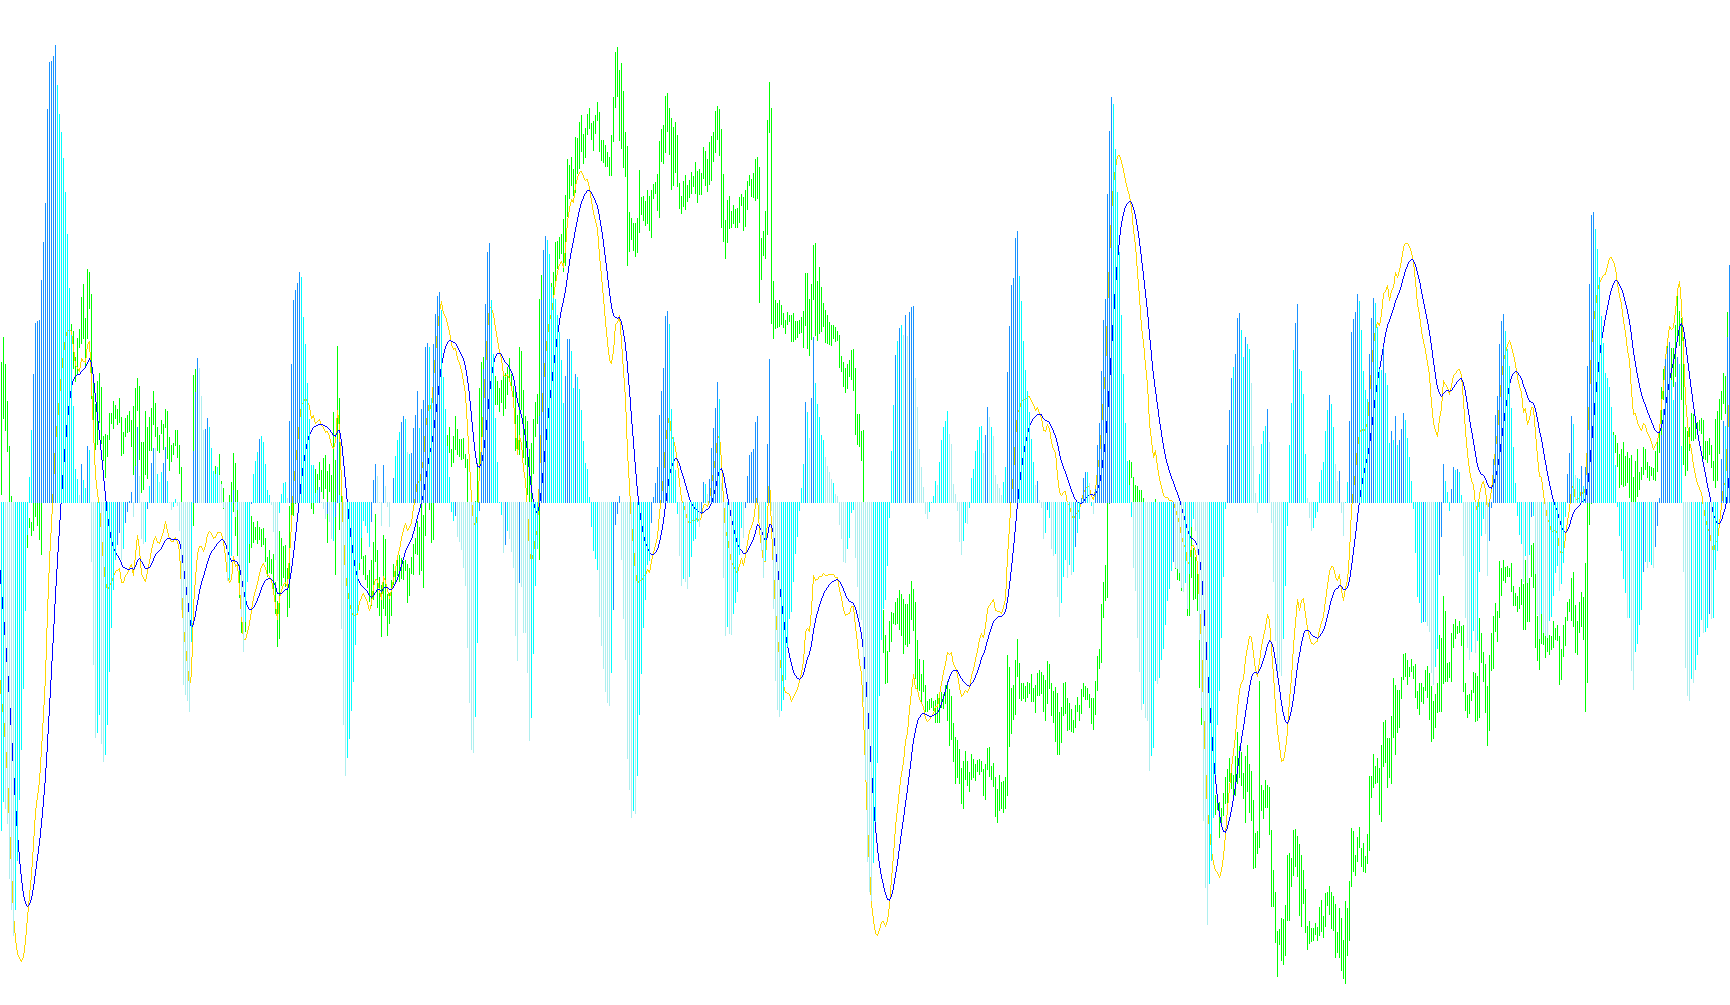
Identifies trend reversals by detecting bullish or bearish price shifts aligned with the Plus/Minus Directional Index and a specific historical price offset.
iKarakatica_v1
Indicator

iKarakatica_v1

iADX

The indicator identifies bullish and bearish structural shifts by detecting price crossovers relative to historical periods while confirming momentum through Positive and Negative Directional Index supremacy.

iK_tay_v01
Indicator

iK_tay_v01

This indicator employs an iterative brute-force search to identify optimal take-profit and stop-loss parameters by simulating historical trade outcomes under two distinct logic paradigms: price symmetry and inverse trend behavior.

ima
Indicator

ima

iMA

This indicator calculates and plots a continuous moving average line to identify core price momentum and trend direction based on user-defined period and smoothing methods.

iMACD
Indicator

iMACD

iMA

This indicator calculates the differential between two Exponential Moving Averages to derive a momentum line, subsequently smoothing it into a signal line to highlight price velocity shifts.

iMACross
Indicator

iMACross

iMA

This indicator calculates the real-time variance between a fast and slow moving average, applying an exponential smoothing filter to derive a signal line for momentum identification.

iMACross_v1
Indicator

iMACross_v1

iMA

This indicator calculates the absolute variance between two distinct moving averages and smooths the resulting differential into a signal stream to identify momentum shifts.

iMACross_v2
Indicator

iMACross_v2

iMA

This indicator calculates the arithmetic difference between two moving averages of varying types and periods, scaled by a factor of ten thousand to visualize momentum shifts.

iMAX
Indicator

iMAX

This indicator utilizes a modified elliptic filter algorithm to isolate underlying price trends by stripping away high-frequency noise and cycles.

iMAX3
Indicator

iMAX3

This hybrid indicator integrates three distinct modes of the Modified Optimum Elliptic Filter to provide high-stability trend detection through both frequency and amplitude phase-shifting techniques.

iMAX3alert
Indicator

iMAX3alert

This tool utilizes a modified optimum elliptic filter to detect trend phase crossings through three distinct adaptive engines, offering a customizable balance between signal responsiveness and price noise suppression.

iMAX3alert1
Indicator

iMAX3alert1

This indicator utilizes a modified optimum elliptic filter to detect trend reversals through three distinct phase-shift sensitivities, providing real-time alerts on structural price crossings with configurable filtering for volatile assets.

iMAXalert2
Indicator

iMAXalert2

This indicator utilizes a modified elliptic filter and optimal detrending logic to identify momentum shifts by detecting threshold-based crossovers between a primary trend line and its phase-shifted counterpart.

iMA_Fibs_Above
Indicator

iMA_Fibs_Above

iMA

This indicator projects multiple Fibonacci-scaled price levels relative to a customizable moving average baseline, including support for Linear Regression Smoothing.

iMA_Fibs_Above_v1
Indicator

iMA_Fibs_Above_v1

iMA

This indicator projects multiple price levels based on specific Fibonacci percentage offsets derived from various Moving Average types including LSMA, EMA, and SMMA.

iMA_Fibs_Above_v2
Indicator

iMA_Fibs_Above_v2

iMA

This indicator projects a series of dynamic price levels derived from specific Fibonacci offsets relative to various moving average types, including Linear Regression.

iMA_Fibs_Below
Indicator

iMA_Fibs_Below

iMA

This indicator projects multiple dynamic price levels by subtracting specific Fibonacci-weighted point offsets from a user-selectable moving average base.

iMA_Fibs_Below_v1
Indicator

iMA_Fibs_Below_v1

iMA

This indicator projects a series of dynamic support and resistance levels based on specific Fibonacci percentages derived from various moving average types including EMA, SMMA, LWMA, and LSMA.

iMA_TrueFibs_Above
Indicator

iMA_TrueFibs_Above

iMA

This indicator calculates a selectable moving average and projects multiple horizontal price levels based on Fibonacci sequence offsets from that mean value.

iMA_TrueFibs_Above_v1
Indicator

iMA_TrueFibs_Above_v1

iMA

This indicator projects a series of multi-level price boundaries at fixed intervals above a selected moving average type.

iMA_TrueFibs_Below
Indicator

iMA_TrueFibs_Below

iMA

This indicator calculates a primary moving average and generates seven distinct parallel price levels shifted downward based on specific Fibonacci sequence integers.

iMA_TrueFibs_Below_v1
Indicator

iMA_TrueFibs_Below_v1

iMA

This indicator generates a primary moving average line along with seven dynamic offset levels based on specific Fibonacci sequences to identify potential support and resistance zones.

iMirror
Indicator

iMirror

This indicator calculates the ratio between standard price ranges and their reciprocal values to project a geometrically mirrored price transformation onto the current chart.

impuls
Indicator

impuls

iMACDiMA

This indicator synchronizes the rate of change from Exponential Moving Averages and MACD momentum to visualize bullish, bearish, and neutral market impulses.

Impulse CDC
Indicator

Impulse CDC

iMAiMAOnArray

The algorithm identifies bullish and bearish momentum by calculating the spread between weighted moving averages and smoothed high/low extremes, visualized through dynamic convergence-divergence histogram shifts.

Impulse MACD
Indicator

Impulse MACD

iMAiMAOnArray

This indicator calculates the variance between a linearly weighted moving average and its corresponding smoothed high/low extremes to isolate momentum shifts.

ImpulseOsMA
Indicator

ImpulseOsMA

iMAiMAOnArray

This indicator identifies directional momentum by calculating the spread between nested exponential moving averages and filtering trends through a secondary moving average confirmation layer.

impulsmodify
Indicator

impulsmodify

iMACDiMA

This indicator synchronizes the velocity of Exponential Moving Averages and MACD main lines to visualize multi-layered trend momentum through a three-color histogram.

In & Out Alert
Indicator

In & Out Alert

This indicator identifies and alerts on price action anomalies where a current candle's range exceeds the previous candle's boundaries, signaling sudden momentum shifts.

in&out
Indicator

in&out

This indicator identifies specific price action patterns where the current candle's range exceeds the previous bar's high and low boundaries to signal directional expansion or interior contraction.

in&out_001
Indicator

in&out_001

This indicator identifies market expansion by detecting candles where the current high and low exceed the preceding candle's range, signifying a breach of previous price boundaries.

in&out_v1
Indicator

in&out_v1

The indicator identifies and highlights price action bars that exhibit higher highs and lower lows compared to their immediate preceding candles, signaling significant volatility expansion.

ind - Profitunity Bars
Indicator

ind - Profitunity Bars

iACiAO

This indicator identifies directional shifts by detecting synchronized upward or downward movements in both the Awesome Oscillator and Accumulation/Distribution values.

ind - Profitunity Bars_v1
Indicator

ind - Profitunity Bars_v1

iACiAO

Identifies bullish and bearish momentum shifts by detecting concurrent directional increases in both the Awesome Oscillator and the AC indicator values.

IND Inverse+EMA
Indicator

IND Inverse+EMA

This indicator quantifies price action by calculating the relative position of the closing price within a dynamic high-low range and smoothing it through an exponential moving average.

IND Inverse+EMA_v1
Indicator

IND Inverse+EMA_v1

This indicator normalizes price action relative to a dynamic high-low range and applies an exponential smoothing filter to identify trend reversals.

IND Inverse
Indicator

IND Inverse

This indicator calculates the relative position of the current closing price against a dynamic range derived from historical extremes to identify mean reversion extremes.