InstantaneousTrendline
Download script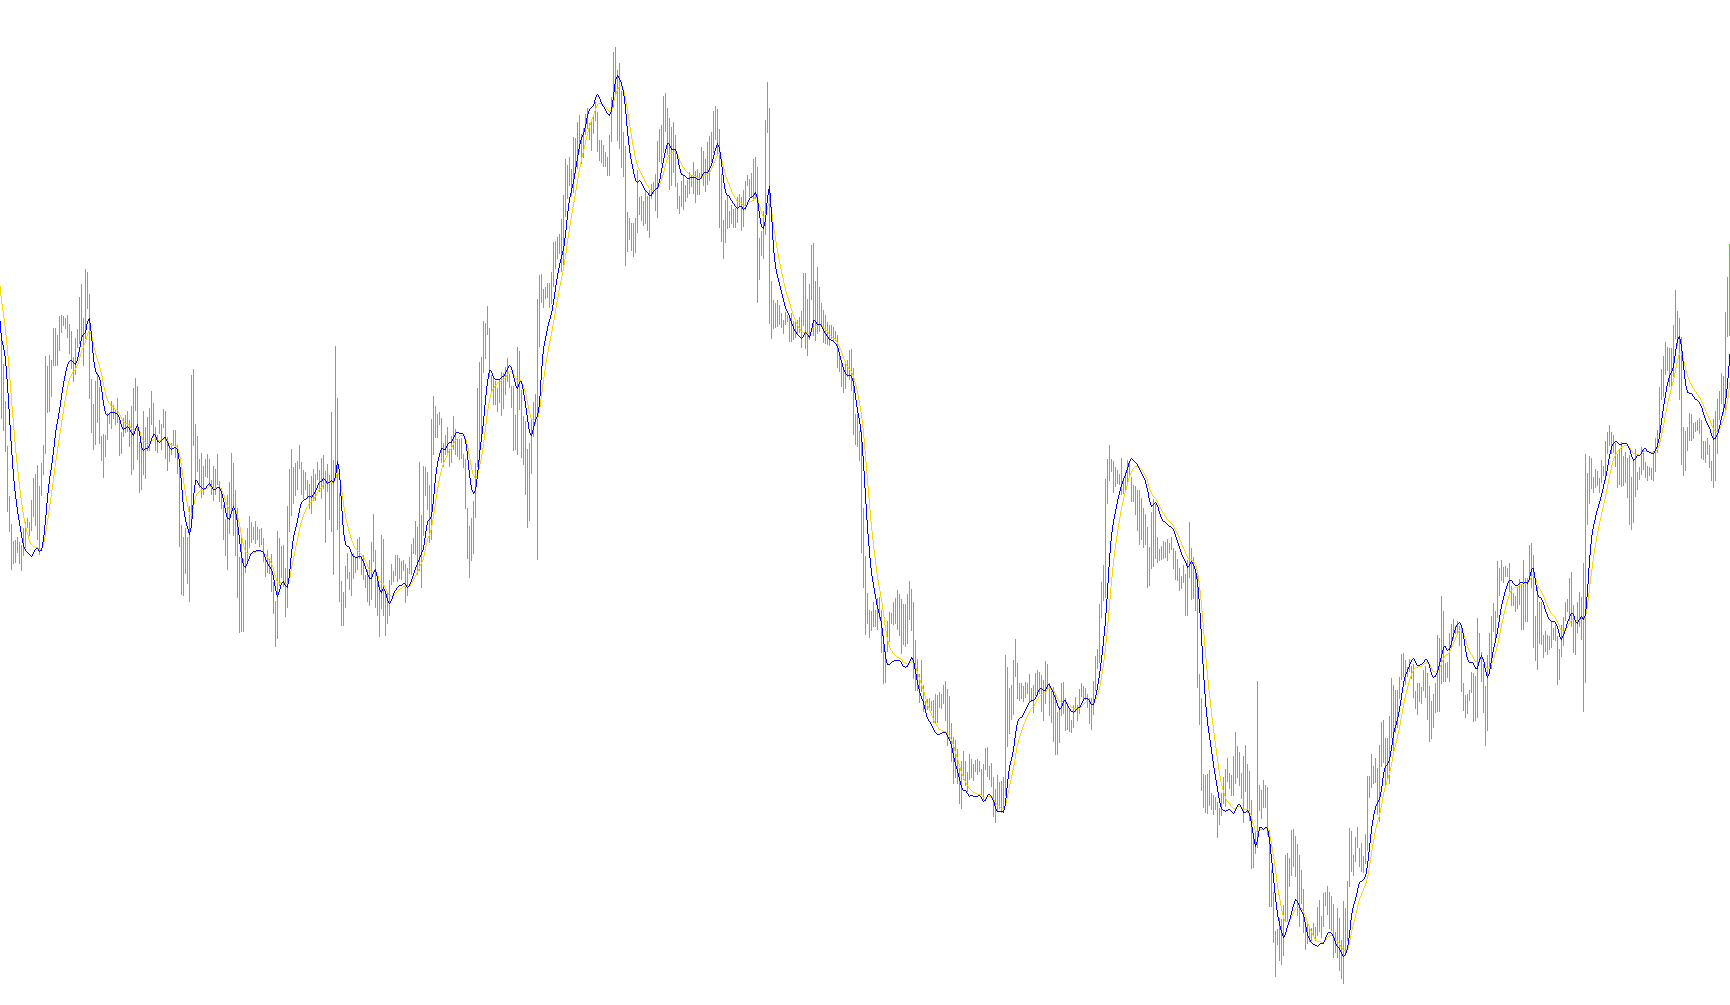
This indicator is designed to provide traders with a real-time visual representation of market momentum and trend direction by calculating "instantaneous" price movements. Rather than relying on traditional lagging indicators that look backward at historical data to guess what might happen next, this tool uses a mathematical approach to smooth out market noise and identify the current trajectory of the price.
How the Logic Works
1. Data Foundation (The Median Price) The script begins by simplifying the raw price action. Instead of looking at just the highest or lowest points of a candle—which can often be distorted by "wicks" or sudden spikes—it calculates the midpoint between the high and low prices. This creates a cleaner, more balanced baseline for the calculations to follow.
2. The Smoothing Mechanism The core of this tool is a sophisticated smoothing algorithm (based on Cybernetics Analysis). It takes the current price data and applies a weighted formula to eliminate "jitter" or random market fluctuations.
- It looks at the most recent price points alongside the previous trend values.
- By weighting these different inputs, the script produces a continuous, flowing line that represents the "true" underlying direction of the market.
- This allows the indicator to react quickly enough to be useful, but smoothly enough to prevent traders from reacting to every minor price tick.
3. Trend Identification and the Trigger The tool generates two distinct visual components:
- The Instantaneous Trendline: This is your primary guide. It shows the immediate path of the market's momentum. If the line is moving upward, the trend is bullish; if downward, it is bearish.
- The Trigger: This is a derivative calculation used to identify specific moments of change. By comparing the current smoothed trend against its recent history, the "Trigger" helps highlight where the momentum might be accelerating or shifting. It acts as a secondary signal to confirm when the primary trendline is gaining strength or beginning to pivot.
Summary for the User
In simple terms, this script filters out the "noise" of the market to show you the actual flow of price movement. It provides a visual "pathway" that helps you see where the market is heading right now, allowing for a clearer understanding of the prevailing trend without being distracted by minor, insignificant price fluctuations.
//+------------------------------------------------------------------+
//|                                       InstantaneousTrendline.mq4 |
//|                                                                  |
//| Instantaneous Trendline                                          |
//|                                                                  |
//| Algorithm taken from book                                        |
//|     "Cybernetics Analysis for Stock and Futures"                 |
//| by John F. Ehlers                                                |
//|                                                                  |
//|                                              contact@mqlsoft.com |
//|                                          http://www.mqlsoft.com/ |
//+------------------------------------------------------------------+
#property copyright "Coded by Witold Wozniak"
#property link      "www.mqlsoft.com"

#property indicator_chart_window
#property indicator_buffers 2
#property indicator_color1 Red
#property indicator_color2 Blue

#property indicator_level1 0

double ITrend[];
double Trigger[];

extern double Alpha = 0.07;
int buffers = 0;
int drawBegin = 0;

int init() {
    drawBegin = 8;
    initBuffer(ITrend, "Instantaneous Trendline", DRAW_LINE);
    initBuffer(Trigger, "Trigger", DRAW_LINE);
    IndicatorBuffers(buffers);
    IndicatorShortName("Instantaneous Trendline [" + DoubleToStr(Alpha, 2) + "]");
    return (0);
}

int start() {
    if (Bars <= drawBegin)  return (0);
    int countedBars = IndicatorCounted();
    if (countedBars < 0) return (-1);
    if (countedBars > 0) countedBars--;
    int s, limit = Bars - countedBars - 1;
    for (s = limit; s >= 0; s--) {
        ITrend[s] = (Alpha - Alpha * Alpha / 4.0) * P(s)
            + 0.5 * Alpha * Alpha * P(s + 1)
            - (Alpha - 0.75 * Alpha * Alpha) * P(s + 2)
            + 2.0 * (1.0 - Alpha) * ITrend[s + 1]
            - (1.0 - Alpha) * (1.0 - Alpha) * ITrend[s + 2];
        if (s > Bars - 8) {
            ITrend[s] = (P(s) + 2.0 * P(s + 1) + P(s + 2)) / 4.0;
        }
        Trigger[s] = 2.0 * ITrend[s] - ITrend[s + 2];
    }
    return (0);
}

double P(int index) {
    return ((High[index] + Low[index]) / 2.0);
}

void initBuffer(double array[], string label = "", int type = DRAW_NONE, int arrow = 0, int style = EMPTY, int width = EMPTY, color clr = CLR_NONE) {
    SetIndexBuffer(buffers, array);
    SetIndexLabel(buffers, label);
    SetIndexEmptyValue(buffers, EMPTY_VALUE);
    SetIndexDrawBegin(buffers, drawBegin);
    SetIndexShift(buffers, 0);
    SetIndexStyle(buffers, type, style, width);
    SetIndexArrow(buffers, arrow);
    buffers++;
}
Comments