Inverse fisher transform of RSI
Download script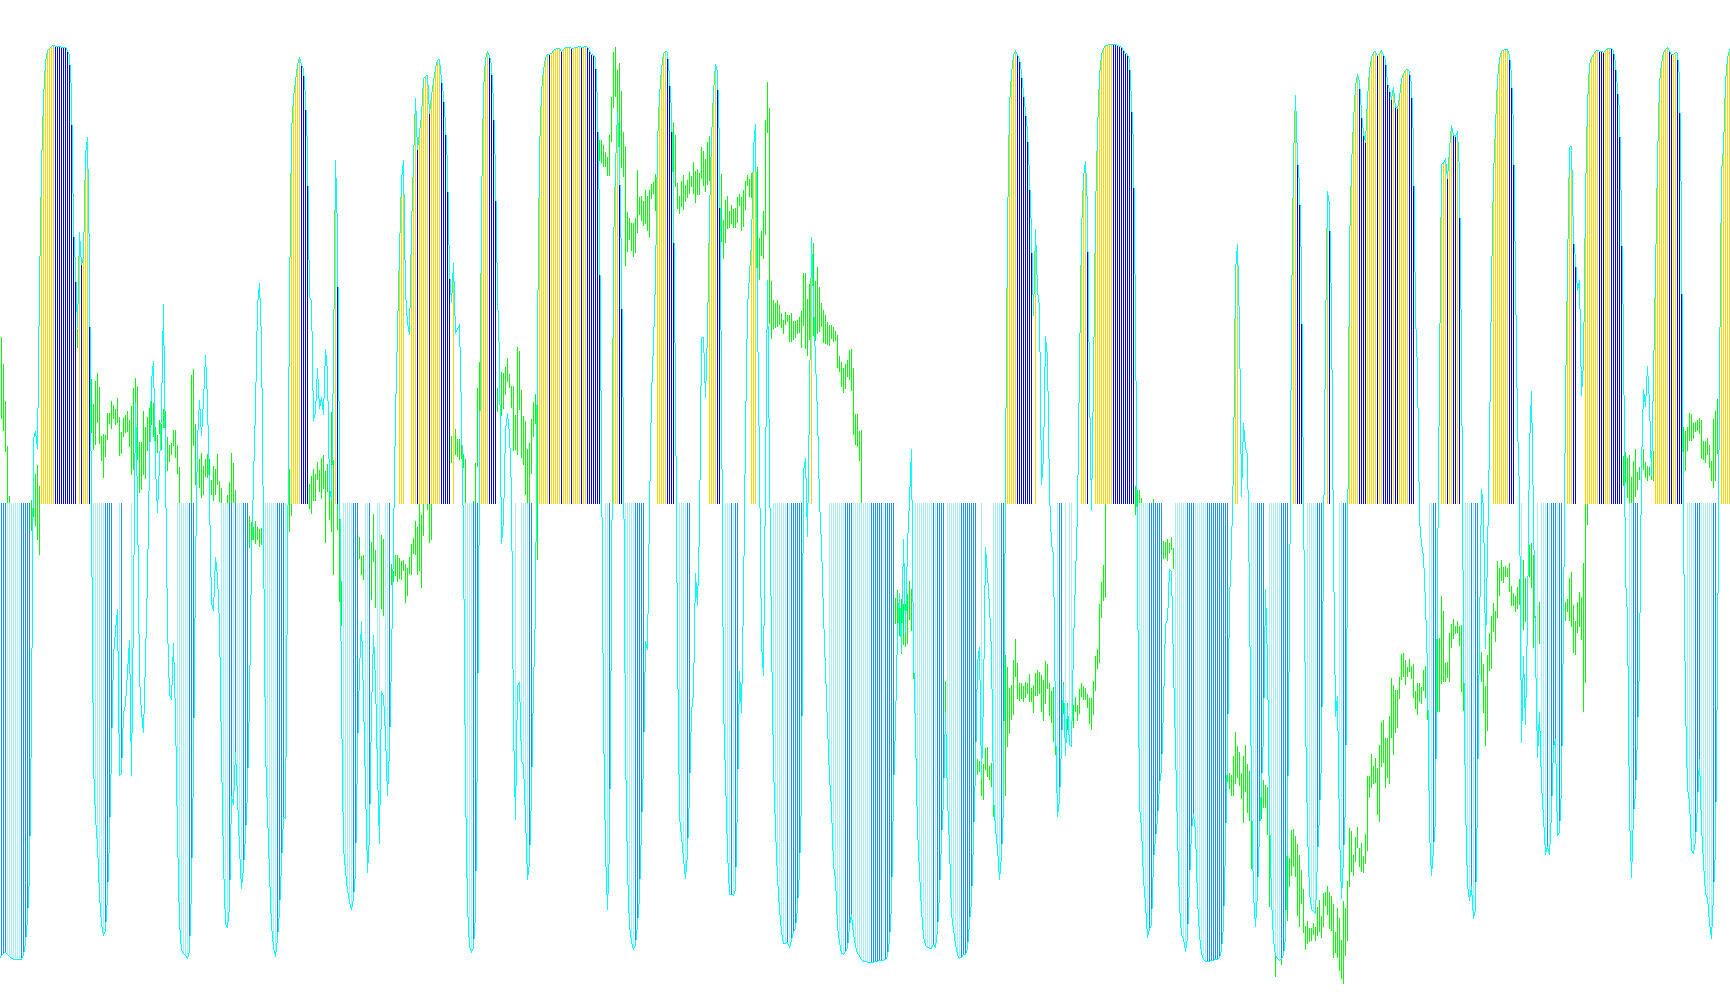
This script is a specialized technical analysis tool designed to provide visual clarity on market momentum. It works by combining several mathematical layers to transform standard price data into a more refined "oscillator" that highlights directional shifts and potential trend extremes.
Here is the step-by-step logic of how the indicator processes data:
1. Data Foundation (The RSI Base)
The process begins with the Relative Strength Index (RSI), a standard tool used to measure whether an asset is being pushed up or down too quickly. The script takes this raw RSI value and centers it around a zero-point. By adjusting the data in this way, the script creates a baseline that represents "neutral" market sentiment.
2. Smoothing (The Moving Average)
To prevent the indicator from reacting too aggressively to tiny, insignificant price flickers (market "noise"), the script applies a Moving Average. This smooths out the raw RSI data, ensuring that the resulting line reflects broader trends rather than momentary spikes. It creates a more stable flow of information for the user to follow.
3. The Inverse Fisher Transformation
The most unique part of this logic is the application of the Inverse Fisher Transform. This is a mathematical formula used to "normalize" the data. In plain terms, it takes large swings in price and compresses them into a tighter, more readable range (typically between -1 and 1). This makes it much easier for a trader to identify when a trend is reaching an extreme point or when momentum is beginning to exhaust itself.
4. Visual Filtering & Histogram Logic
The script then translates these numbers into a visual Histogram. It identifies specific behaviors in the data:
- Directional Shifts: The logic compares the current value to the previous one. If the value is moving higher or lower, it assigns colors accordingly (Green for upward momentum and Red for downward).
- Static Points: If the value does not change between bars, the script holds the previous visual state to ensure a continuous look.
5. Zone Identification & Boundaries
Finally, the script manages the visual environment of the indicator:
- Dynamic Zones: It creates specific background zones (shaded areas) to help users identify "neutral" territory versus "extreme" territory.
- Automatic Scaling: It ensures that the boundaries of the indicator window stay consistent so that the visual scale doesn't jump around while the price is moving, providing a steady and reliable view for the user.
Summary for the User
Essentially, this script takes raw market volatility, cleans it of noise, compresses it into a manageable range, and paints it as a color-coded histogram. This allows you to see not just if the price is moving, but the intensity and strength of that movement relative to historical norms.
//+------------------------------------------------------------------+
//|                              Inverse fisher transform of RSI.mq4 |
//|                                                           mladen |
//+------------------------------------------------------------------+
#property  copyright "mladen"
#property  link      "mladenfx@gmail.com"

#property  indicator_separate_window
#property  indicator_buffers   5
#property  indicator_color1    Green
#property  indicator_color2    Green
#property  indicator_color3    Red
#property  indicator_color4    Red
#property  indicator_color5    DimGray
#property  indicator_width1    2
#property  indicator_width3    2
#property  indicator_width5    2
#property  indicator_maximum   1
#property  indicator_minimum  -1

//
//
//
//
//

extern int    RSIPeriod     =  5;
extern int    RSIPrice      =  PRICE_CLOSE;
extern int    MAPeriod      =  9;
extern int    MAMode        =  MODE_LWMA;
extern bool   ShowHistogram =  true;
extern bool   ShowLevels    =  true;
extern double Level1        =  0.5;
extern double Level2        =  0.0;
extern double Level3        = -0.5;
extern color  ZoneColor     = C'30,33,36';

//
//
//
//
//

double   buffer1[];
double   buffer2[];
double   buffer3[];
double   buffer4[];
double   buffer5[];
double   buffer6[];
double   buffer7[];

//
//
//
//
//

string ShortName;

//+------------------------------------------------------------------+
//|                                                                  |
//+------------------------------------------------------------------+
//
//
//
//
//

int init()
{
   IndicatorBuffers(7);
   SetIndexBuffer(0,buffer1);
   SetIndexBuffer(1,buffer2);
   SetIndexBuffer(2,buffer3);
   SetIndexBuffer(3,buffer4);
   SetIndexBuffer(4,buffer5);
   SetIndexBuffer(5,buffer6);
   SetIndexBuffer(6,buffer7);
      SetIndexStyle(0,DRAW_HISTOGRAM);
      SetIndexStyle(1,DRAW_HISTOGRAM);
      SetIndexStyle(2,DRAW_HISTOGRAM);
      SetIndexStyle(3,DRAW_HISTOGRAM);

   //
   //
   //
   //
   //

   ShortName=MakeUniqueName("Inverse fisher RSI "," ("+RSIPeriod+","+MAPeriod+")");
   IndicatorShortName(ShortName);
   return(0);
}
int deinit()
{
   DeleteBounds();
   return(0);
}

//+------------------------------------------------------------------+
//|                                                                  |
//+------------------------------------------------------------------+
//
//
//
//
//

int start()
{
   int    limit, i;
   int    counted_bars=IndicatorCounted();

   if(counted_bars<0) return(-1);
   if(counted_bars>0) counted_bars--;
           limit=Bars-counted_bars;

   //
   //
   //
   //
   //

   for(i=limit; i>=0; i--) buffer7[i] = 0.1*(iRSI(NULL,0,RSIPeriod,RSIPrice,i)-50);
   for(i=limit; i>=0; i--)
   {
      buffer6[i] = iMAOnArray(buffer7,0,MAPeriod,0,MAMode,i);
      buffer5[i] = (MathExp(2*buffer6[i])-1)/(MathExp(2*buffer6[i])+1);

      //
      //
      //
      //
      //

      if(ShowHistogram)
      {
         if(buffer5[i]==buffer5[i+1])
         {
            buffer1[i]=buffer1[i+1];
            buffer2[i]=buffer2[i+1];
            buffer3[i]=buffer3[i+1];
            buffer4[i]=buffer4[i+1];
               continue;
         }

         //
         //
         //
         //
         //

            buffer1[i]=EMPTY_VALUE;
            buffer2[i]=EMPTY_VALUE;
            buffer3[i]=EMPTY_VALUE;
            buffer4[i]=EMPTY_VALUE;
            if(ShowLevels)
               if((buffer5[i]<Level1) && (buffer5[i]>Level3))
                  continue;

            //
            //
            //
            //
            //

            if(buffer5[i]<0)
            {
               if (buffer5[i]<buffer5[i+1]) buffer3[i]=buffer5[i];
               if (buffer5[i]>buffer5[i+1]) buffer4[i]=buffer5[i];
            }
            if(buffer5[i]>0)
            {
               if (buffer5[i]<buffer5[i+1]) buffer2[i]=buffer5[i];
               if (buffer5[i]>buffer5[i+1]) buffer1[i]=buffer5[i];
            }
      }
   }

   //
   //
   //
   //
   //

   if (ShowLevels) UpdateBounds();
   return(0);
}

//+------------------------------------------------------------------+
//|                                                                  |
//+------------------------------------------------------------------+
//
//
//
//
//

string MakeUniqueName(string first, string rest)
{
   string result = first+(MathRand()%1001)+rest;

   while (WindowFind(result)> 0)
          result = first+(MathRand()%1001)+rest;
   return(result);
}


//+------------------------------------------------------------------+
//|                                                                  |
//+------------------------------------------------------------------+
//
//
//
//
//

void DeleteBounds()
{
   ObjectDelete(ShortName+"-1");
   ObjectDelete(ShortName+"-2");
   ObjectDelete(ShortName+"-3");
}
void UpdateBounds()
{
   SetUpBound(ShortName+"-1",1          ,Level1);
   SetUpBound(ShortName+"-2",Level2*1.01,Level2*0.99);
   SetUpBound(ShortName+"-3",Level3     ,      -1.00);
}
void SetUpBound(string name, double up, double down)
{
   if (ObjectFind(name) == -1)
      {
         ObjectCreate(name,OBJ_RECTANGLE,WindowFind(ShortName),0,0);
         ObjectSet(name,OBJPROP_PRICE1,up);
         ObjectSet(name,OBJPROP_PRICE2,down);
         ObjectSet(name,OBJPROP_COLOR,ZoneColor);
         ObjectSet(name,OBJPROP_BACK,true);
         ObjectSet(name,OBJPROP_TIME1,iTime(NULL,0,Bars-1));
      }
   if (ObjectGet(name,OBJPROP_TIME2) != iTime(NULL,0,0))
       ObjectSet(name,OBJPROP_TIME2,    iTime(NULL,0,0));
}
Comments