Internal bar strength
Download script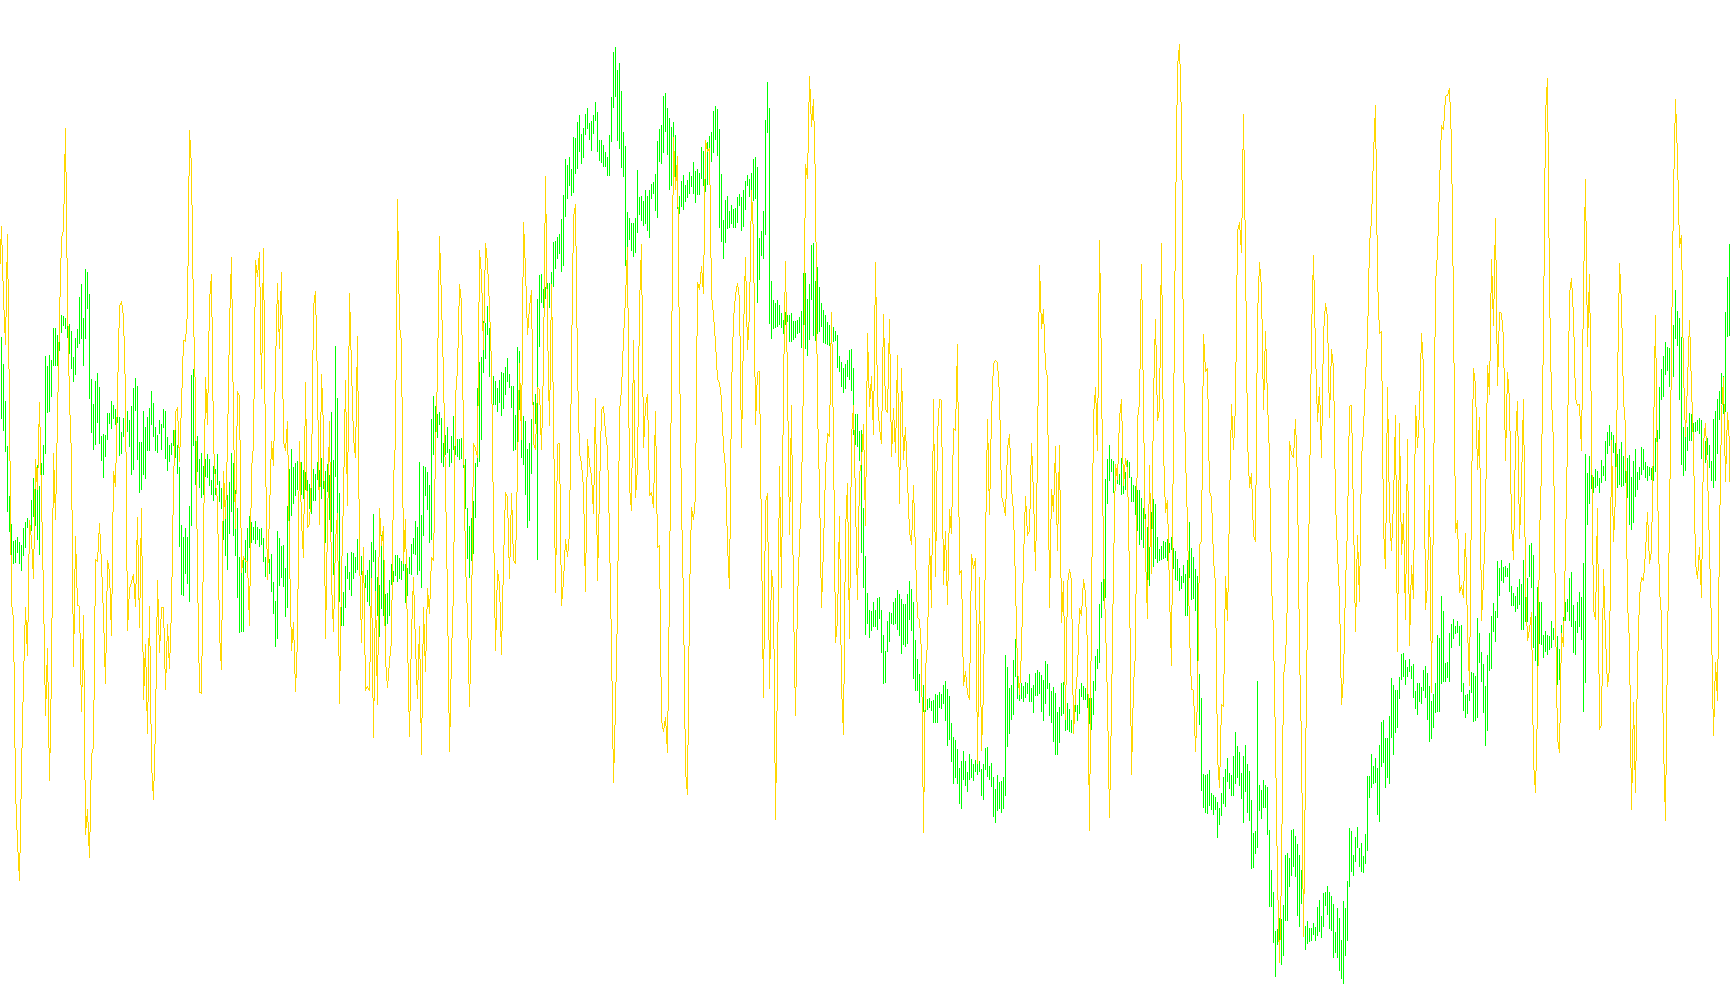
This tool is designed to provide traders with a visual representation of the "internal strength" of price bars on a currency chart. Instead of looking at complex price movements, it simplifies the market's behavior into a percentage-based score, helping you see who is currently in control: the buyers or the sellers.
How the Logic Works
The script processes the data through two primary stages to arrive at its final output:
1. Calculating Relative Bar Strength First, the script looks at each individual candle (bar) on your chart. It measures where the closing price sits relative to the total range of that candle (the distance between the highest point and the lowest point).
- If a candle closes near its high point, it indicates strong buying pressure.
- If a candle closes near its low point, it indicates strong selling pressure.
- The result is converted into a ratio. For example, if a candle covers a large range but closes halfway up, it receives a neutral score.
2. Smoothing the Data for Trends Because individual bars can sometimes be "noisy" or erratic, the script takes these raw strength scores and applies a Moving Average. This averages out the data over a specific timeframe (defined by the period setting). By doing this, the tool filters out minor fluctuations to reveal a smoother, more consistent trend line of market sentiment.
How to Interpret the Results
The final output is displayed in a separate window as a line graph scaled from 0 to 100:
- Higher Values (Towards 100): Represent dominant bullish momentum. This suggests that buyers are pushing the price higher and closing candles with strength.
- Lower Values (Towards 0): Represent dominant bearish momentum. This suggests that sellers are taking control and pushing the price lower.
- The Mid-Range: Areas near the center suggest a balanced market where neither side has a clear advantage, or where the market is处于 consolidation.
Essentially, this tool acts as a "sentiment thermometer," translating raw price action into a readable percentage that helps you identify whether the current trend is being driven by aggressive buying, selling, or equilibrium.
//+------------------------------------------------------------------+
//|                    Written by forex.optimist@gmail.com           |
//+------------------------------------------------------------------+
#property copyright "forex.optimist@gmail.com"
#property link      "forex.optimist@gmail.com"

#property indicator_separate_window
#property indicator_buffers 1
#property indicator_color1 Red
#property indicator_width1 2
#property indicator_level1 40
#property indicator_level2 60
#property indicator_maximum 100
#property indicator_minimum 0
//---- buffers
double B1[];
double B2[];
extern int period=5;

//+------------------------------------------------------------------+
//| Custom indicator initialization function                         |
//+------------------------------------------------------------------+
int init()
  {
//---- indicators
   IndicatorBuffers(2);
   IndicatorShortName("Internal bar strength");
   SetIndexStyle(0,DRAW_LINE);
   SetIndexBuffer(0,B1);
   SetIndexLabel(0, "Internal bar strength");
   SetIndexBuffer(1,B2);
   ArraySetAsSeries(B2,false);
//----
   return(0);
  }
//+------------------------------------------------------------------+
//| Custor indicator deinitialization function                       |
//+------------------------------------------------------------------+
int deinit()
  {
//----

//----
   return(0);
  }
//+------------------------------------------------------------------+
//| Custom indicator iteration function                              |
//+------------------------------------------------------------------+
int start()
  {
     int limit;
     int counted_bars=IndicatorCounted();
     if(counted_bars<0) return(-1);
     if(counted_bars>0) counted_bars-=10;
     limit=Bars-counted_bars;
     for(int i=limit; i>=0; i--)
       {
       if (High[i] != Low[i])
         B2[i]=((Close[i]-Low[i]) / (High[i]-Low[i]));
       else
         B2[i] = B2[i+1];

       }
     for(i=limit; i>=0; i--)
       {
         B1[i] = iMAOnArray(B2,WHOLE_ARRAY,period,0,MODE_SMA,i)*100.0;
       }
  //----
    return(0);
  }
//+------------------------------------------------------------------+
Comments