iVAR
Indicator

iVAR

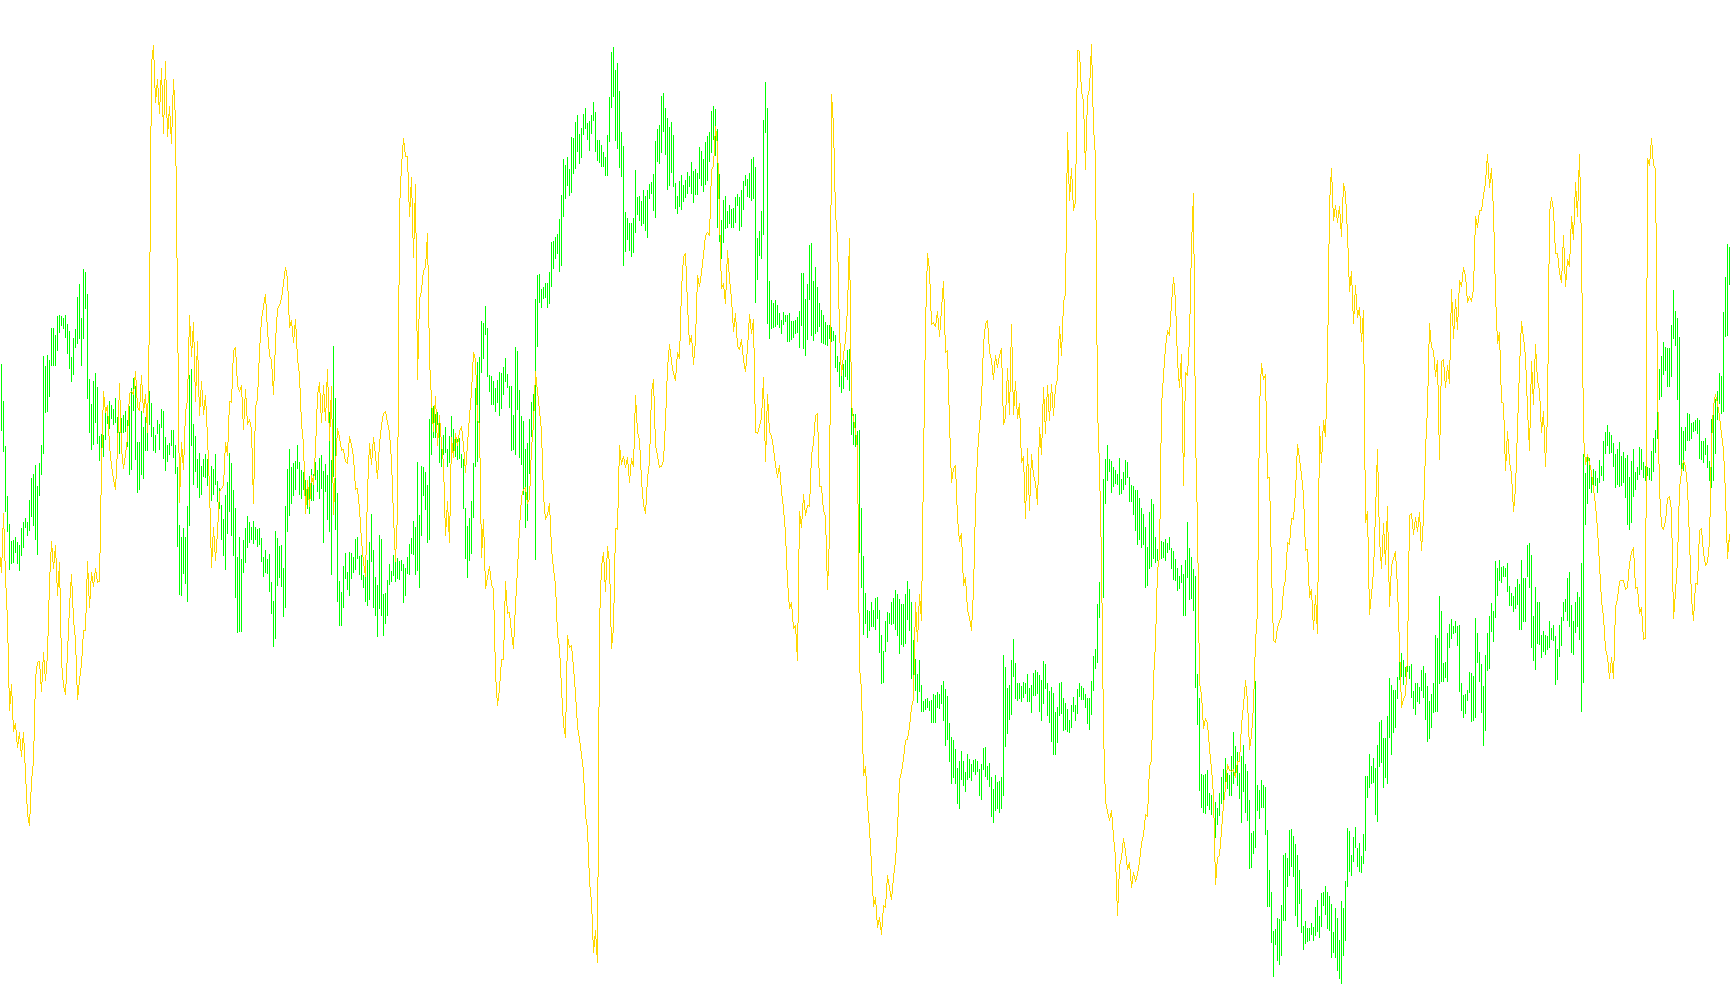
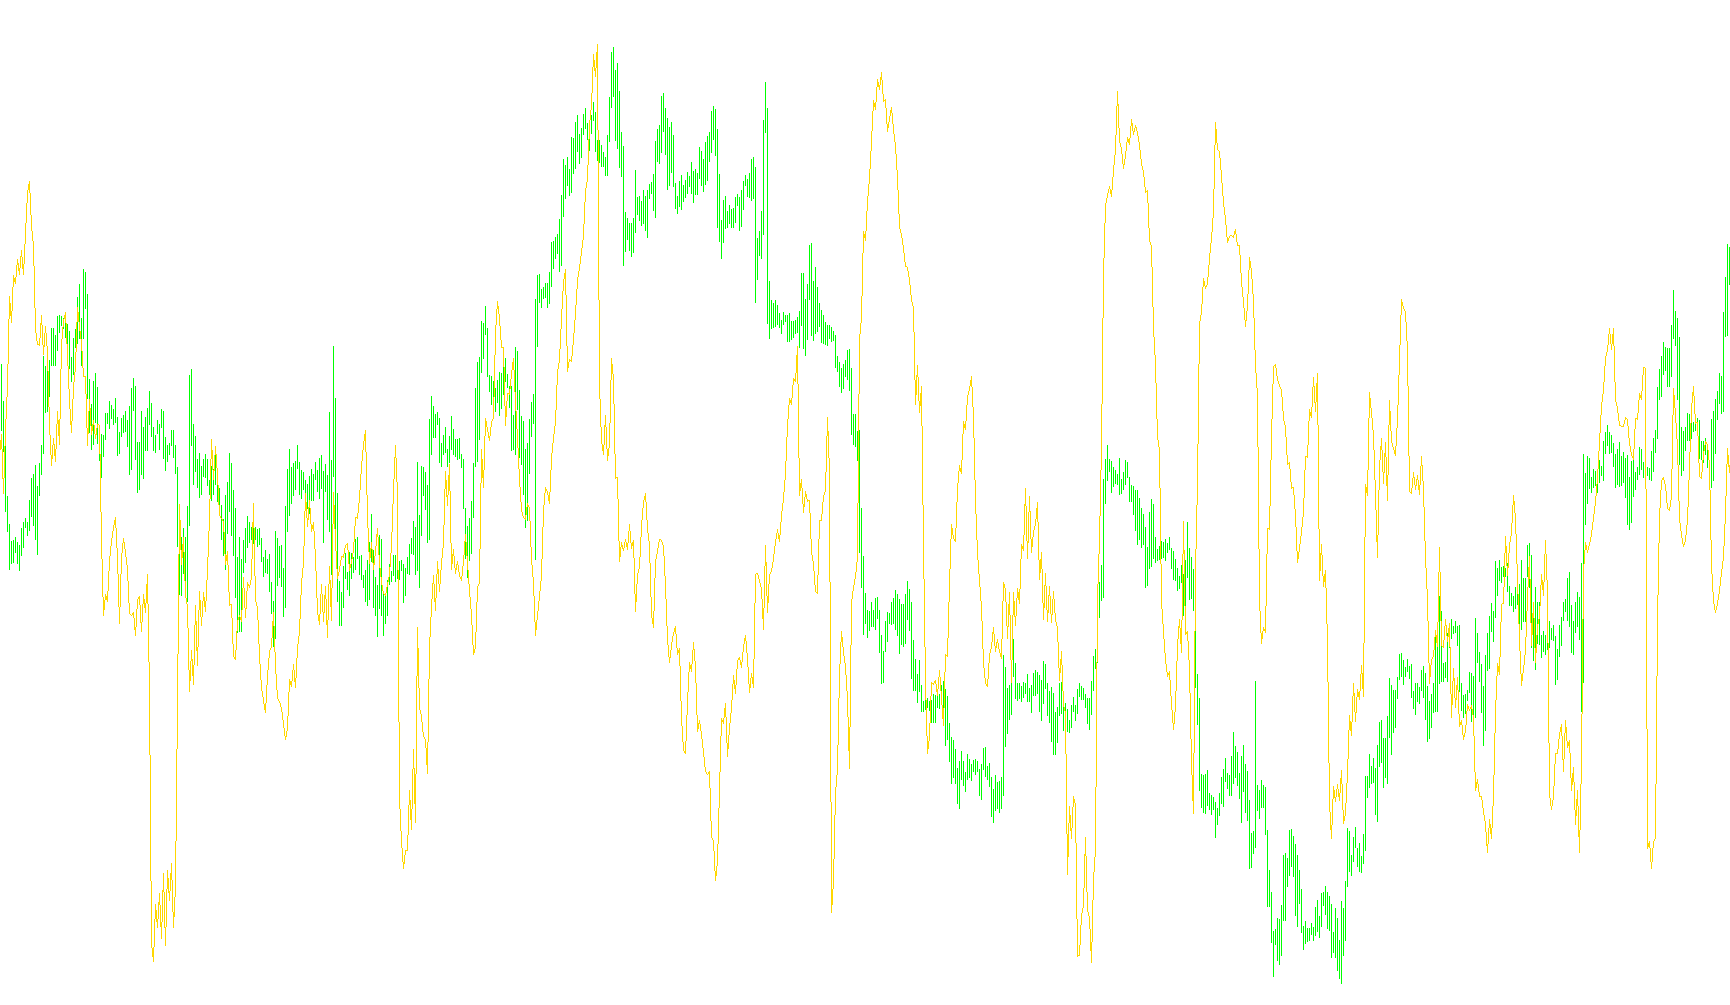
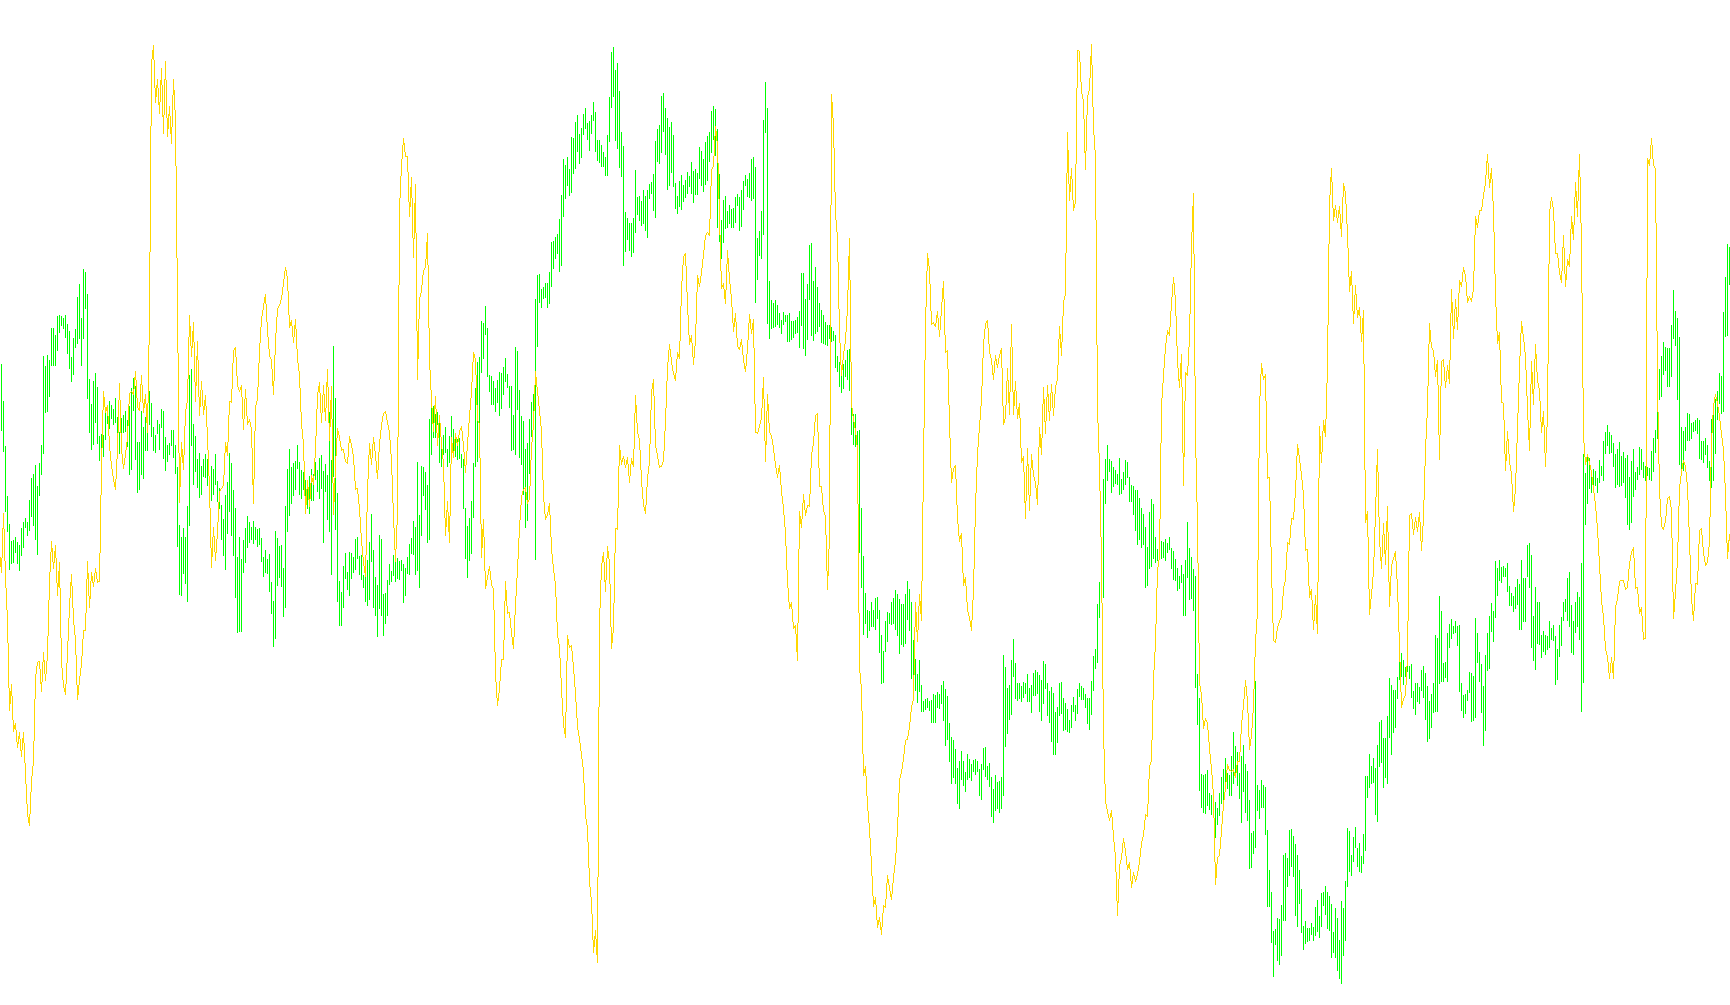
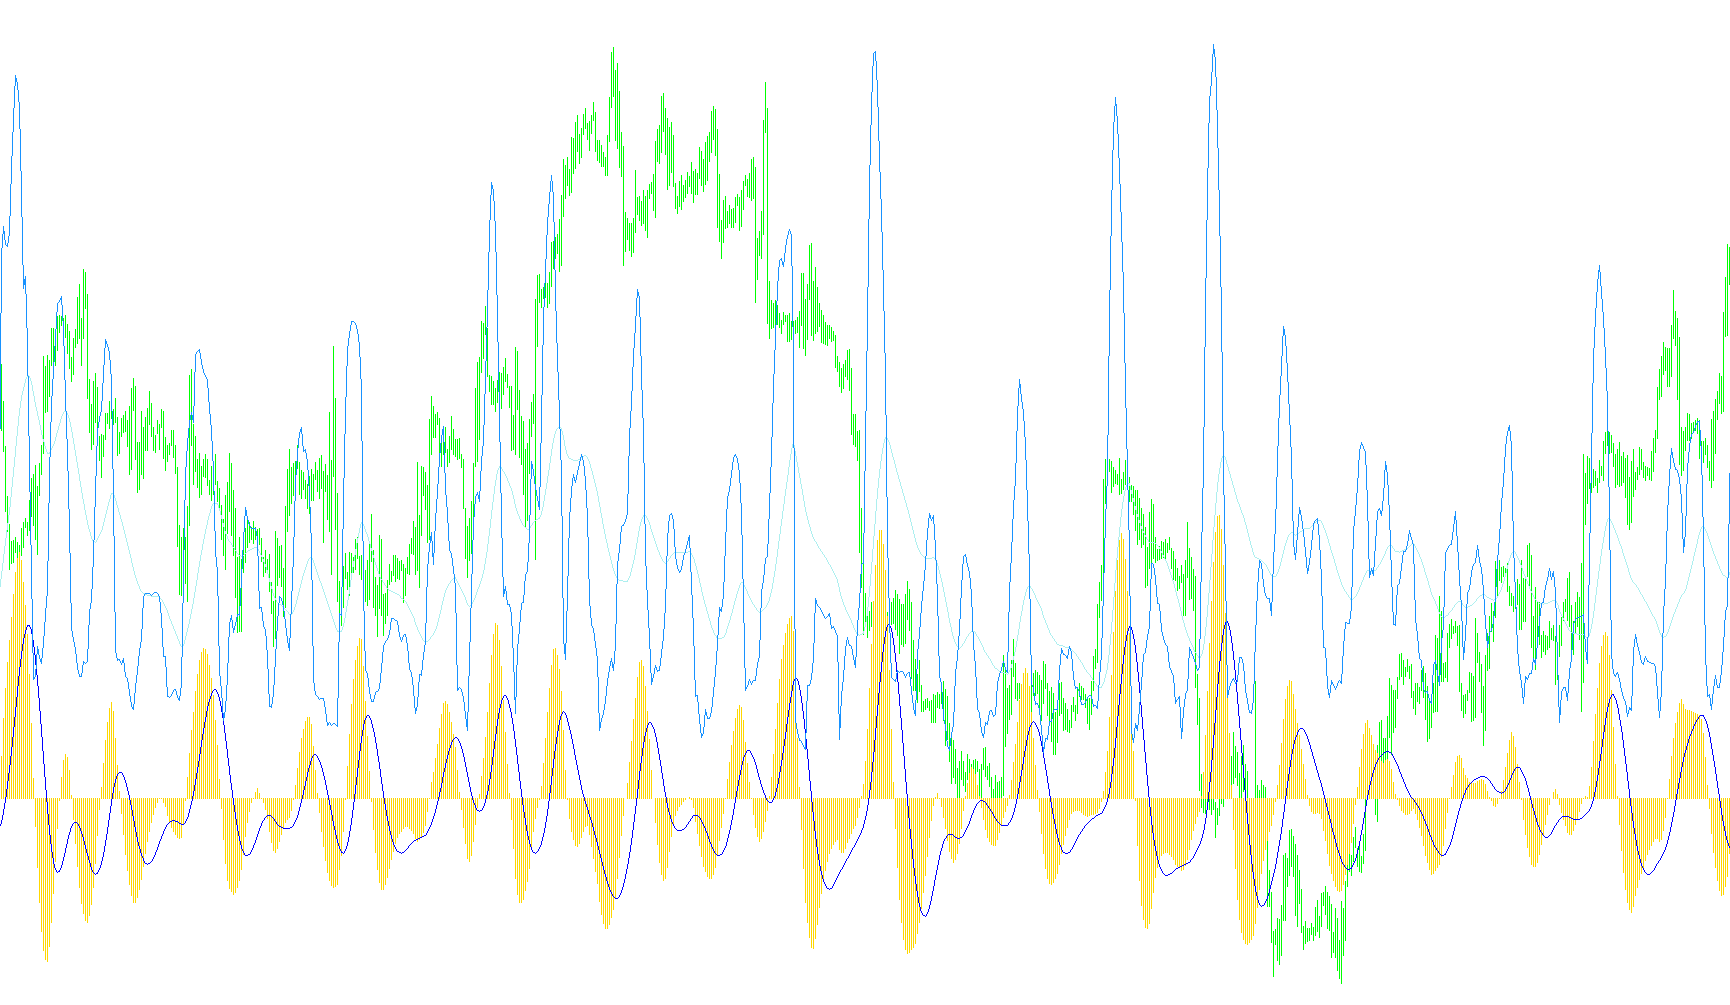
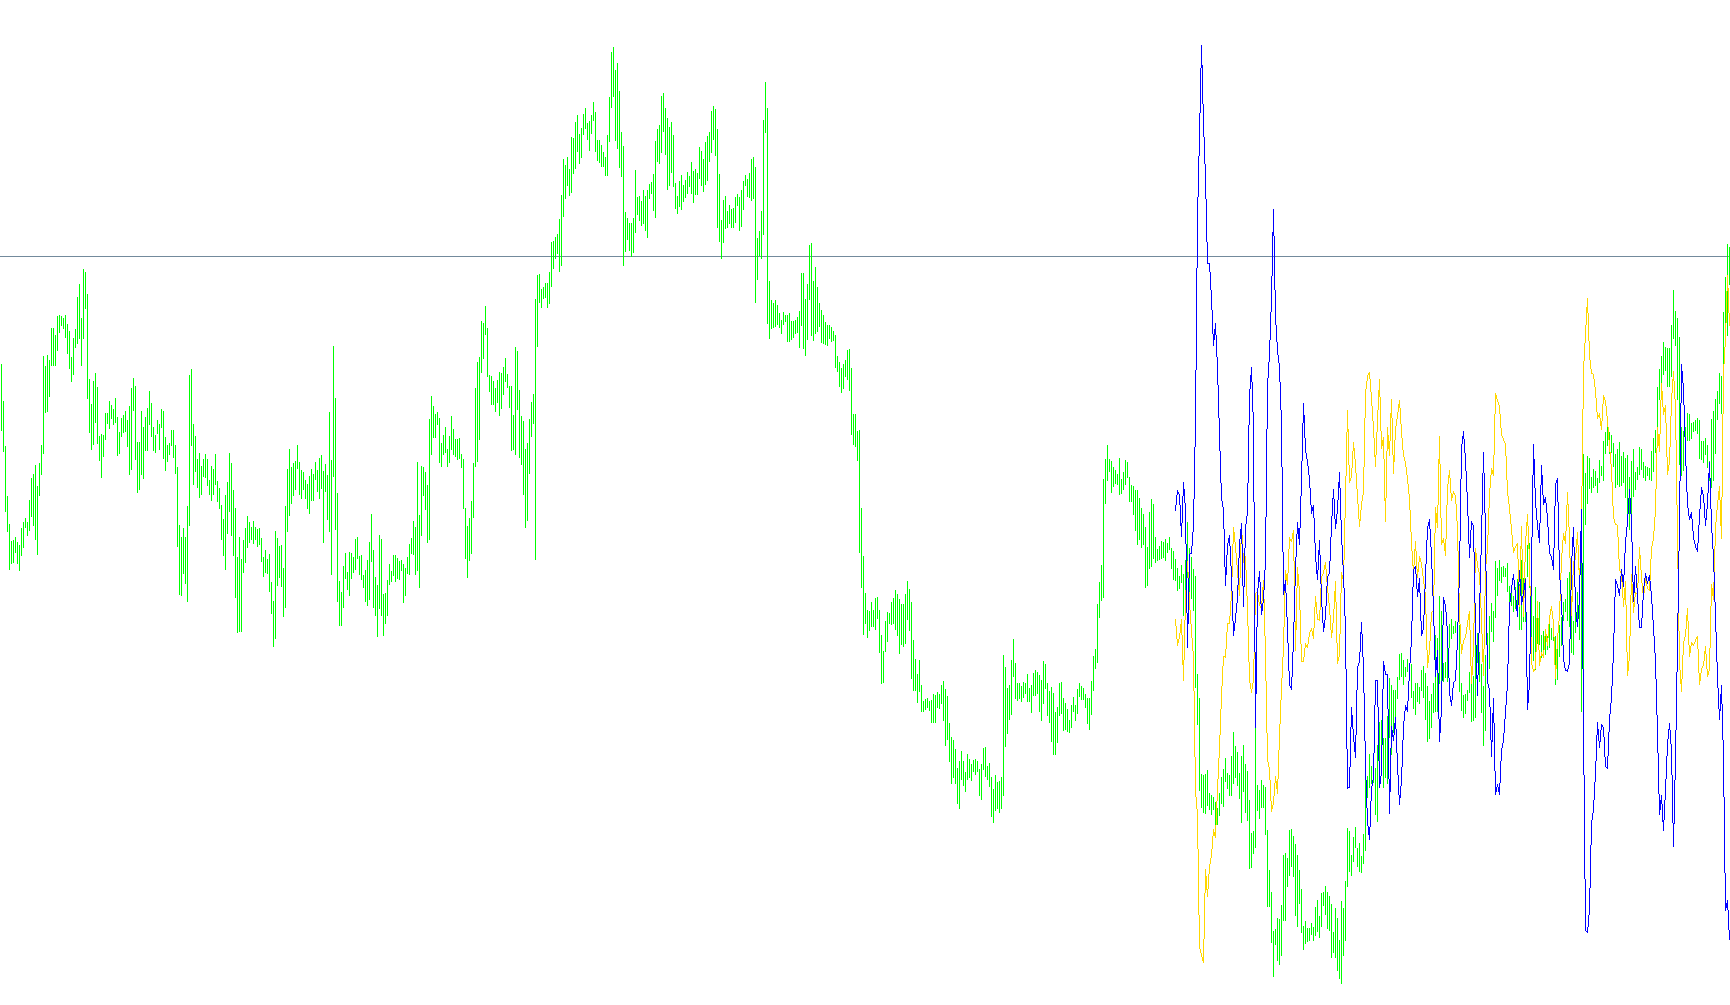
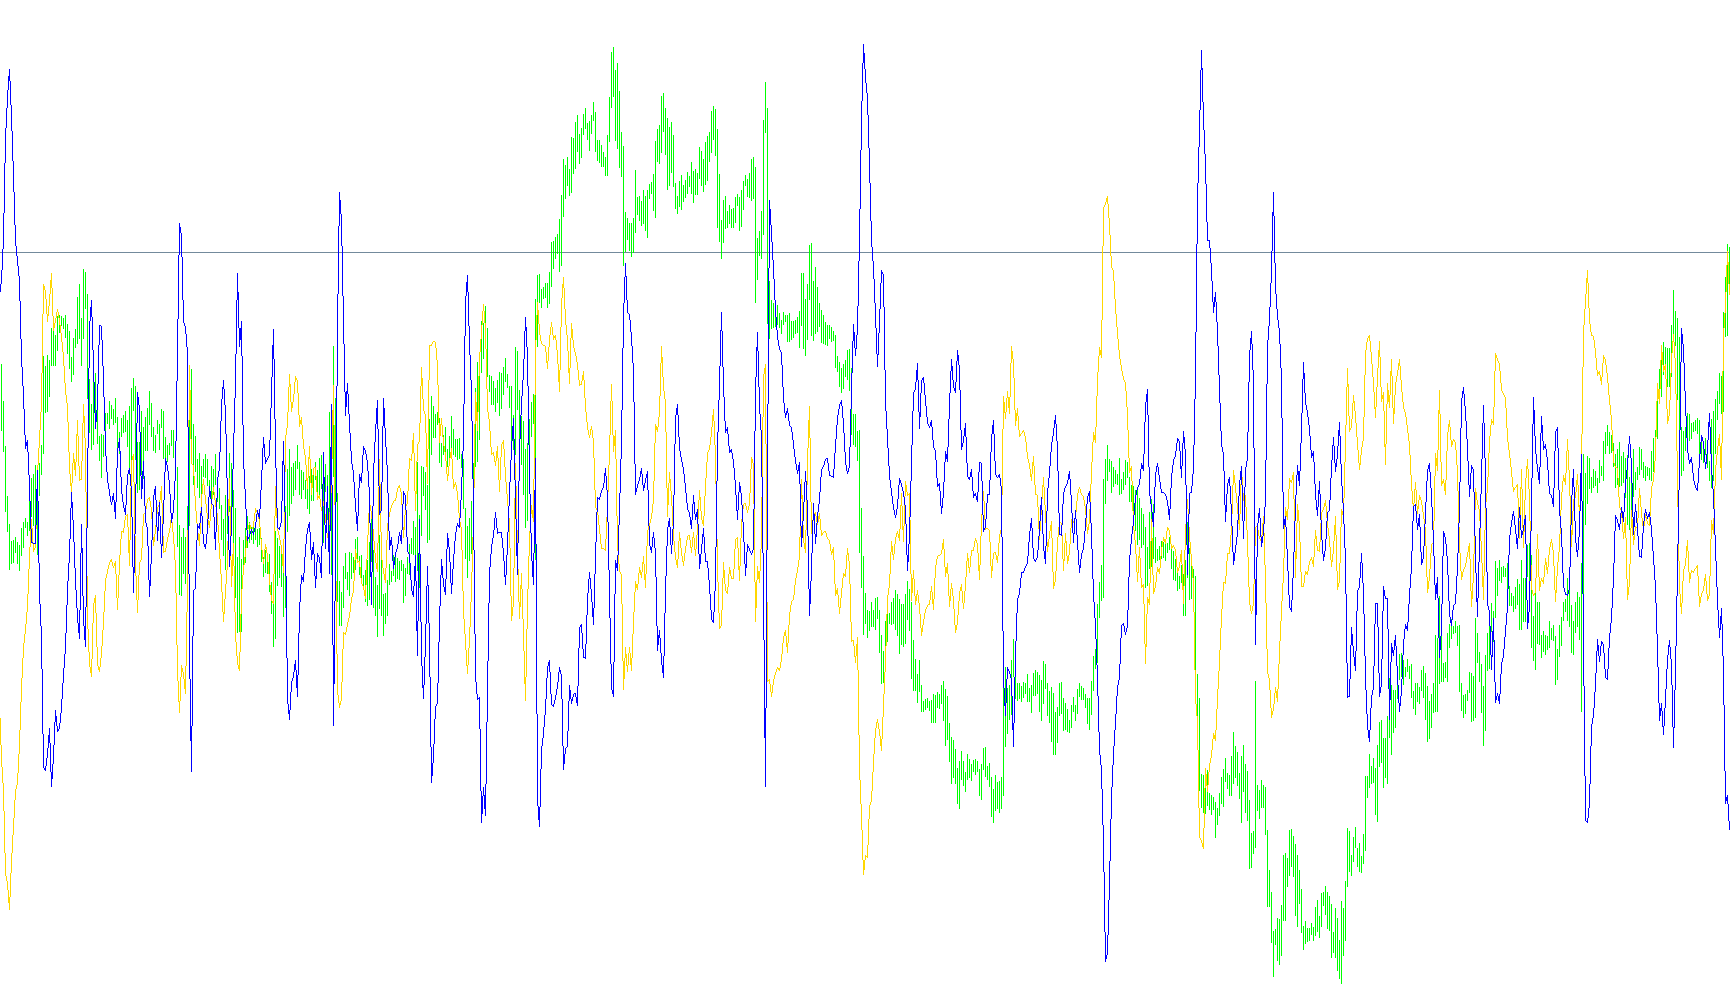
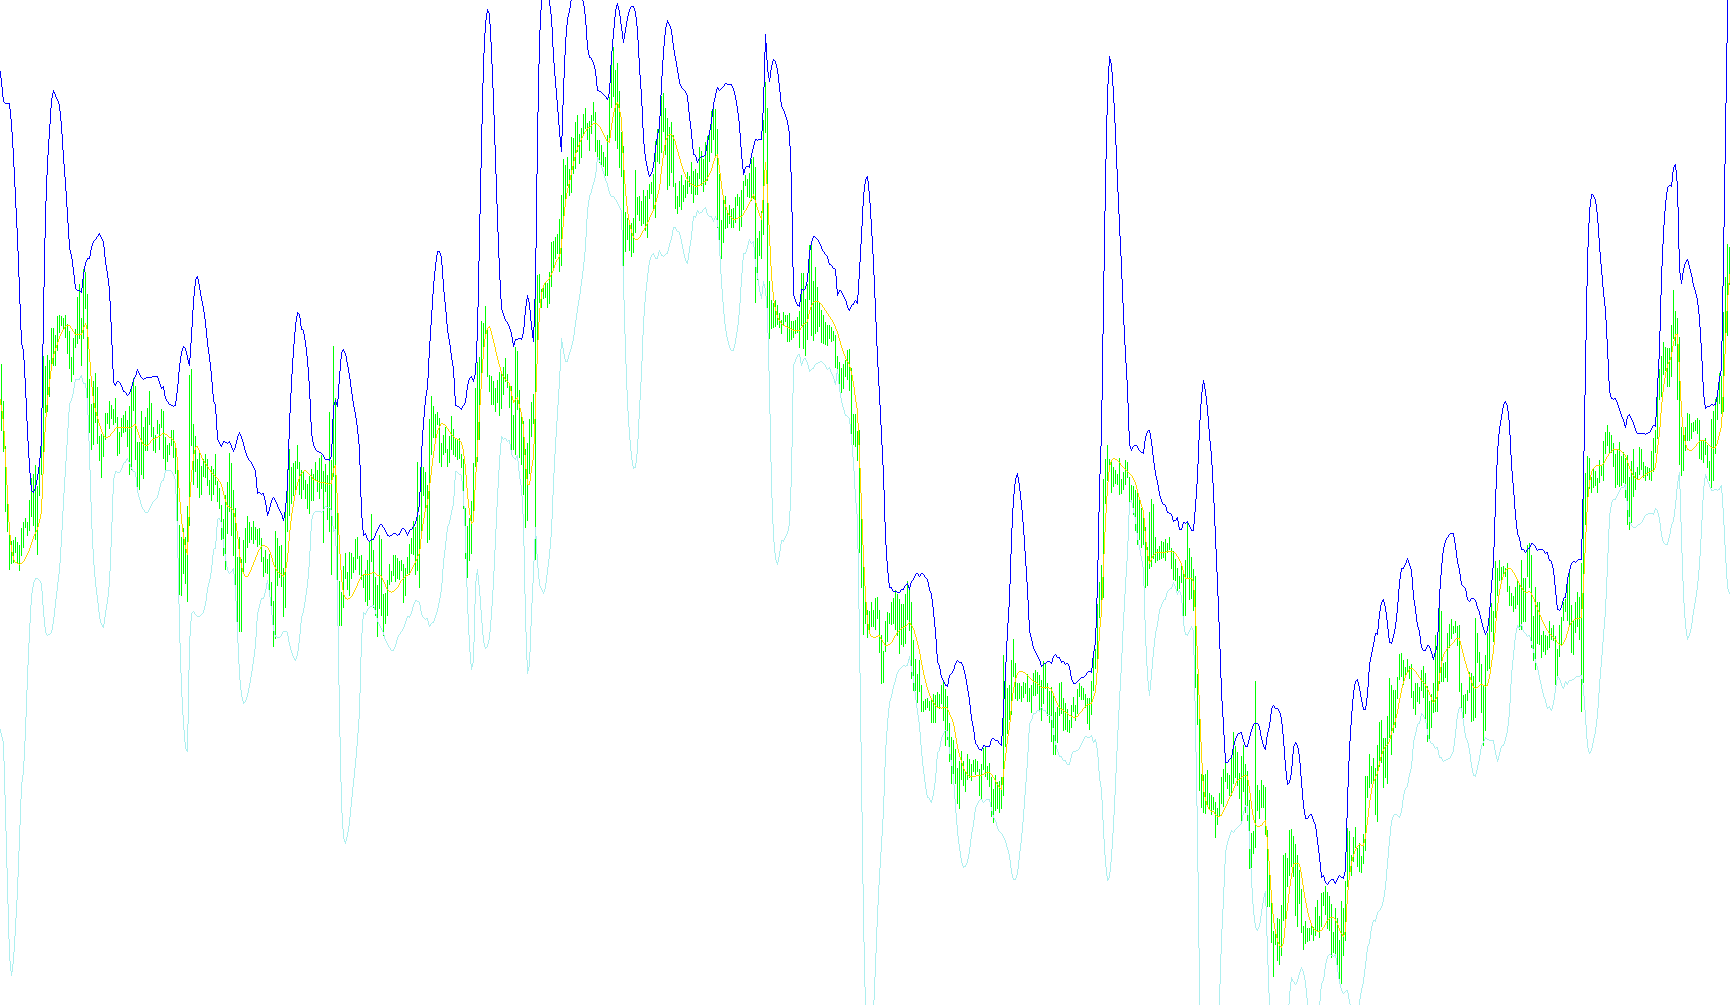
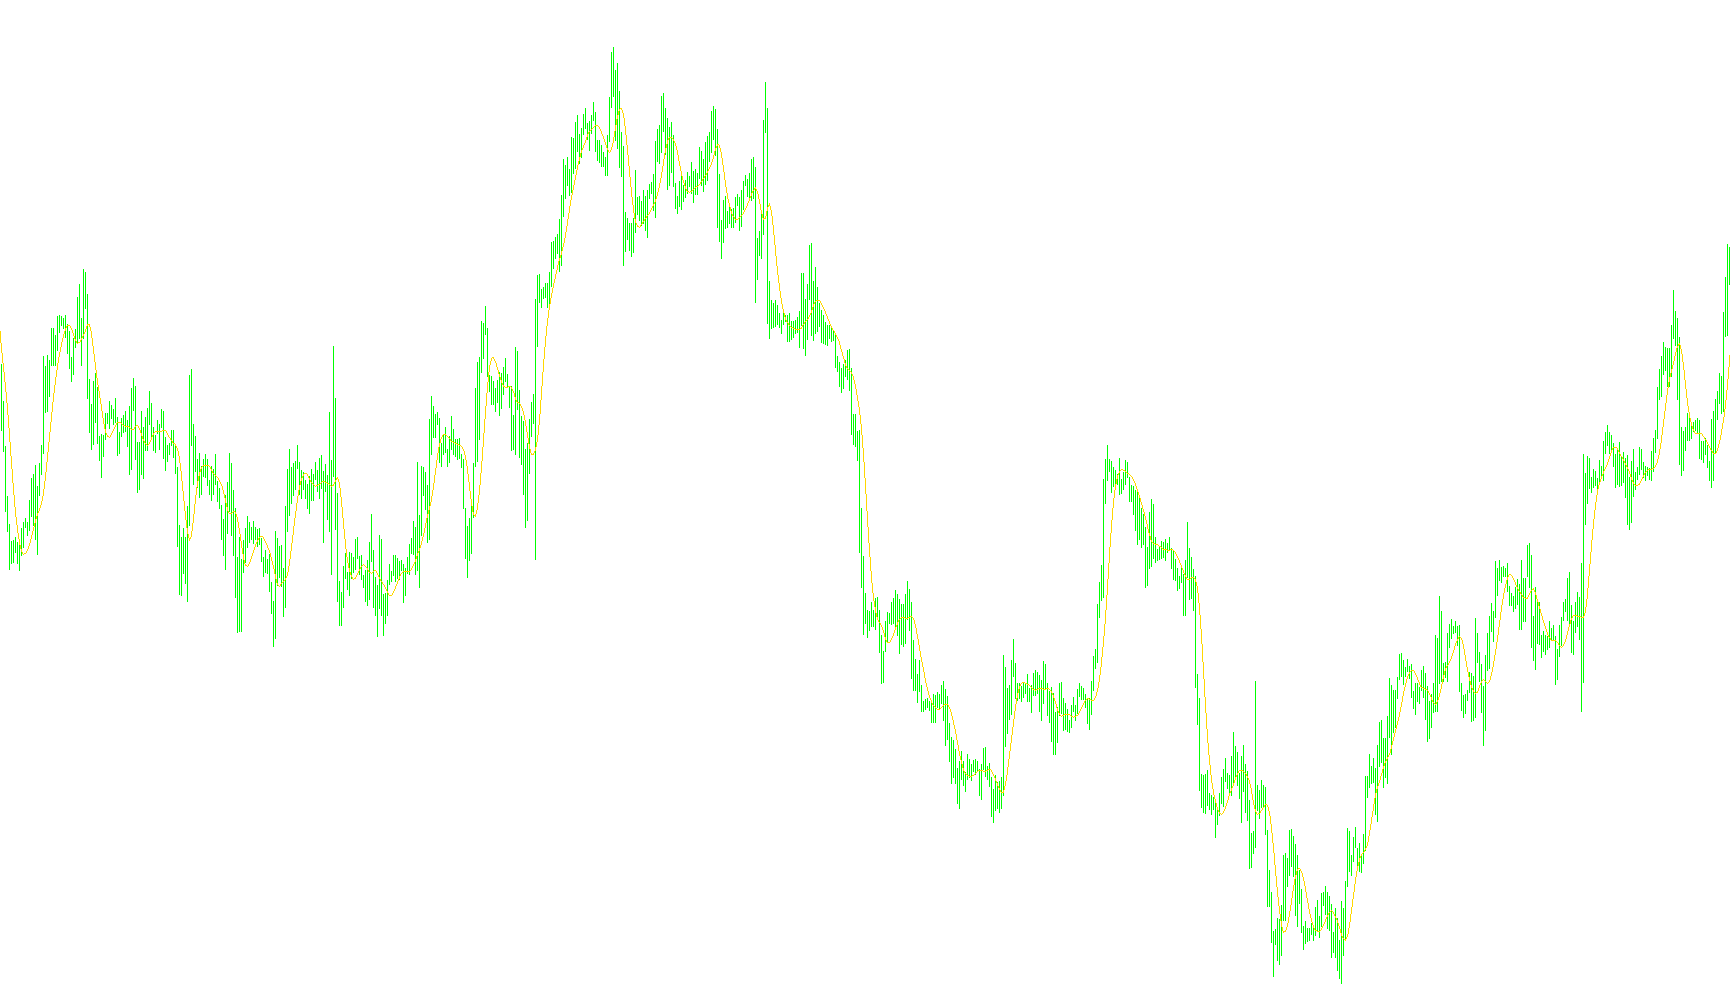
This indicator quantifies price dynamics by calculating the regression coefficient of logarithmic price variations across multi-scale binary intervals to distinguish between trending, flat, or stochastic behaviors.

iVAR1-
Indicator

iVAR1-

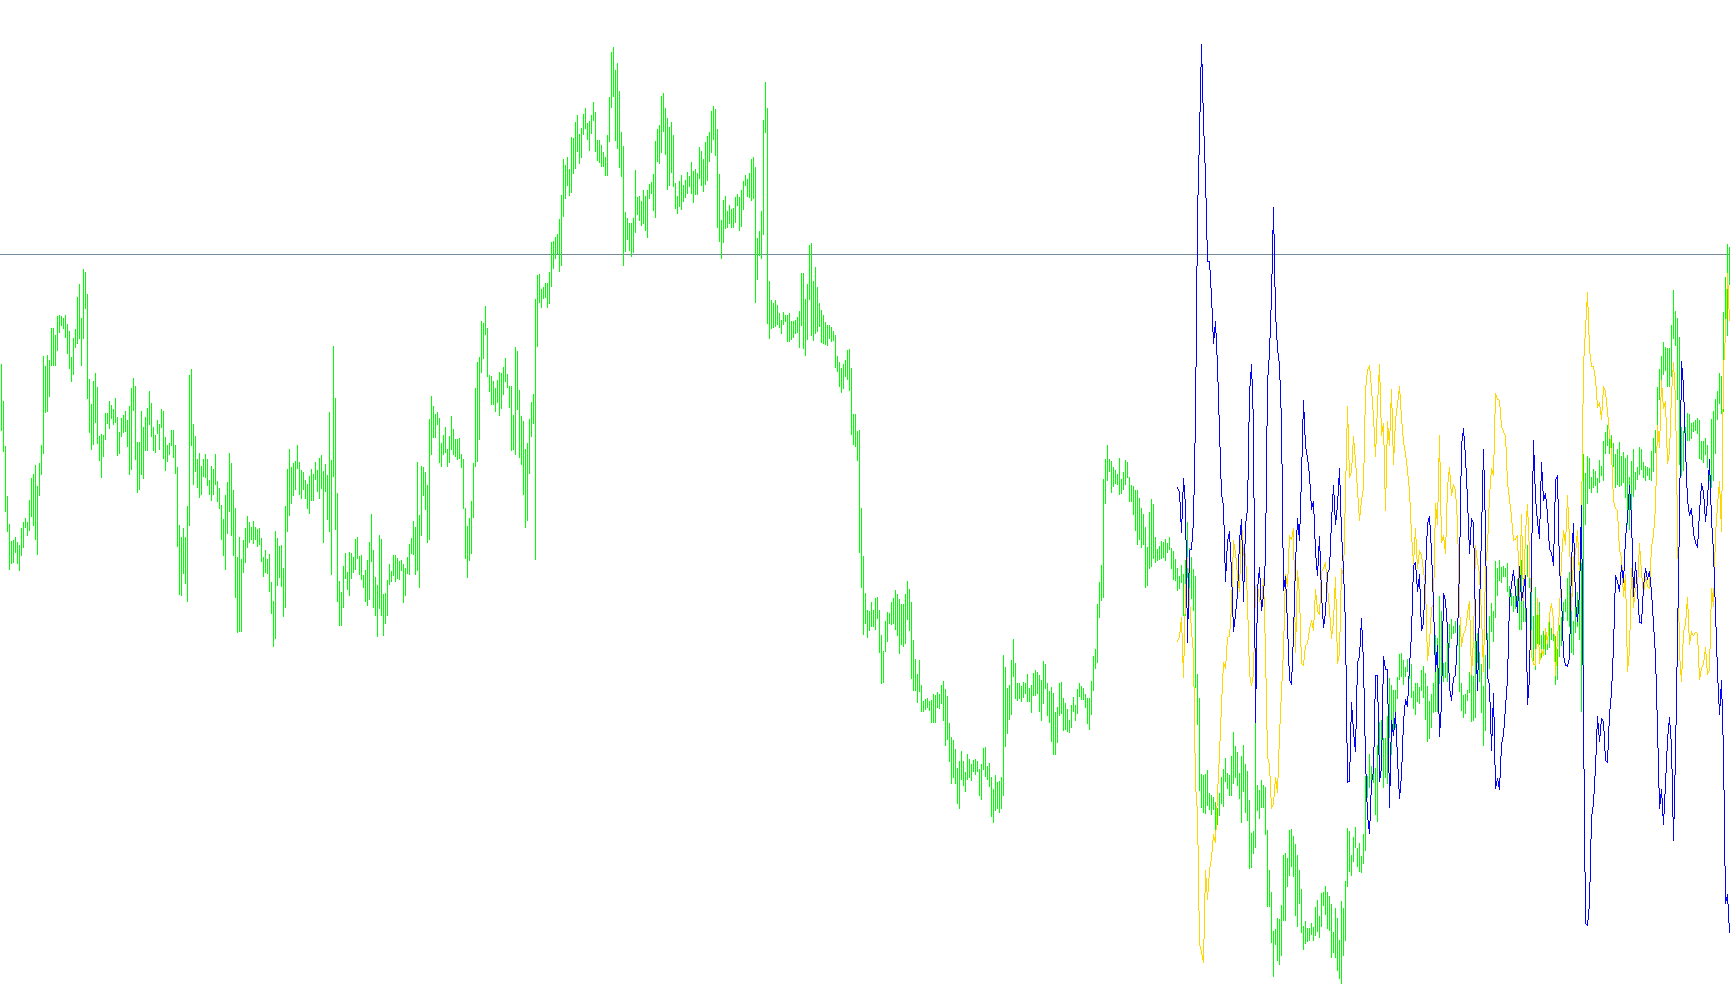
This indicator quantifies the dominance of trend, noise, or stochasticity in a price series by calculating the slope of a regression line based on price range fluctuations over binary power intervals.

iVAR_v1
Indicator

iVAR_v1

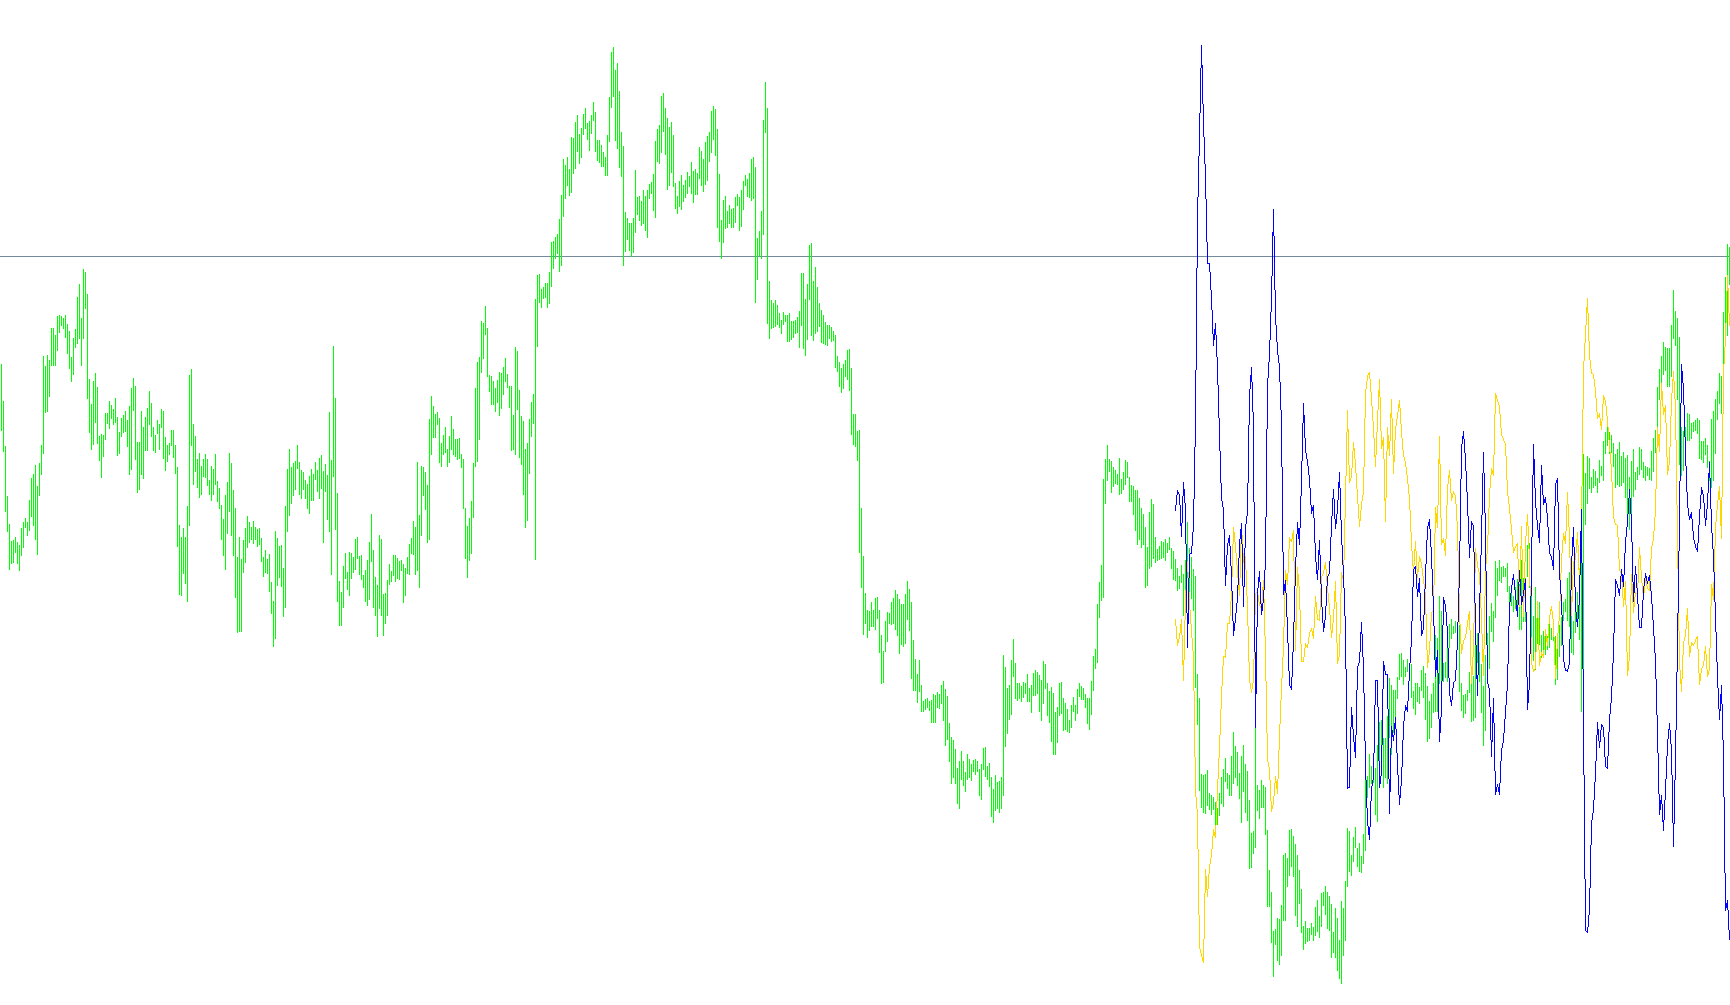
The algorithm calculates the slope of a regression line in double-logarithmic space to distinguish between trending, flat, and stochastic price behavior based on minimum coverage sizes.

iVeryCoolSpectrometr
Indicator

iVeryCoolSpectrometr

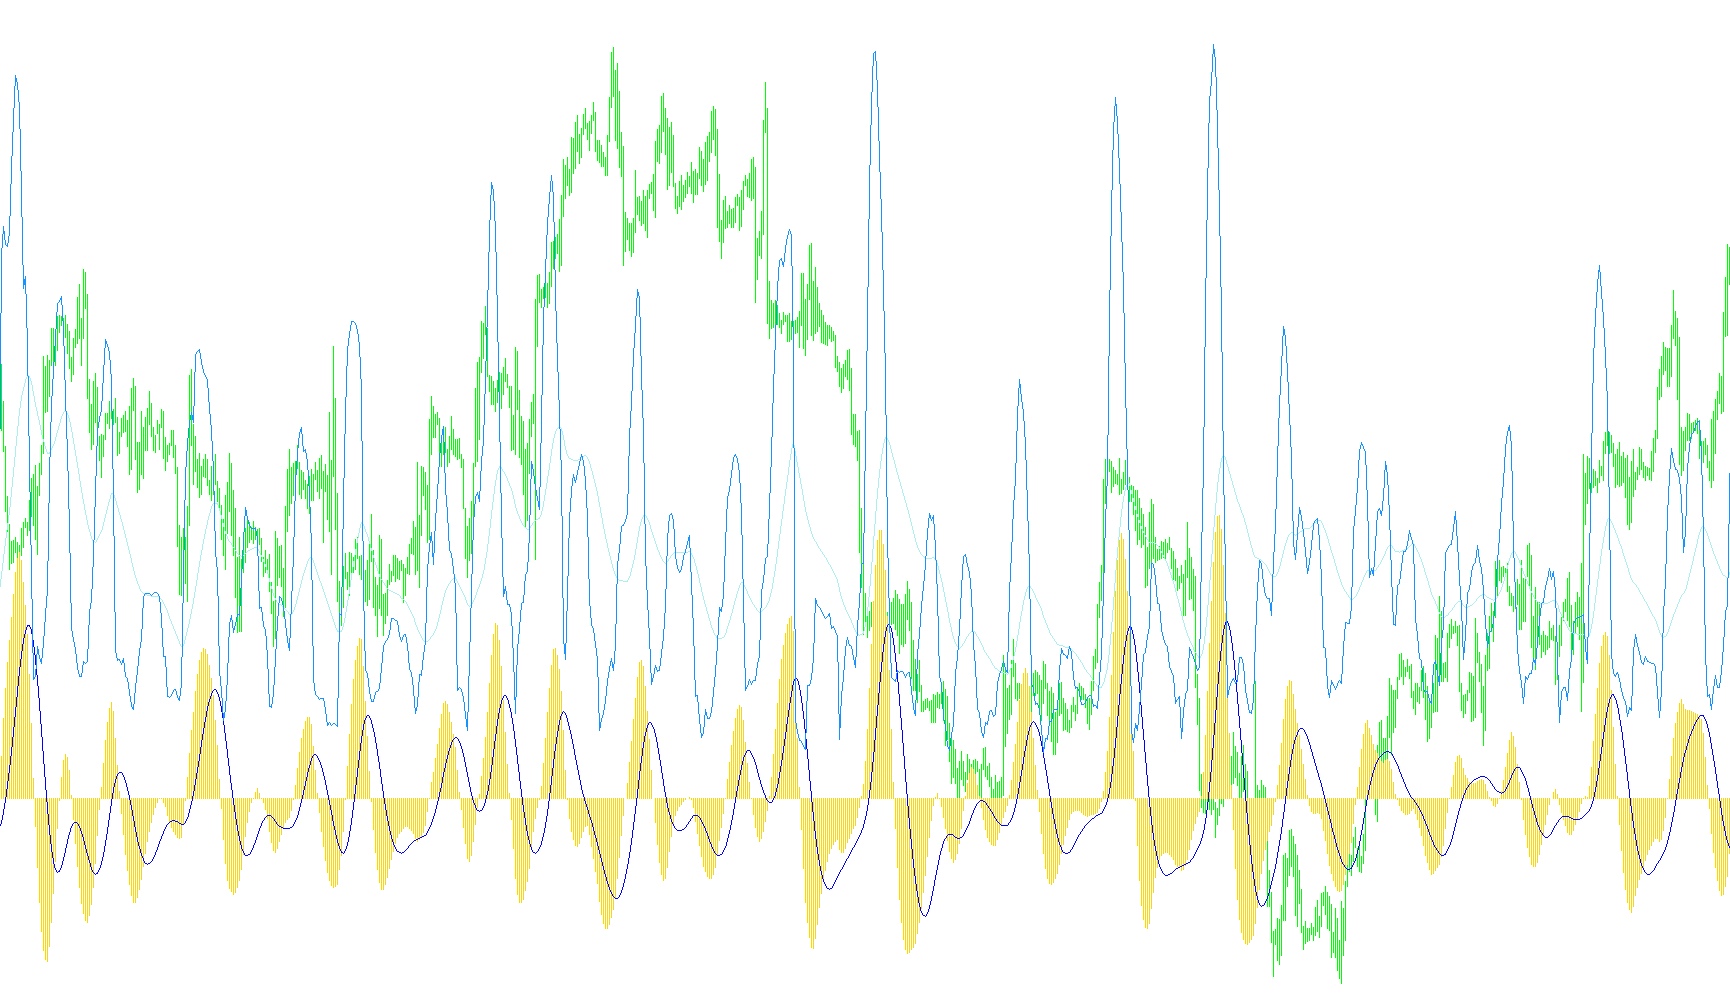
This indicator decomposes price action into frequency components using a Fast Fourier Transform to visualize cyclical patterns and dominant periodicities as a dynamic spectrum.

iWavelet
Indicator

iWavelet

This indicator performs a discrete wavelet transform to decompose price action into multiple nested frequency bands, visualizing market volatility and structural trends through dynamic color-coded rectangular overlays.

i_DCG_Camarilla
Indicator

i_DCG_Camarilla

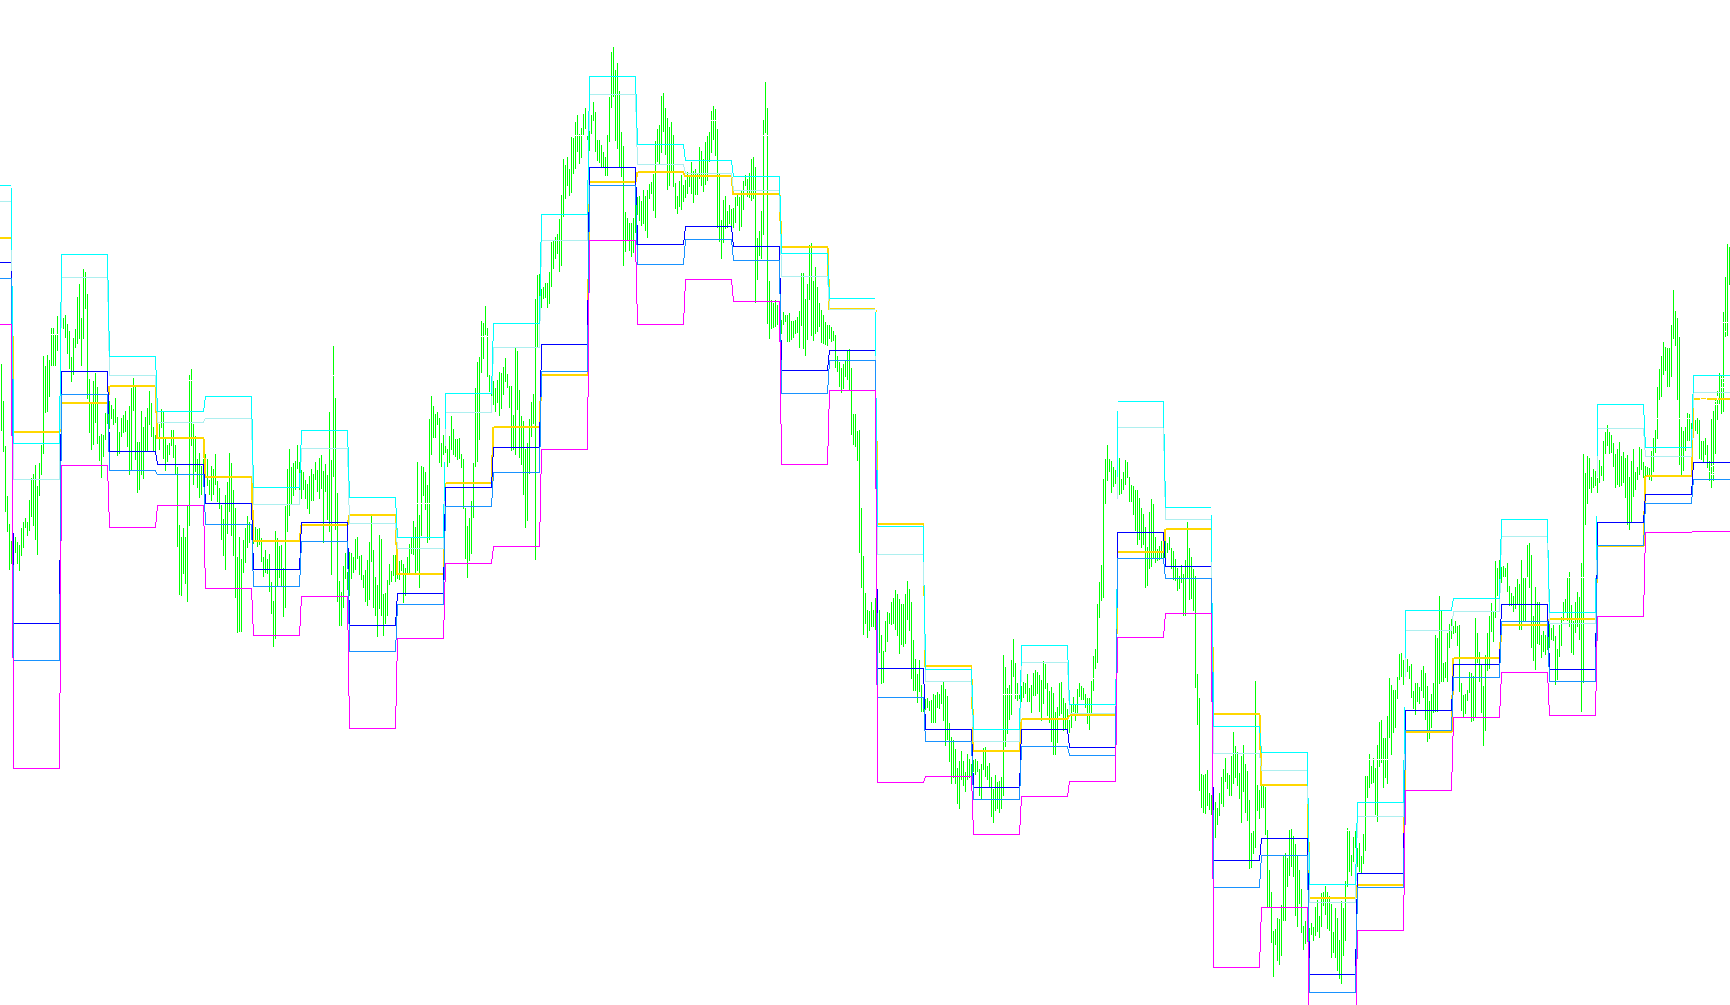
This indicator dynamically plots daily Camarilla pivot levels by calculating support and resistance boundaries based on the previous period's high, low, and closing prices.

i_DCG_Camarilla_v1
Indicator

i_DCG_Camarilla_v1

This indicator dynamically projects daily pivot points and Camarilla range levels (L2-L4, H2-H4) by calculating price deviations from previous session extremes.

i_DCG_Camarilla_v2
Indicator

i_DCG_Camarilla_v2

This indicator calculates and plots key Camarilla pivot levels based on the preceding day's price extremes and opening values to identify intraday liquidity zones.

i_DCG_ModStDev
Indicator

i_DCG_ModStDev

iMAOnArrayiStdDev

This indicator quantifies market volatility dynamics by calculating the divergence between multi-layered linear weighted moving averages of standard deviation values.

i_DCG_ModStDev_v1
Indicator

i_DCG_ModStDev_v1

iMAOnArrayiStdDev

This indicator quantifies market volatility momentum by calculating the differential between multi-layered linear weighted moving averages of standard deviation.

i_DCG_ModStDev_v2
Indicator

i_DCG_ModStDev_v2

iMAOnArrayiStdDev

This indicator calculates the momentum of market volatility by computing the differential between dual linearly weighted moving averages applied to standard deviation values, modulated by Fibonacci scaling factors.

i_GAP
Indicator

i_GAP

The indicator quantifies the magnitude of price jumps between consecutive candles by calculating the point-based distance from the previous close to the current open.

i_MF_Fractal_ZZ_3in1
Indicator

i_MF_Fractal_ZZ_3in1

This indicator identifies multi-layered structural price pivots by concurrently calculating fractal extremes across three distinct timeframes and filtering redundant consecutive peaks.

Indicator

i_Model_ZZ

i_ParamonWorkTime
Indicator

i_ParamonWorkTime

This indicator visually demarcates specific global trading sessions on the chart using multi-colored rectangular zones based on user-defined time windows.

I_RSI
Indicator

I_RSI

Calculates the velocity of price movement by smoothing the ratio of relative gains against relative losses over a defined temporal window.

i_Sadukey_V1
Indicator

i_Sadukey_V1

This indicator calculates a dual-buffer momentum profile by applying specific fixed-coefficient weights to historical price data points (OHLC) to highlight underlying trend shifts.

i_Sadukey_V1_v1
Indicator

i_Sadukey_V1_v1

The indicator calculates a dual-layered weighted average of price actions across 65 historical periods to reveal underlying momentum shifts.

i_Trend
Indicator

i_Trend

iBearsPoweriBandsiBullsPower

The indicator calculates the divergence between price action and Bollinger Band boundaries while simultaneously synthesizing a momentum net from bullish and bearish power metrics.

i_Trend_002
Indicator

i_Trend_002

iBearsPoweriBandsiBullsPower

This indicator calculates the divergence between current price action and Bollinger Band boundaries while incorporating a weighted sum of bullish and bearish power metrics.

i_Trend_004
Indicator

i_Trend_004

iBearsPoweriBandsiBullsPower

This indicator calculates the discrepancy between real-time price action and Bollinger Band extremes while simultaneously synthesizing a power-sum of bullish and bearish pressure.

i_Trend_005
Indicator

i_Trend_005

iBearsPoweriBandsiBullsPower
i_Trend_v1
Indicator

i_Trend_v1

iBearsPoweriBandsiBullsPower

This indicator calculates the variance between current price action and Bollinger Band extremes while integrating a dual-layered power momentum filter to identify trend exhaustion.

i_Trend_v3
Indicator

i_Trend_v3

iBearsPoweriBandsiBullsPower

This indicator calculates the divergence between current price action and Bollinger Band boundaries while simultaneously aggregating bullish and bearish momentum power.

i_Trend_v4
Indicator

i_Trend_v4

iBearsPoweriBandsiBullsPower

This indicator quantifies market velocity by calculating the differential between real-time price action and Bollinger Band extremes while overlaying a synthesized bullish-bearish power equilibrium.

I_XO_A_H
Indicator

I_XO_A_H

This indicator identifies and quantifies sequential price momentum shifts by tracking consecutive breaches of a user-defined fixed price range.

I_XO_A_H_002
Indicator

I_XO_A_H_002

This indicator tracks cumulative momentum by identifying price movements that exceed a predefined point-based volatility threshold.

I_XO_A_H_v1
Indicator

I_XO_A_H_v1

This indicator identifies directional momentum by tracking consecutive price movements that exceed a specific point-based volatility threshold.

I_XO_A_H_v2
Indicator

I_XO_A_H_v2

This indicator tracks cumulative structural breakouts by quantifying successive price expansions beyond a user-defined point threshold to visualize momentum shifts.

i_ZigZag_NK
Indicator

i_ZigZag_NK

Identifies structural price pivots by filtering historical price action through depth, deviation, and backstep parameters to map significant highs and lows.

Jaimo-JMA
Indicator

Jaimo-JMA

This indicator utilizes a multi-layered adaptive filtering algorithm to synthesize price action into a smooth trend line while minimizing phase lag through non-linear weight distribution.

Jaimo-JMA_v1
Indicator

Jaimo-JMA_v1

This indicator utilizes a dual-layered Jurik Moving Average algorithm to compute high-precision, low-lag trend signals by balancing non-linear volatility adjustments with dynamic price weighting.

Jaimo-JMA_v2
Indicator

Jaimo-JMA_v2

This indicator implements a Jurik Moving Average (JMA) logic that utilizes complex non-linear smoothing and dynamic phase adjustments to minimize lag while maintaining high price sensitivity.

james_bond-1_289
Indicator

james_bond-1_289

This script parses historical order data to render chronological entry, exit, and floating price trajectory markers directly on the chart.

Japan
Indicator

Japan

This indicator scans historical data to identify and visualize specific price action signals including Bullish/Bearish Engulfing, Hammer, Shooting Star, Doji, and reversal gaps.
JawsTest
Indicator

JawsTest

iSAR

This algorithm identifies high-momentum reversal points by synchronizing Parabolic SAR trend shifts with dynamic Price Channel Stop volatility boundaries.

Indicator

Jaws_v01

iSAR
JB Center of Gravity
Indicator

JB Center of Gravity

iStdDev

This indicator employs a Gaussian elimination matrix algorithm to calculate the underlying polynomial curve of price action, establishing a dynamic equilibrium point and variance-based volatility bands.

JBands
Indicator

JBands

This indicator calculates dynamic volatility bands based on a modified Jerrold Moving Average that utilizes logarithmic scaling, phase-shifting, and recursive smoothing to filter noise.

JC - Line Break Alert
Indicator

JC - Line Break Alert

This indicator detects and triggers real-time notifications when market price intersects specific horizontal levels or expands beyond defined vertical corridors.

JC - Line Break Alert1
Indicator

JC - Line Break Alert1

This indicator monitors real-time price action to trigger multi-modal notifications when the market breaches specific horizontal levels or predefined channel boundaries.

JC - Line Break Alert2
Indicator

JC - Line Break Alert2

Monitors real-time price action to trigger multi-modal notifications when market rates intersect or exit user-defined horizontal boundaries.

JC - Line Break Alert3
Indicator

JC - Line Break Alert3

This indicator triggers real-time auditory and visual notifications when market price traverses specific horizontal levels or exits defined range boundaries.

JC - Line Break Alert5
Indicator

JC - Line Break Alert5

This indicator monitors real-time price action to trigger multi-channel notifications whenever market values intersect or exit user-defined horizontal boundaries.

JC - Line Break Alert_v1
Indicator

JC - Line Break Alert_v1

This indicator monitors real-time price action to trigger audible and visual notifications when market data intersects specific horizontal boundaries or exits defined corridor zones.

JC - trial Line Break Alert
Indicator

JC - trial Line Break Alert

This indicator triggers multi-channel notifications and audio cues when price action pierces predefined horizontal boundaries or specific equilibrium levels.

Indicator

JCFBaux

Indicator

JCFBaux_v1

Indicator

JCFBaux_v2

JE_TwoPoleButterworthFilter
Indicator

JE_TwoPoleButterworthFilter

This indicator applies a second-order recursive digital filter to the median price to eliminate market noise while preserving essential trend momentum.