Interpolation
Download script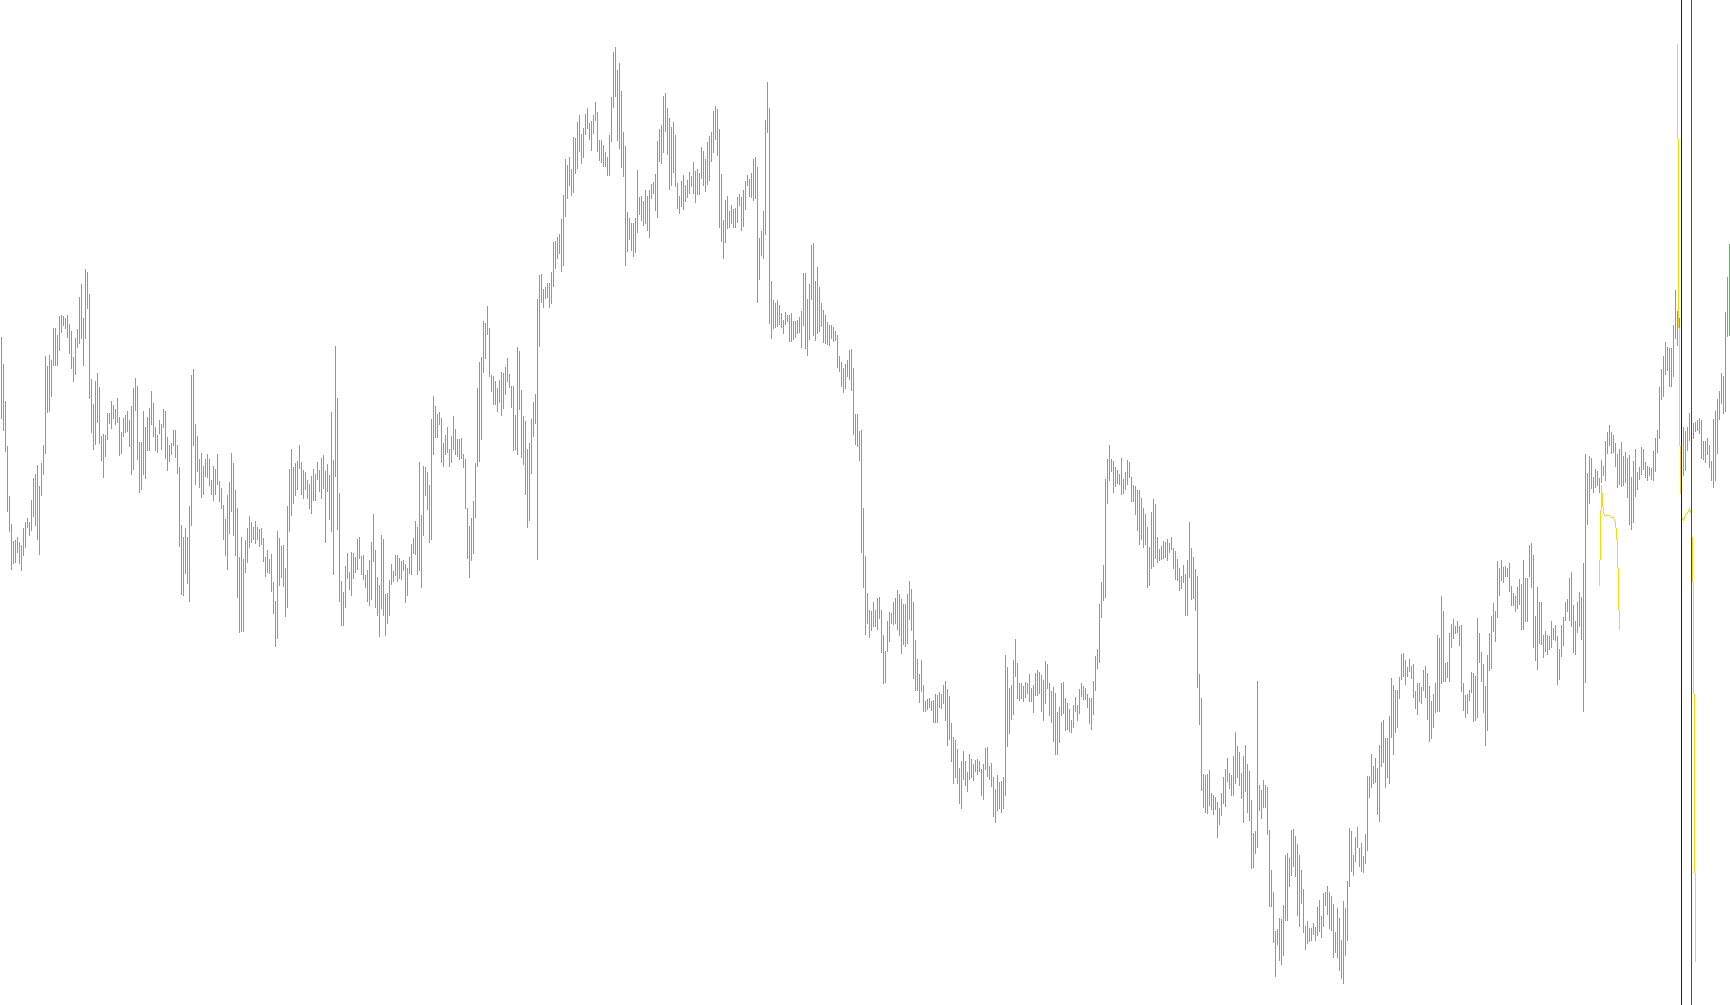
This tool is designed to provide a smoother, more continuous visualization of price movements by performing mathematical "interpolation" on historical data. In simpler terms, it takes specific known data points (the closing prices of a set number of candles) and calculates the most logical path that connects them.
How it Works
The script focuses on a specific window of time defined by the user. Instead of simply showing the jagged movements of standard price candles, it analyzes the price history between a starting point and an ending point to create a "bridge."
Key functional components include:
- Data Selection: The tool identifies a specific range of recent price data (for example, a sequence of 5 candles). It looks at the closing prices of these candles to understand the current trend.
- Mathematical Projection: Using a mathematical method called polynomial interpolation, the script calculates the values for every point in time between (and slightly beyond) those candles. It tries to determine where the price "should" be based on the curve established by the surrounding data points.
- Visual Continuity: By calculating these intermediate values, the tool produces a smooth line rather than a series of disconnected steps. This helps traders see the underlying flow of the market more clearly.
- Visual Markers: The script automatically places two vertical reference lines on the chart—a red line marking the beginning of the analyzed data and a blue line marking the end. This allows you to see exactly which section of price action is being used to generate the current projection.
Practical Purpose
The primary goal of this logic is to reduce "noise." While standard charts show every tiny fluctuation, this interpolation logic helps smooth out those movements to reveal the core trajectory of the price, making it easier to visualize the transition from one price level to the next.
//+------------------------------------------------------------------+
//|                                                Interpolation.mq4 |
//|                                 Copyright © 2008, Gryb Alexander |
//|                ICQ: 478-923-832 E-mail: alexandergrib@rambler.ru |
//+------------------------------------------------------------------+
#property copyright "Copyright © 2008, Gryb Alexander"
#property link      "ICQ: 478-923-832 E-mail: alexandergrib@rambler.ru"
#property indicator_separate_window
#property indicator_buffers 1


extern double numPrognoz = 2;
extern int begin=20;
extern int end=25;
double index_buffer[];

//+------------------------------------------------------------------+
//| Custom indicator initialization function                         |
//+------------------------------------------------------------------+
int init()
  {
//---- indicators
    SetIndexBuffer(0,index_buffer);
    SetIndexStyle(0,DRAW_LINE);
    ObjectCreate("begin",OBJ_VLINE,0,0,0);
    ObjectSet("begin",OBJPROP_COLOR,Red);
    ObjectCreate("end",OBJ_VLINE,0,0,0);
    ObjectSet("end",OBJPROP_COLOR,Blue);
//----
   return(0);
  }
//+------------------------------------------------------------------+
//| Custom indicator deinitialization function                       |
//+------------------------------------------------------------------+
int deinit()
  {
//----
   ObjectDelete("begin");
   ObjectDelete("end");
//----
   return(0);
  }
//+------------------------------------------------------------------+
//| Custom indicator iteration function                              |
//+------------------------------------------------------------------+
int start()
  {
   int    counted_bars=IndicatorCounted();
//----
    int k; int z; int bar_num; int x;
    double  a = 0; double  b1 = 1;  double  d = 1;

    double b[5000];
    double c[5000];
    //Îïðåäåëÿåì êîýôèöèåíòû
    for(k=end;k>=begin;k--)
    {
     b[k]=k;
     c[k]=Close[k];
    }
  for(x=begin-numPrognoz;x<end+numPrognoz+1;x++)
  {
    a = 0;
    for(k=begin;k<=end;k++)
    {
           b1=1;d=1;
            //Ïðîèçâåäåíèå îò 0 äî i-1 ýëåìåíòà
           for(z=begin;z<k;z++)
           {
              b1=b1*(x-b[z]);
              d=d*(b[k]-b[z]);
           }
           //Ïðîèçâåäåíèå îò i+1 äî numBars ýëåìåíòà
           for(z=k+1;z<=end;z++)
           {
              b1=b1*(x-b[z]);
              d=d*(b[k]-b[z]);
           }
     a=a+c[k]*((b1)/(d));
    }
    bar_num = x;
    index_buffer[bar_num]=a;
  }
  ObjectSet("begin",OBJPROP_TIME1,Time[begin]);
  ObjectSet("end",OBJPROP_TIME1,Time[end]);
//----
   return(0);
  }
//+------------------------------------------------------------------+
Comments