Index_pair_v22b
Indicator

Index_pair_v22b

iMAOnArrayiMAiRSIOnArray

This indicator calculates a synthetic currency strength index by aggregating cross-pair price data into weighted geometric means, processed through a double-layered RSI and EMA smoothing filter.
Index_pair_v22b_diff
Indicator

Index_pair_v22b_diff

iMAOnArrayiMAiRSIOnArray

This indicator calculates the relative strength between currency components by synthesizing cross-rate indices into a smoothed RSI difference signal to identify divergent momentum across major pairs.

Index_pair_v23b
Indicator

Index_pair_v23b

iMAOnArrayiMAiRSIOnArray

This indicator synthesizes cross-currency price data into unique currency indices to calculate smoothed Relative Strength Index and ADX values for identifying momentum shifts across major forex pairs.

Indicator Mode Values Checker
Indicator

Indicator Mode Values Checker

This script extracts and scales real-time multi-buffer data from the Solar_Wind and Triggerlines indicators to facilitate complex signal monitoring.

Indicator Volumes Buys_Sells
Indicator

Indicator Volumes Buys_Sells

This indicator bifurcates and redistributes bar volume into two distinct data streams based on candle directionality, price range scaling, and real-time equilibrium points.

Indicator

Indicators_Lib

Indicator_Painting
Indicator

Indicator_Painting

A comprehensive procedural toolkit for identifying local extrema, dynamic level transitions, and multi-point trend segments within price arrays.

Indicator_Strength
Indicator

Indicator_Strength

iMACDiMAiStochastic

This indicator quantifies price velocity by calculating and visualizing the variance between primary moving average, MACD, or Stochastic components in a dual-polarized histogram.

INDInverse_EMAdirection
Indicator

INDInverse_EMAdirection

This indicator quantifies price position relative to local high-low envelopes and calculates the momentum differential between accelerated exponential moving averages.

IndiTest
Indicator

IndiTest

iMA

This expert utilizes a self-evolving artificial neural network architecture to analyze multi-period moving average momentum, performing real-time synaptic weight adjustment and neuron pruning to identify overbought and oversold market states.

Indicator

Indraws Volume Analysis 3

Indicator

Indraws Volume Analysis 3_1

Indraws Volume Analysis v1.2
Indicator

Indraws Volume Analysis v1.2

This indicator aggregates trading volume between swing highs and lows, normalizing the cumulative total by the price range's displacement ratio to highlight liquidity concentration.

Induk@
Indicator

Induk@

This indicator calculates the rate of change between nested moving averages derived from linear regression trendlines to identify momentum shifts.

ind_DivPeakTroughOsMA_SW_v1
Indicator

ind_DivPeakTroughOsMA_SW_v1

iOsMA
ind_DivPeakTroughRSI_SW_v1
Indicator

ind_DivPeakTroughRSI_SW_v1

iRSI

This indicator identifies structural momentum shifts by detecting local extrema in a Zero-Line Relative Strength Index (RSI) and mapping trendline divergences between consecutive peaks and troughs.

ind_DivPeakTroughSto_SW_v1
Indicator

ind_DivPeakTroughSto_SW_v1

iStochastic

This indicator identifies structural divergences by comparing the relative momentum of smoothed stochastic oscillations against historical price extremes and fractal peaks.

Indicator

ind_FullSymbol_v1

ind_HotKeys_v1
Indicator

ind_HotKeys_v1

Executes an automated system-level keystroke sequence using the WinUser32 API to trigger external hotkeys upon indicator initialization.

IND_Inverse_and_BB_and_EMA
Indicator

IND_Inverse_and_BB_and_EMA

This indicator calculates a custom relative price position based on high-low amplitude and overlays it with a dynamic Bollinger Band and EMA to identify trend extremes.

Indicator

ind_OsMAColored_v1

ind_RSICCIDiv_v1
Indicator

ind_RSICCIDiv_v1

iCCIiRSI

This indicator identifies potential reversal entries by detecting specific price action discrepancies where RSI extreme levels align with CCI momentum crossovers and historical zone transitions.

Indicator

ind_RSIColored_v1

ind_StoColored_v1
Indicator

ind_StoColored_v1

This indicator identifies structural trend shifts by analyzing the relative momentum and directional progression of Stochastic oscillators to isolate peak and trough dynamics.

ind_SupportEX
Indicator

ind_SupportEX

This indicator projects historical high, low, open, and close levels from Daily, Weekly, and Monthly timeframes onto lower charts using trendlines and rectangles.

Ind_TD_DeMark_3_1_LA_Mod_01_AIME
Indicator

Ind_TD_DeMark_3_1_LA_Mod_01_AIME

This indicator identifies DeMark trend reversal points and projects geometric trendlines with automated take-profit targets based on historical price pivot dynamics.

Ind_TD_DeMark_3_1_LA_Mod_01_AIME_v1
Indicator

Ind_TD_DeMark_3_1_LA_Mod_01_AIME_v1

This indicator identifies multi-step DeMark and Fractal pivot points to project dynamic trend lines, horizontal price levels, and automated take-profit targets based on geometric progression.

Ind_TD_DeMark_3_1_LA_Mod_03B_AIME
Indicator

Ind_TD_DeMark_3_1_LA_Mod_03B_AIME

Identifies multi-step Trend Deviation points to project linear breakout targets and trendline violations using historical pivot analysis.

Ind_TD_DeMark_3_1_LA_Mod_03B_AIME_001
Indicator

Ind_TD_DeMark_3_1_LA_Mod_03B_AIME_001

This indicator identifies Trend Danger (TD) points to construct dynamic trendlines and project mathematical price targets based on multi-step structural analysis.

Ind_TD_DeMark_3_1_LA_Mod_03B_AIME_002
Indicator

Ind_TD_DeMark_3_1_LA_Mod_03B_AIME_002

This indicator identifies specific price pivot points to construct DeMark trendlines and automatically calculate multi-step geometric projections for potential breakout targets.

Ind_TD_DeMark_3_1_LA_Mod_03B_AIME_v1
Indicator

Ind_TD_DeMark_3_1_LA_Mod_03B_AIME_v1

This indicator identifies TD Sequential points to project trendlines and calculate objective price targets based on historical pivot highs and lows.

Ind_TD_DeMark_3_1_LA_Mod_03B_AIME_v2
Indicator

Ind_TD_DeMark_3_1_LA_Mod_03B_AIME_v2

This indicator identifies Triple Danger (TD) price points to project trendline breaks and automated profit targets based on historical geometric pivots.

Ind_TD_DeMark_3_1_LA_Mod_03B_AIME_v3
Indicator

Ind_TD_DeMark_3_1_LA_Mod_03B_AIME_v3

This indicator identifies TD structural points to automate the calculation of multi-step trendlines and execute precise price projection targets based on historical pivot geometry.

ind_Test
Indicator

ind_Test

iMA

Identifies directional shifts by detecting the precise moment the fast moving average intersects and breaches the slow moving average threshold.

Ind_VilkaFractals_v1.1
Indicator

Ind_VilkaFractals_v1.1

iFractals
Ind_VilkaFractals_v1.1_v1
Indicator

Ind_VilkaFractals_v1.1_v1

iFractals
Ind_VilkaFractals_v1.2
Indicator

Ind_VilkaFractals_v1.2

iFractals
INERCIA_bars
Indicator

INERCIA_bars

This indicator identifies and plots the price extremes of candles that exceed a specific minimum body size to highlight significant directional movements.

INERCIA_bars_v1
Indicator

INERCIA_bars_v1

This indicator identifies price bars where the candle body exceeds a specific point threshold to highlight significant directional movements.

Info+Ticks
Indicator

Info+Ticks

A real-time market analytics tool that visualizes high-frequency price ticks while simultaneously calculating dynamic risk-based lot sizing and volatility-adjusted stop-loss levels.

Indicator

Info

Inform
Indicator

Inform

A skeletal structural prototype designed to initialize a custom indicator environment within the MQL4 workspace.

Information
Indicator

Information

iCCIiMACDiRSIiStochastic

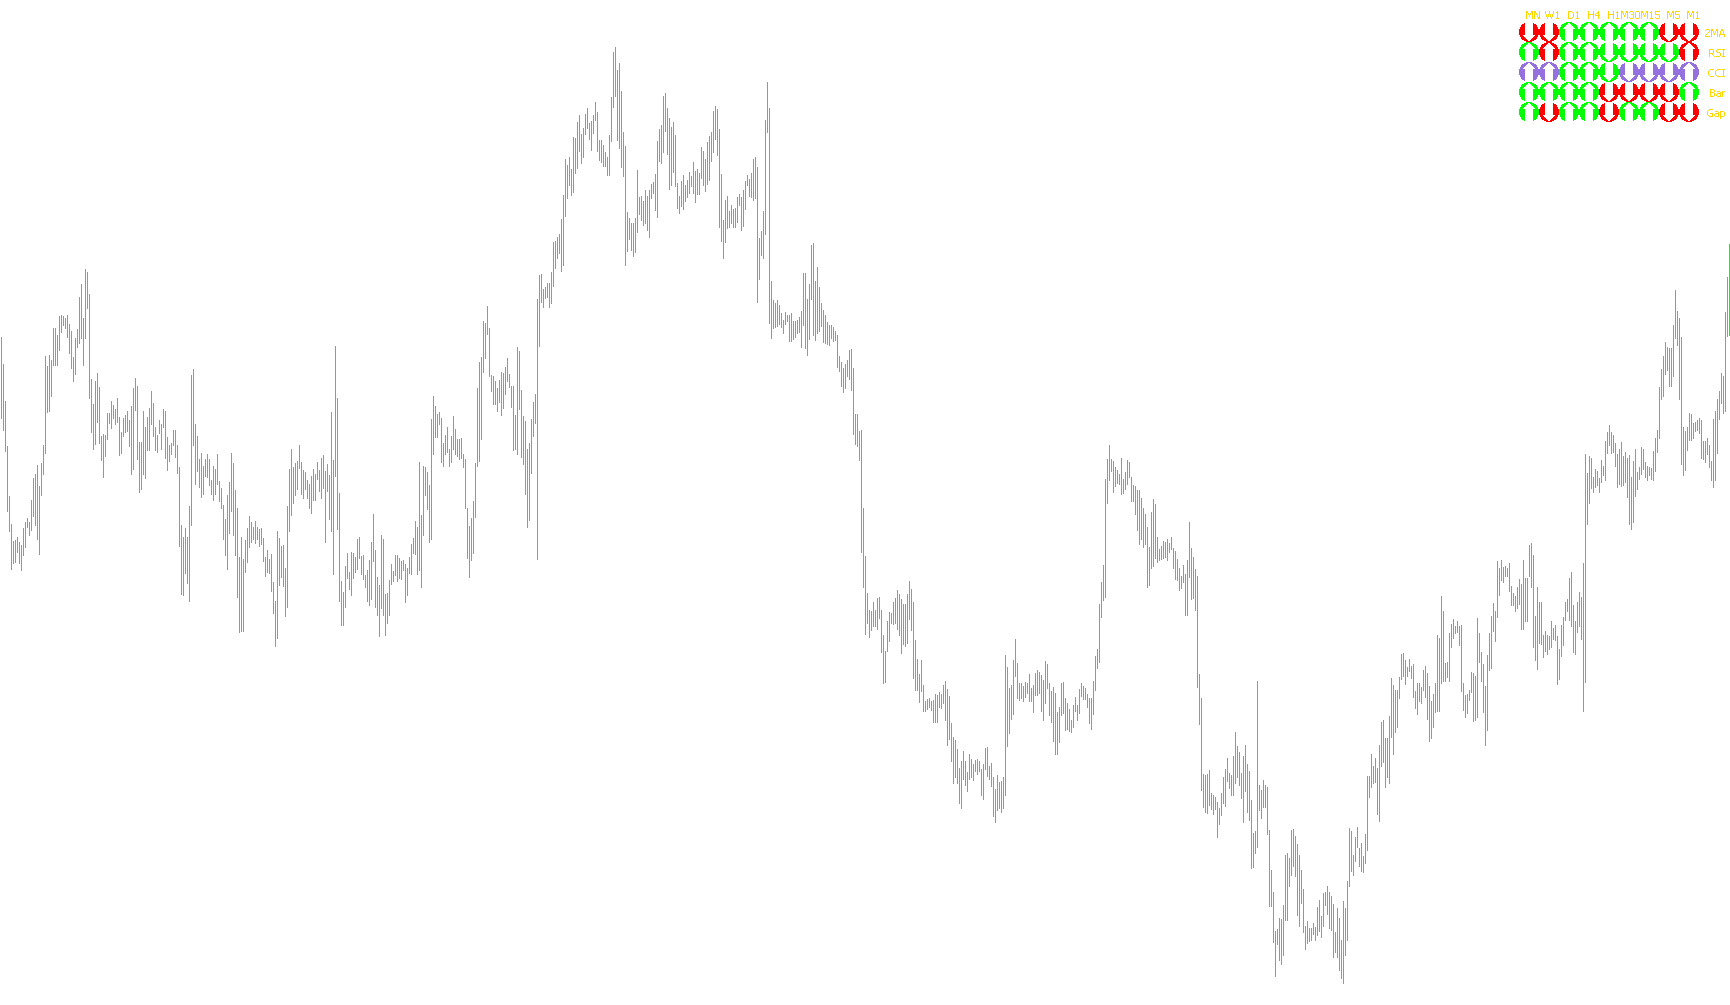
This indicator aggregates synchronized momentum, trend, and volatility data across multiple timeframes into a single visual dashboard to identify high-probability trade bias.

Information_5_deci
Indicator

Information_5_deci

iCCIiMACDiRSIiStochastic

This indicator synchronizes MACD, RSI, Stochastic, CCI, and EMA metrics across multiple timeframes to provide a unified visual heatmap of trend direction and price volatility.

Information_5_deci_MTF
Indicator

Information_5_deci_MTF

iCCIiMACDiRSIiStochastic

This indicator aggregates real-time MACD, RSI, Stochastic, CCI, and EMA signals across nine distinct timeframes to provide a synchronized visual overview of trend momentum and market volatility.

Indicator

informindicatorML8

Indicator

informindicatorML9

info_Table_v0Satop_en v1
Indicator

info_Table_v0Satop_en v1

iCCIiMAiRSI

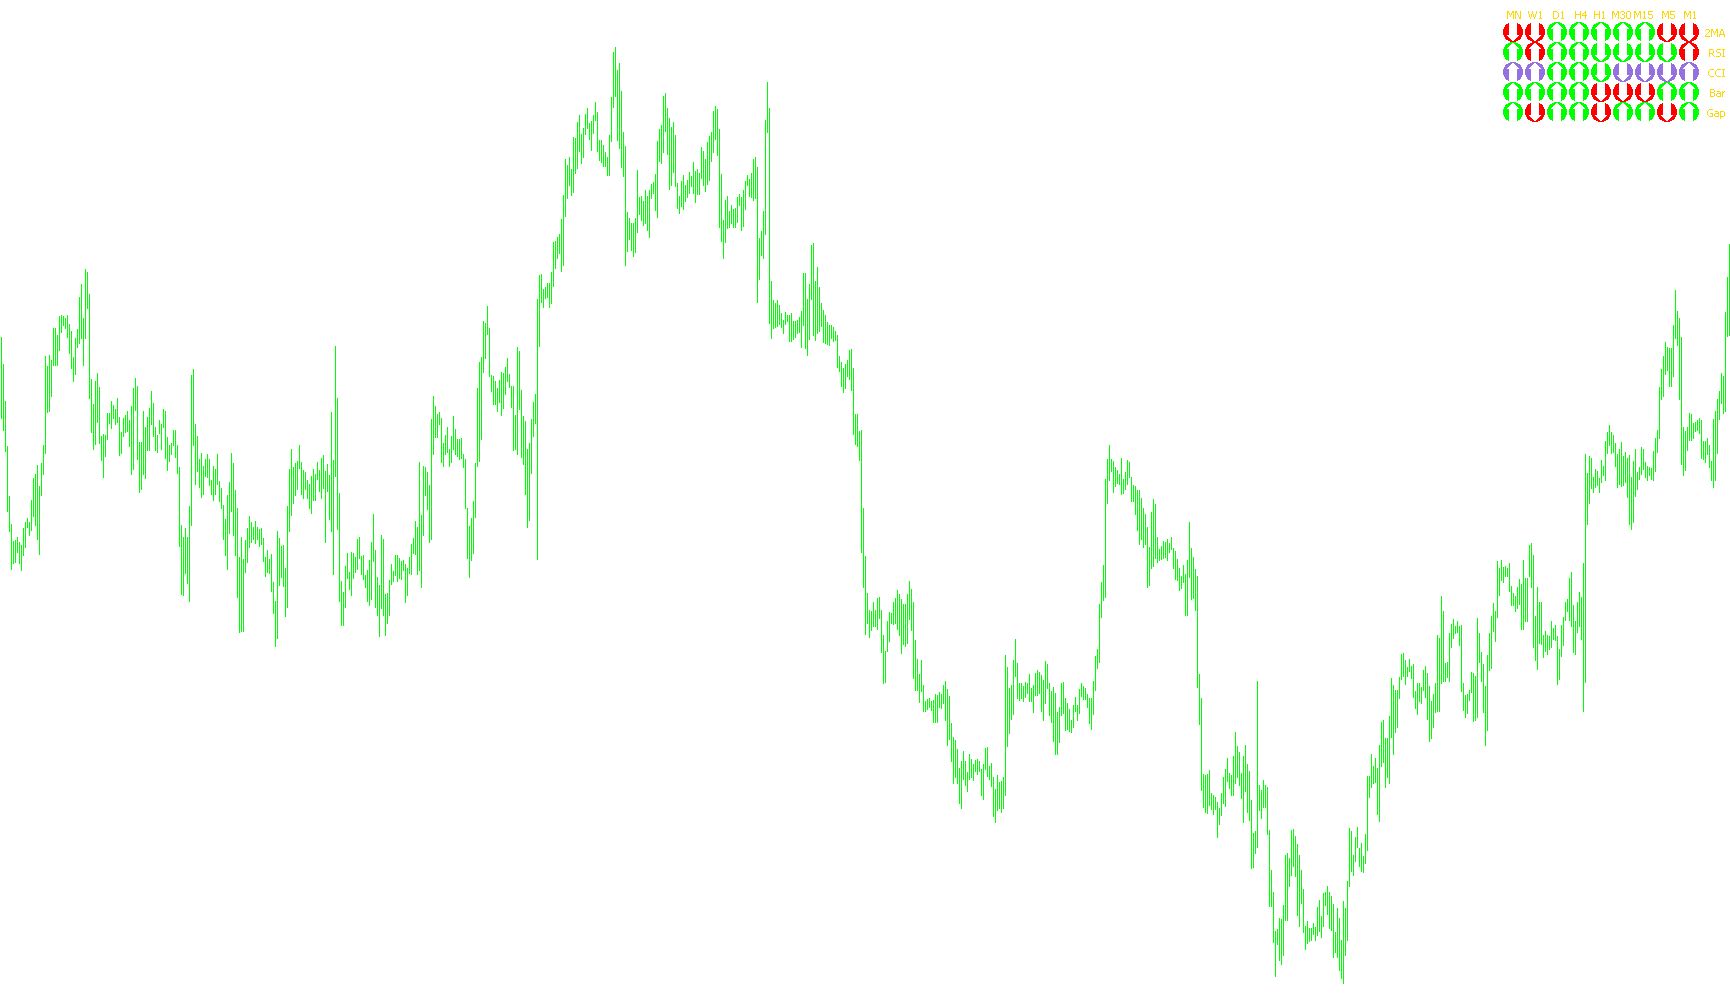
This indicator aggregates real-time trend, momentum, and price action signals across nine different timeframes into a single visual dashboard for synchronized market analysis.

info_Table_v0Satop_en
Indicator

info_Table_v0Satop_en

iCCIiMAiRSI

This indicator renders a comprehensive dashboard visualizing concurrent trend, momentum, and price action signals across nine distinct timeframes simultaneously.

InitAllIndicators
Indicator

InitAllIndicators

This script utilizes Windows API DLL calls to programmatically traverse the MetaTrader indicator list and automatically cycle through the property settings of every attached technical tool.