Indicator

JoeChalhoub_FXForecasterV1

iMAOnArray
JoeChalhoub_HeikenAshiSwingSignal
Indicator

JoeChalhoub_HeikenAshiSwingSignal

This indicator identifies trend reversals by synchronizing H4 structural boundaries with M5 price action and H1 Heiken Ashi momentum shifts.

JPivot Points
Indicator

JPivot Points

Calculates a comprehensive suite of central tendency levels and mirrored support/resistance boundaries derived from high, low, and close price data across selectable timeframes.

JPN_Time_Sub
Indicator

JPN_Time_Sub

This indicator calculates and visualizes a specific temporal offset, projecting a shifted time coordinate onto the chart with customizable labels and vertical grid indicators.

JRSX
Indicator

JRSX

This indicator synthesizes momentum analysis with advanced smoothing algorithms to provide a low-latency, fluid curve that identifies trend exhaustion while minimizing noise.

JR_Trend_Indicator
Indicator

JR_Trend_Indicator

iMA

The indicator quantifies the rate of change between a 5-period SMA and a 21-period EMA to identify directional momentum shifts and trend acceleration.

JR_Trend_Indicator_001
Indicator

JR_Trend_Indicator_001

iMA

This indicator identifies weekly trend shifts by measuring the rate of change in the spread between a 5-period SMA and a 21-period EMA.

JR_Trend_Indicator_v1
Indicator

JR_Trend_Indicator_v1

iMA

This indicator quantifies weekly market bias by calculating the rate of change between a 5-period Simple Moving Average and a 21-period Exponential Moving Average.

Juice StdDev with Histogram  LA
Indicator

Juice StdDev with Histogram LA

iMA

Quantifies market price dispersion by calculating the square root of the mean squared deviations from a customizable moving average over a specific lookback period.

Juice v1.2 alert
Indicator

Juice v1.2 alert

iStdDev

This indicator identifies significant market volatility spikes by comparing the current Exponential Moving Average standard deviation against a historical average threshold.

Juice v1.2 alert_001
Indicator

Juice v1.2 alert_001

iStdDev

This indicator identifies bullish momentum by calculating the ratio between the current Exponential Moving Average standard deviation and its historical average value.

Juice-modified
Indicator

Juice-modified

iStdDev

The indicator categorizes market volatility by mapping Exponential Moving Average standard deviation values into three distinct visual zones based on user-defined price point thresholds.

Juice
Indicator

Juice

This indicator quantifies price volatility by calculating the distance between the Exponential Moving Standard Deviation and a dynamic baseline level.

Juice2
Indicator

Juice2

This indicator calculates the distance between the current price and the Exponential Moving Average based on Standard Deviation, filtering values against a specific magnitude level to isolate volatility extremes.

Juice5Level
Indicator

Juice5Level

iStdDev

This indicator quantifies market volatility by categorizing standard deviation values into five distinct histogram-based intensity levels.

JuiceDelta
Indicator

JuiceDelta

This indicator captures price volatility dynamics by calculating the first derivative of the Exponential Moving Average of standard deviation to identify momentum shifts.

JuiceLevelsAlert
Indicator

JuiceLevelsAlert

This indicator quantifies price extremes by subtracting a fixed pip threshold from the Exponential Moving Average of Standard Deviation to highlight significant volatility breakouts.

JuiceLevelsAlertFixedNew
Indicator

JuiceLevelsAlertFixedNew

This indicator categorizes market volatility using Standard Deviation thresholds to differentiate between high, moderate, and low momentum states.

JuiceLevelsAlertNew
Indicator

JuiceLevelsAlertNew

This indicator quantifies market volatility by categorizing standard deviation values into three distinct intensity tiers to identify extreme price action shifts.

JuiceLevelsAlertNewV2
Indicator

JuiceLevelsAlertNewV2

This indicator categorizes market volatility into distinct sentiment tiers by measuring the standard deviation of exponential moving averages against predefined price pip thresholds.

JuiceLevelsAlertNew_v1
Indicator

JuiceLevelsAlertNew_v1

This indicator categorizes market volatility into three distinct tiers by evaluating the standard deviation of price action against predefined pip-based intensity boundaries.

JuiceLevelsAlertNew_v2
Indicator

JuiceLevelsAlertNew_v2

This indicator categorizes market volatility by calculating the standard deviation of an exponential moving average and mapping it into three distinct histogram zones based on predefined pip thresholds.

JuiceLevelsAlertNew_v3
Indicator

JuiceLevelsAlertNew_v3

This indicator quantifies market volatility by mapping standard deviation values into three distinct histogram categories based on predefined threshold and mid-range levels.

JuiceLevelsAlertNew_v4
Indicator

JuiceLevelsAlertNew_v4

This indicator categorizes market price expansion into three distinct volatility tiers by evaluating the standard deviation of exponential moving averages against predefined pips thresholds.

JuiceLevelsAlert_v1
Indicator

JuiceLevelsAlert_v1

This indicator quantifies momentum by calculating the variance between the Exponential Moving Average standard deviation and a fixed price offset to identify overextended volatility peaks.

Juicenew
Indicator

Juicenew

iStdDev

This indicator categorizes market volatility by quantifying the Standard Deviation of price action into three distinct histogram zones based on predefined numerical boundaries.

Indicator

Juice_v1

Juice_v2
Indicator

Juice_v2

This indicator quantifies price volatility by subtracting a fixed offset from the Exponential Moving Standard Deviation to visualize momentum breaches.

Juice_v3
Indicator

Juice_v3

This indicator quantifies market volatility by subtracting a fixed threshold from the Exponential Moving Average of Standard Deviation to isolate significant price fluctuations.

Jumpy
Indicator

Jumpy

This automated alert system monitors price action to notify users when the market exhibits a significant directional movement exceeding a predefined pip threshold within a specific historical timeframe.

Jurik Moving Average
Indicator

Jurik Moving Average

This algorithm utilizes a non-linear dynamic weighting system and complex recursive calculations to minimize phase shift while maintaining high sensitivity to price momentum.

JVNG_Magnet_Indicator
Indicator

JVNG_Magnet_Indicator

This indicator scans entire historical datasets to identify and plot price zones with the highest frequency of volatility spikes, highlighting key structural resistance and support levels based on hit density.

J_TPO
Indicator

J_TPO

This indicator calculates a weighted variance based on chronological price distributions to identify underlying market instability and momentum shifts.

J_TPO_Audio
Indicator

J_TPO_Audio

The indicator calculates a normalized momentum coefficient by performing a recursive sorting and weighted variance analysis on price price movements to identify extreme structural shifts.

J_TPO_Audio_v1
Indicator

J_TPO_Audio_v1

The indicator calculates a normalized correlation coefficient by analyzing price shifts and their chronological distribution within a sliding lookback window to identify extreme momentum divergences.

Indicator

J_TPO_Clean

Indicator

J_TPO_Clean_v1

Indicator

J_TPO_Clean_v2

Indicator

J_TPO_OSC

Indicator

J_TPO_OSC_v1

Indicator

J_TPO_OSC_v2

Indicator

J_TPO_OSC_v3

J_TPO_v1
Indicator

J_TPO_v1

This indicator calculates a weighted statistical correlation of price movements relative to their chronological sequence within a sliding window.

J_TPO_v2
Indicator

J_TPO_v2

This indicator calculates a sophisticated momentum metric by performing rank-based ordering and weighted covariance analysis on price fluctuations over a sliding window.

J_TPO_v3
Indicator

J_TPO_v3

This indicator calculates a weighted momentum value by identifying price plateau segments and applying a variance-based distribution logic to determine directional strength.

J_TPO_v4
Indicator

J_TPO_v4

This indicator calculates a weighted variance of price changes over a sliding window to identify underlying volatility shifts.

Indicator

J_TPO_Velocity

Indicator

J_TPO_Velocity_v1

Indicator

J_TPO_Velocity_v2

K-#MTF_shi_channel_1[1].1
Indicator

K-#MTF_shi_channel_1[1].1

iATR

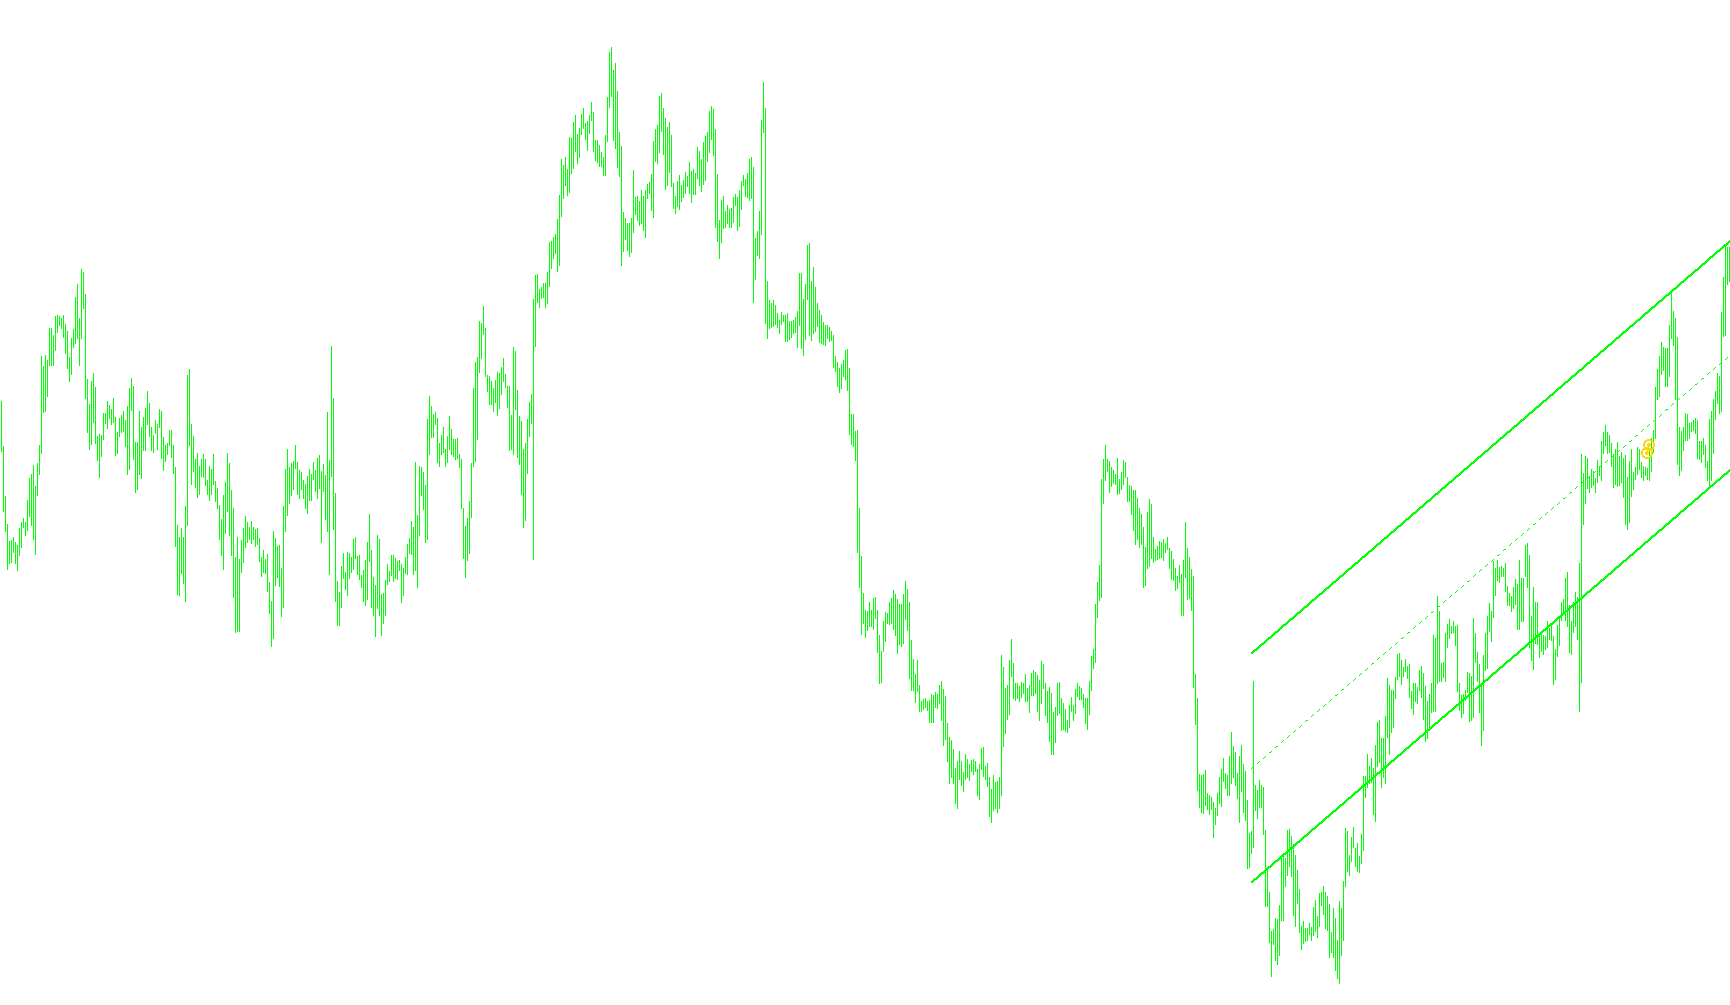
This indicator identifies structural price channels by connecting recursive fractal highs and lows to project dynamic trend boundaries and median equilibrium lines.