ravi_base
Indicator

ravi_base

iMA

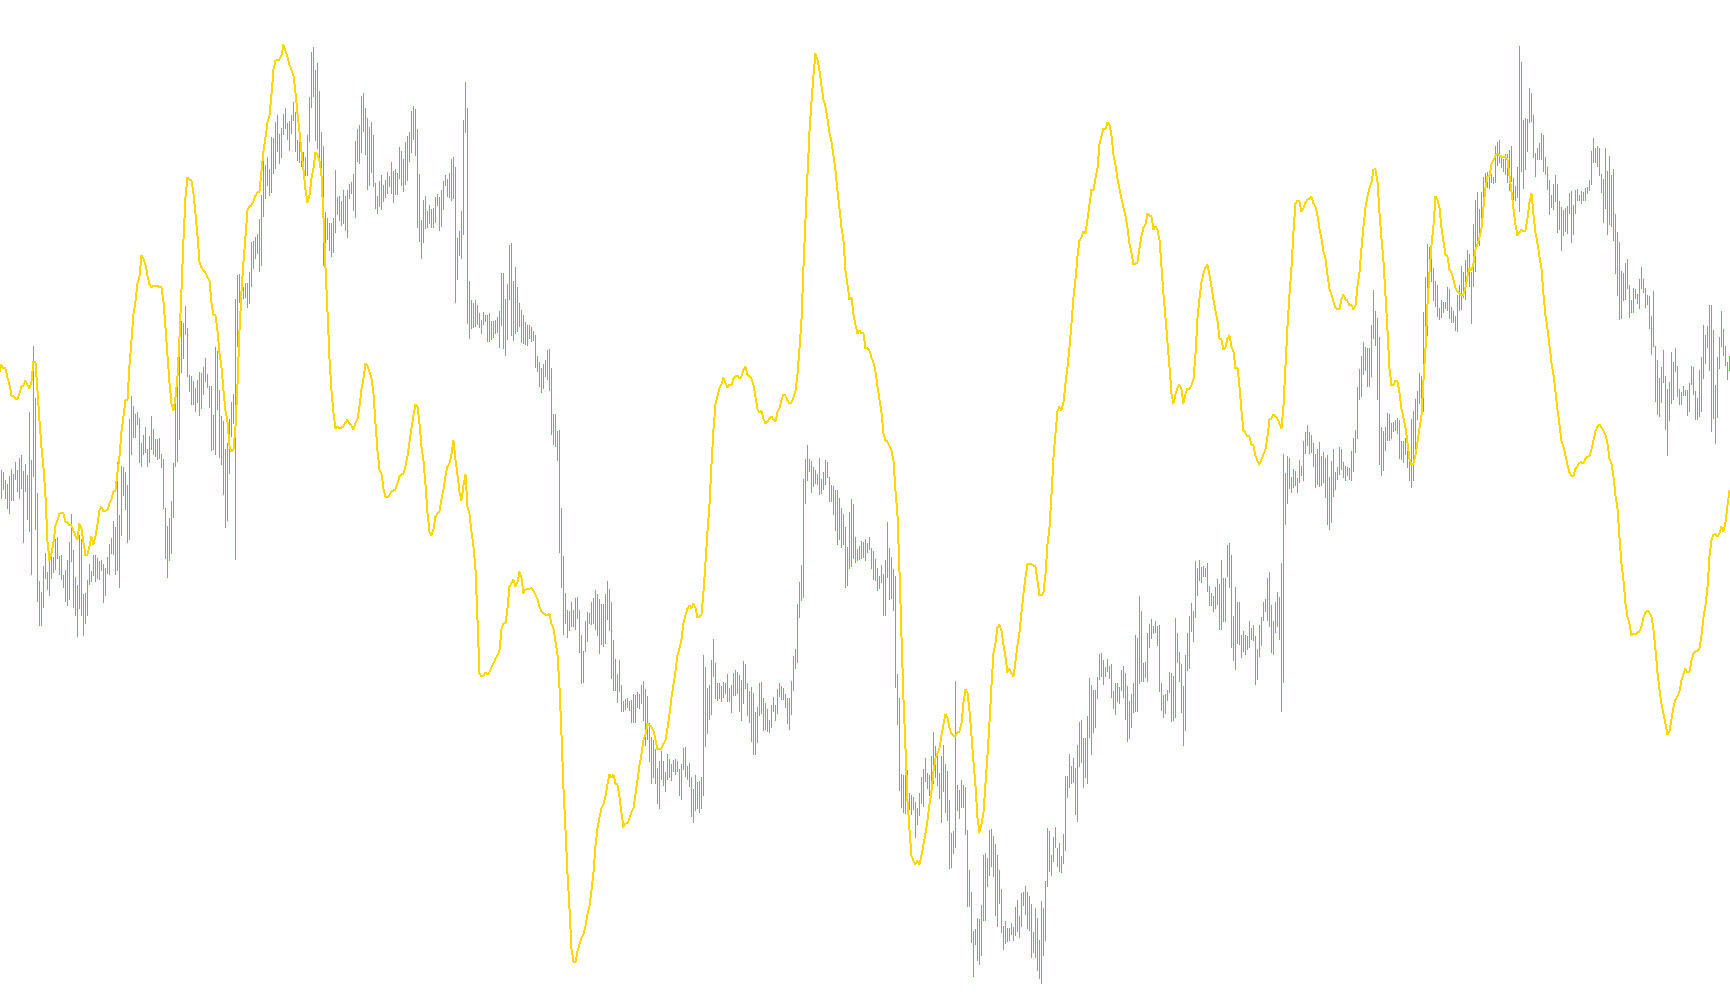
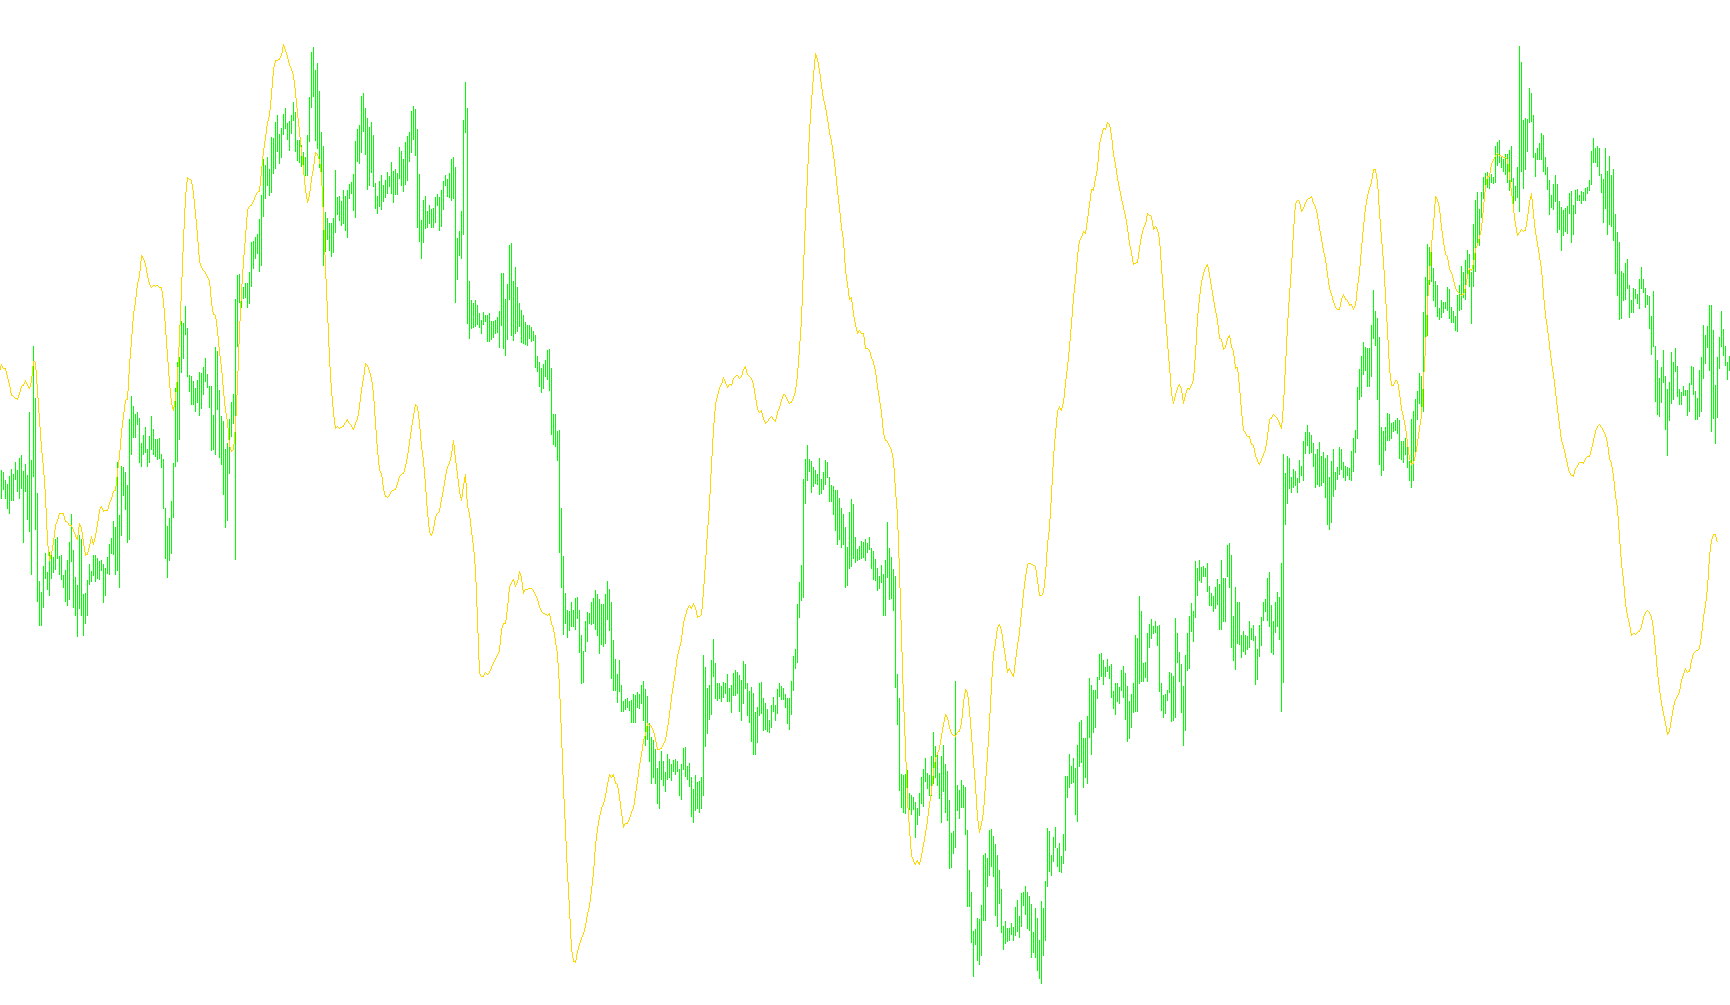
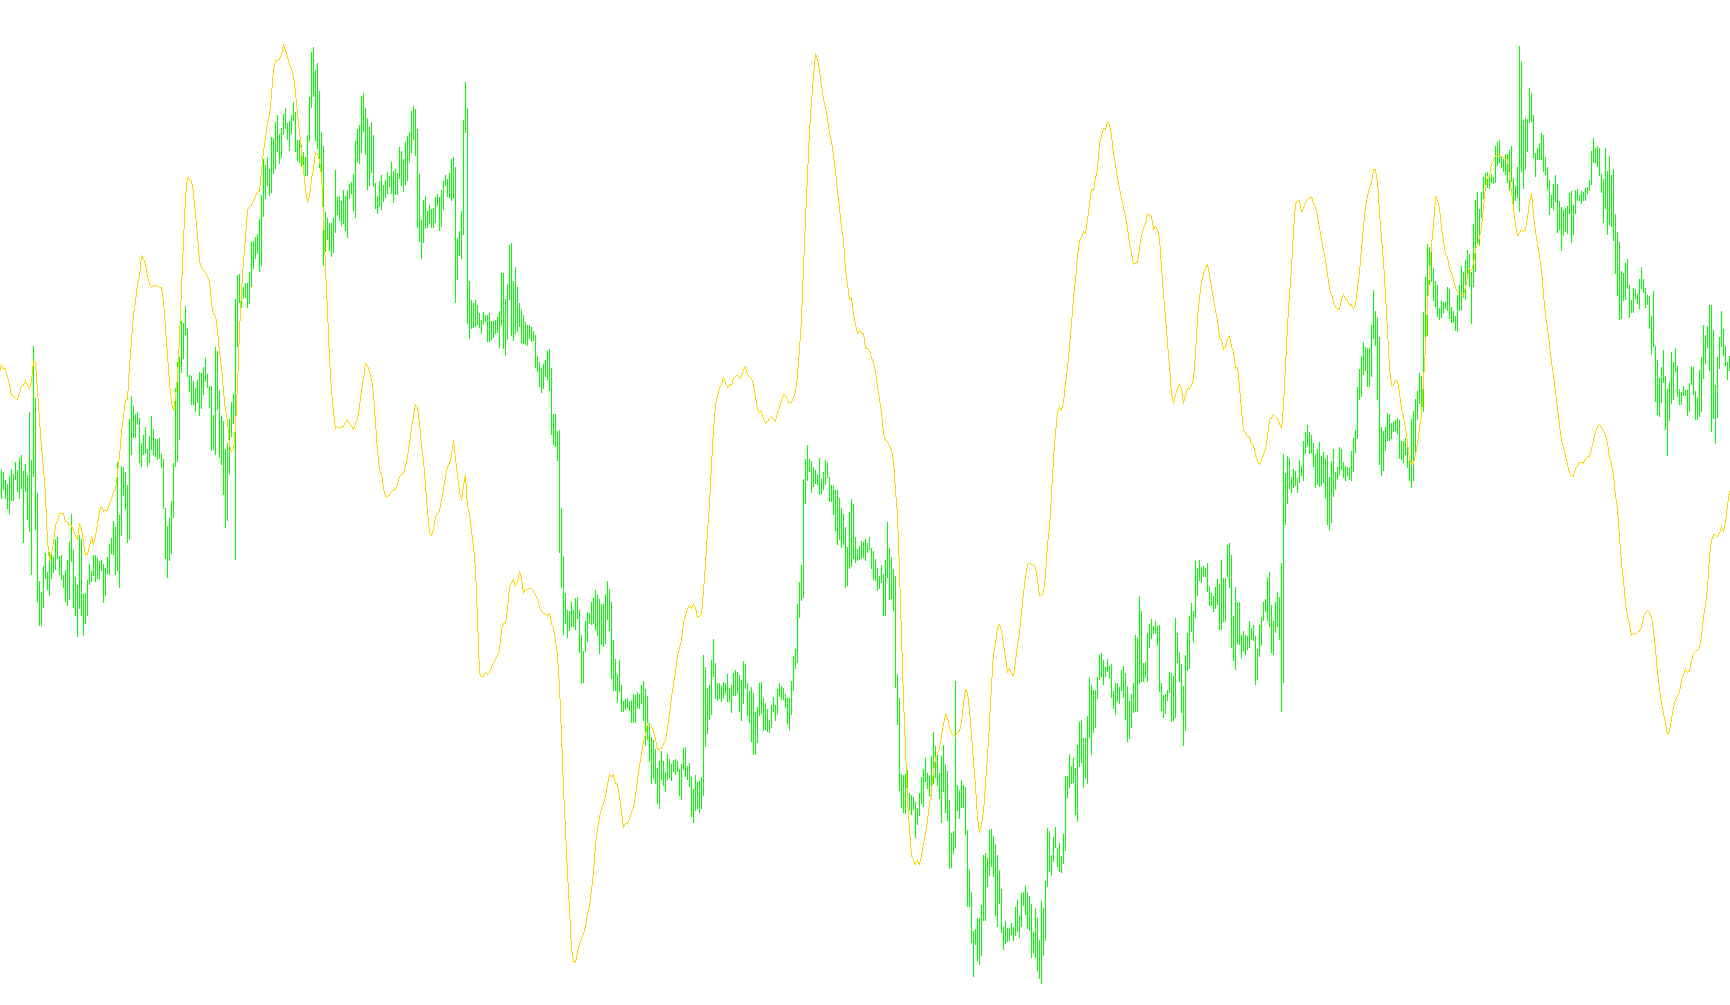
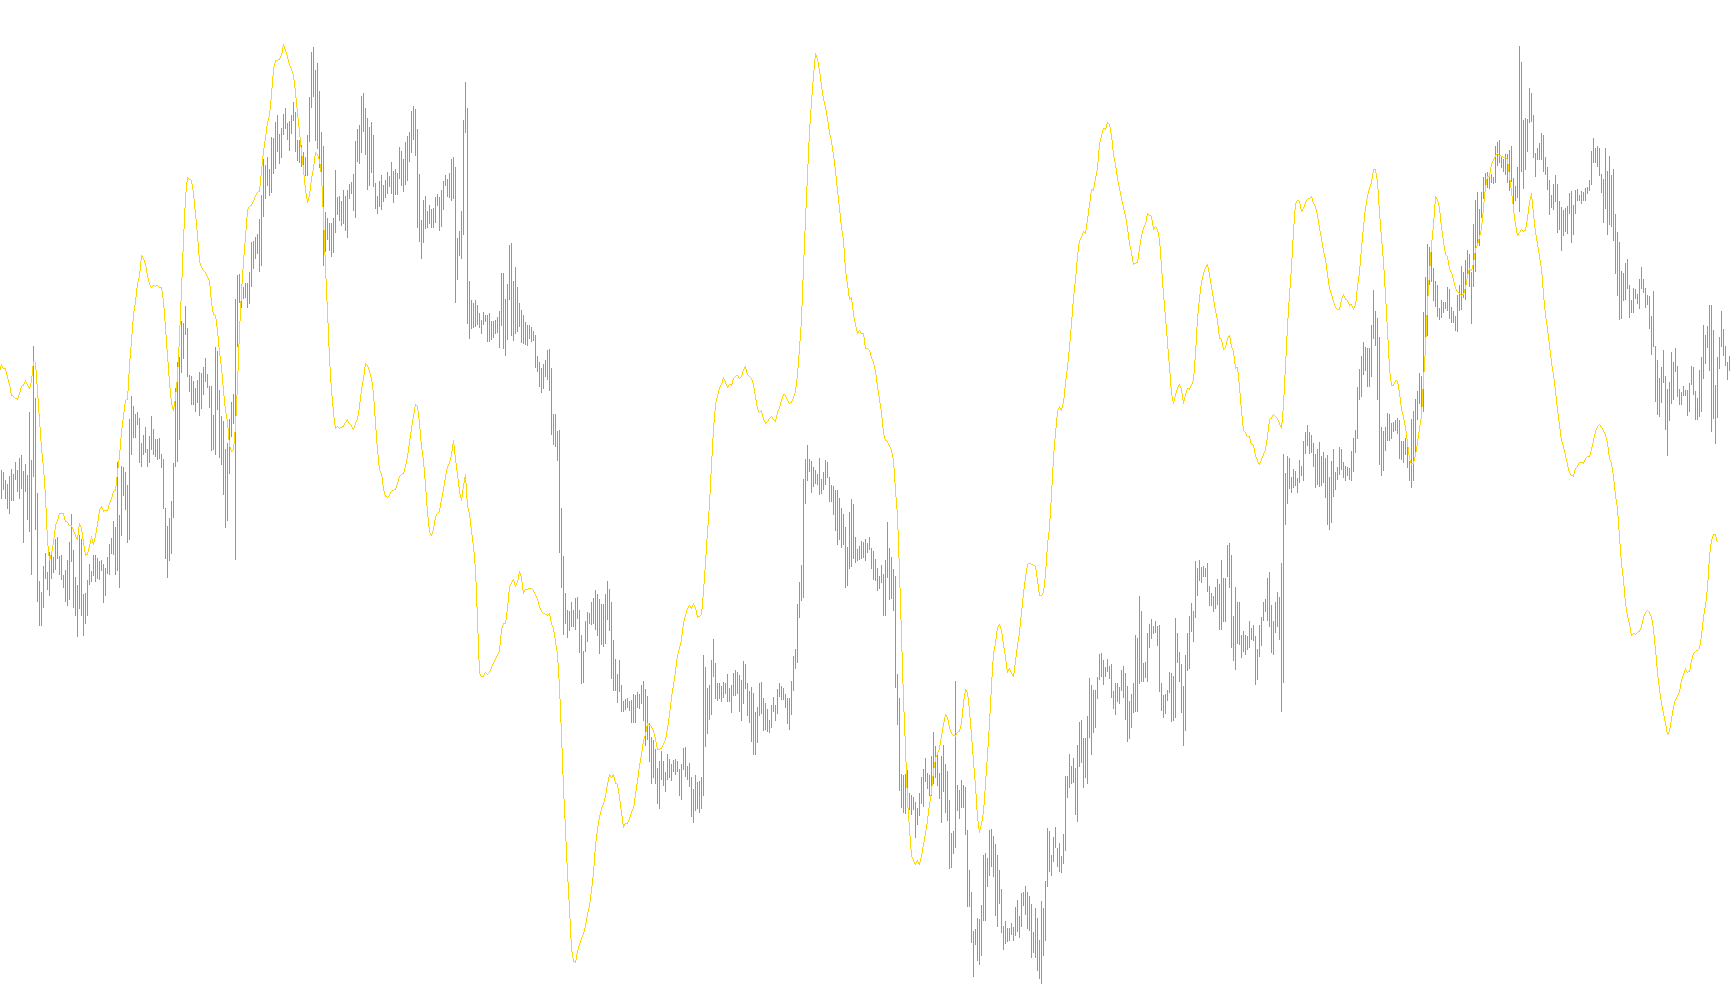
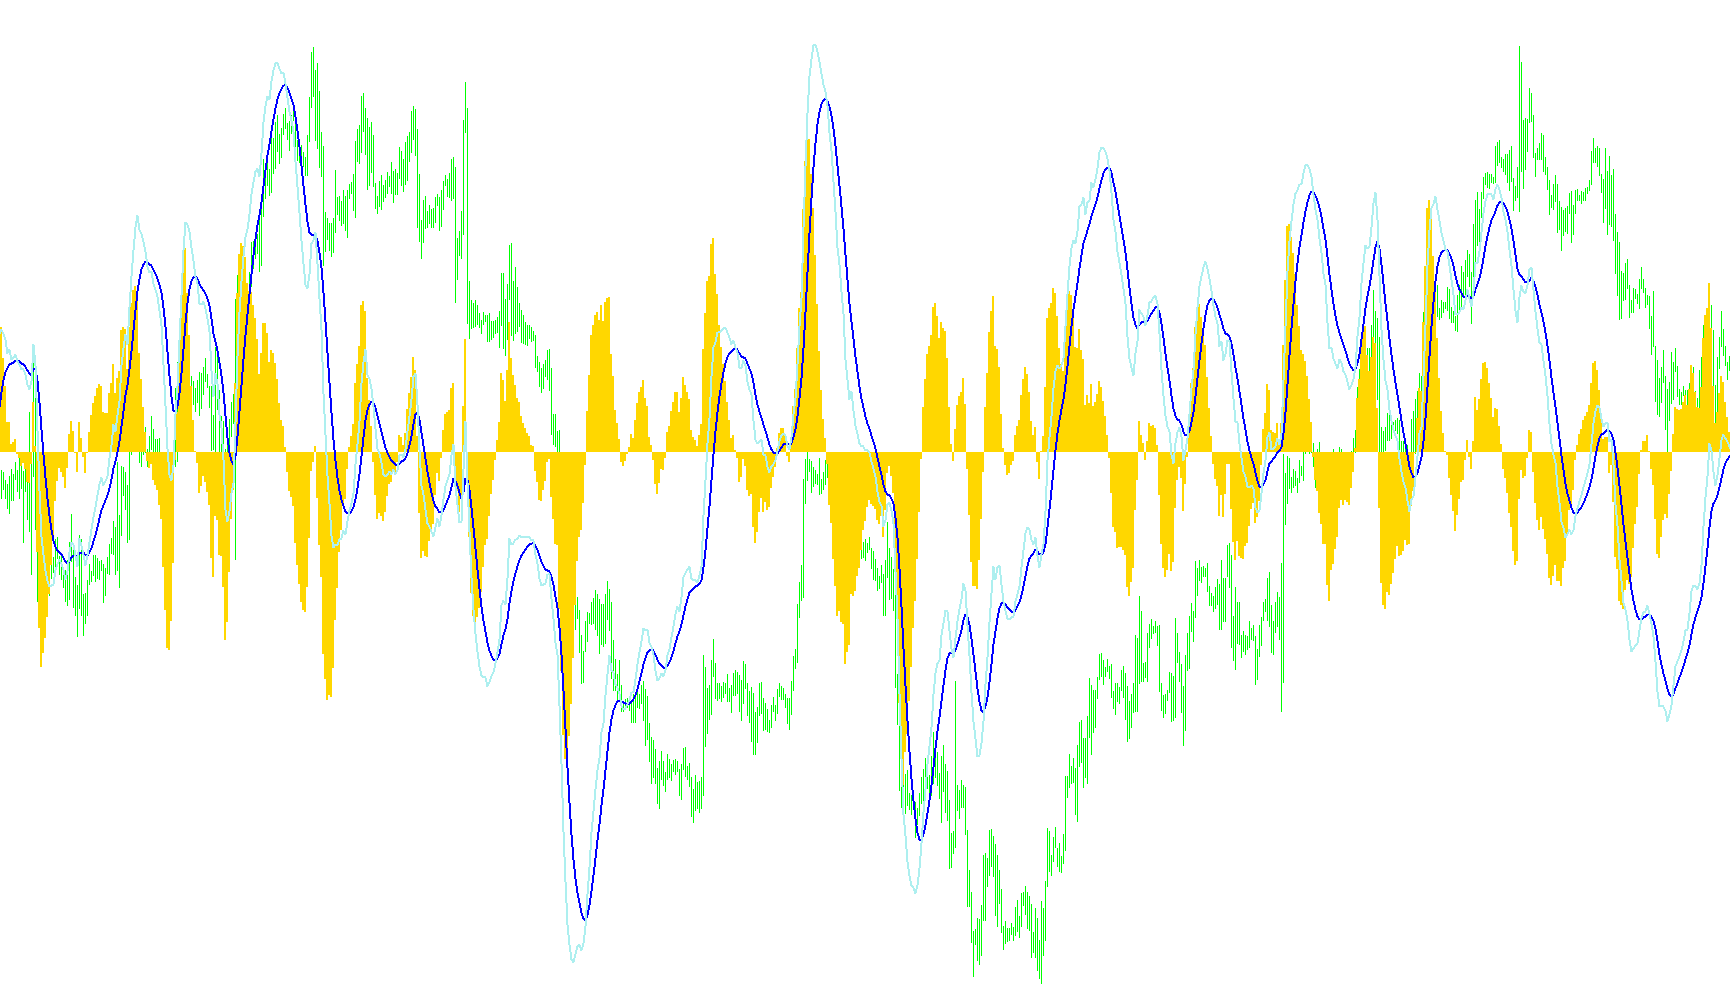
This indicator calculates the percentage difference between a short-term and a long-term Simple Moving Average to visualize momentum shifts.

RAVI_FX_Fisher2
Indicator

RAVI_FX_Fisher2

iATRiMA

This indicator quantifies market momentum by calculating the relative difference between a fast and slow linear weighted moving average, normalized by the average true range and optionally processed through an Inverse Fisher Transform.

RAVI_v1
Indicator

RAVI_v1

iMA

This indicator quantifies the percentage deviation between two Simple Moving Averages of different timeframes to identify trend momentum and price strength.

Ravi_v2
Indicator

Ravi_v2

iMA

This indicator quantifies the percentage divergence between a short-term and a long-term Simple Moving Average to identify momentum shifts.

RAVI_v3
Indicator

RAVI_v3

iMA

This indicator quantifies the percentage deviation between a fast simple moving average and a slow simple moving average to measure momentum shifts.

Raznost
Indicator

Raznost

Quantifies and visualizes the price discrepancy between the current candle's opening price and the previous candle's closing price.

Raznost2_v1
Indicator

Raznost2_v1

This indicator quantifies the price discrepancy between the current candle's opening price and the previous candle's closing price to visualize immediate market jumps.

RBCI
Indicator

RBCI

This indicator calculates a complex weighted sum of closing prices over a 56-period window to derive a smoothed momentum coefficient.
RBCI2
Indicator

RBCI2

This indicator calculates a weighted price mean across a 55-bar window and applies a standard deviation analysis to derive volatility bands and signal offsets.

RBCI2a
Indicator

RBCI2a

This indicator calculates a weighted sum of historical closing prices to derive an oscillatory trend line, utilizing standard deviation variance to establish dynamic overbought and oversold threshold bands.

RBCI2_1
Indicator

RBCI2_1

This indicator utilizes a fixed 56-period weighted coefficient summation to calculate volatility variance and signal deviations from the mean price movement.
RBCI2_v1
Indicator

RBCI2_v1

This indicator calculates a weighted price-action variance by applying specific coefficients to a 55-bar lookback period to determine trend magnitude and volatility bands.

RBCI2_v2
Indicator

RBCI2_v2

This indicator calculates a multi-period weighted price summation to derive a smoothed volatility variance and standard deviation profile.

RBCI_hist
Indicator

RBCI_hist

This indicator utilizes a multi-layered weighted sum of historical closing prices to identify and visualize momentum shifts via directional histogram values.

RBCI_hist_v1
Indicator

RBCI_hist_v1

This indicator calculates the variance between two distinct weighted moving average components to visualize momentum shifts through a directional histogram.

RBCI_v1
Indicator

RBCI_v1

This indicator calculates a weighted sum of the last 56 closing prices using specific coefficients to visualize price deviation and momentum dynamics.

RBCI_v2
Indicator

RBCI_v2

The indicator calculates a complex weighted sum of the previous 56 closing prices to generate a momentum-based trend signal.

rbf-dda
Indicator

rbf-dda

This algorithm implements a constructive Radial Basis Function Density Average (RBF-DDA) approach to perform non-parametric binary classification by dynamically learning and updating prototype centers based on input proximity.

RCFMA
Indicator

RCFMA

iMA

This indicator quantifies market momentum by calculating the spread between medium and long-term moving averages while tracking the instantaneous rate of change for short-term price velocity.

RD-BT2Stop
Indicator

RD-BT2Stop

This indicator identifies trend reversals by calculating a volatility-adjusted threshold based on a weighted average of historical price ranges.

RD-BT2Stop_v1
Indicator

RD-BT2Stop_v1

This indicator identifies trend reversals by calculating a price-weighted average range to establish dynamic trailing stop thresholds based on high and low volatility.

RD-Combo
Indicator

RD-Combo

iCCIiADXiMAiRVI

This indicator generates trading signals by aggregating a weighted score from five distinct technical dimensions: moving average momentum, CCI oscillators, predictive regression forecasting, RVI trend strength, and ADX directional volume.

RD-Combo_v1
Indicator

RD-Combo_v1

iCCIiADXiMAiRVI

A sophisticated trend-following system that aggregates price momentum, moving average crossovers, ADX strength, CCI oscillations, and regression-based forecast oscillators into a unified signal.

RD-Combo_v2
Indicator

RD-Combo_v2

iCCIiADXiMAiRVI

A multi-factor momentum engine that synthesizes smoothed moving averages, CCI, RVI, ADX strength, and a polynomial forecast oscillator to identify high-probability trend entries.

RD-Combo_v3
Indicator

RD-Combo_v3

iCCIiADXiMAiRVI

This indicator synthesizes momentum, trend velocity, and predictive regression analysis into a unified signal by aggregating data from Moving Averages, CCI, RVI, ADX, and a custom forecast oscillator.

RD-Combo_v5
Indicator

RD-Combo_v5

iCCIiADXiMAiRVI

This indicator aggregates momentum, trend, and volatility oscillators—specifically LWMA crossovers, CCI dynamics, RVI signal deviations, and ADX strength—into a unified consensus scoring system to identify high-probability trend entries.

RD-forecast osc-15M
Indicator

RD-forecast osc-15M

This indicator calculates a forecast oscillator by synthesizing weighted linear regression averages with a triple-smoothed exponential progression to identify trend reversals.

RD-forecast osc-15M_v1
Indicator

RD-forecast osc-15M_v1

The algorithm utilizes a weighted regression analysis and triple exponential smoothing to forecast price deviations relative to a dynamic moving average weight.
RD-ForecastOsc
Indicator

RD-ForecastOsc

This indicator calculates a percentage deviation of current prices from a weighted trend sum, subsequently applying a third-order T3 smoothing filter to project potential momentum shifts.
RD-ForecastOsc_001
Indicator

RD-ForecastOsc_001

The algorithm computes a weighted forecast oscillator by calculating the deviation of current price from a linear regression trend and smoothing it through a triple exponential moving average.

RD-ForecastOsc_v1
Indicator

RD-ForecastOsc_v1

This indicator calculates a forecasting oscillator by determining the deviation of current price from Weighted Trend values, processed through a T3 smoothing algorithm to identify momentum shifts.

RD-ForecastOsc_v2
Indicator

RD-ForecastOsc_v2

This indicator computes a momentum-based oscillation by calculating the percentage deviation of current price from a weighted linear regression mean, subsequently smoothed via a triple-exponential T3 filter.

RD-ForecastOsc_v3
Indicator

RD-ForecastOsc_v3

This indicator projects price momentum by calculating a weighted regression mean and applying a Triple Smoothing (T3) algorithm to filter noise from the forecast output.

RD-ForecastOsc_v5
Indicator

RD-ForecastOsc_v5

This indicator calculates a weighted moving average to derive price deviation, subsequently applying a third-order polynomial smoothing filter to generate predictive trend signals.

RD-Pivot Lines_J
Indicator

RD-Pivot Lines_J

This indicator projects automated support and resistance levels by synthesizing daily price action with standard pivots, Camarilla breakdown points, and intermediate midpoint calculations.

RD-Pivot Lines_J_v1
Indicator

RD-Pivot Lines_J_v1

This indicator dynamically plots standard pivot levels, Camarilla range boundaries, and subdivided midpoint zones based on previous day's price action extremes.

Indicator

RD-PivotLines 01

Indicator

RD-PivotLines 01_v1

Indicator

RD-PivotLines 01_v2

RD-PivotLines
Indicator

RD-PivotLines

This indicator dynamically calculates and plots high-order technical levels including standard pivots, Fibonacci retracements, Camarilla range bounds, and midpoint clusters based on multi-timezone session data.

RD-PivotLinesOld
Indicator

RD-PivotLinesOld

This indicator dynamically calculates daily pivot points, Camarilla levels, and midpoints by synchronizing historical price data with user-defined destination time zones and specific trading windows.

RD-PivotLinesOld_v1
Indicator

RD-PivotLinesOld_v1

This indicator calculates dynamic support and resistance levels including Standard Pivots, Camarilla range edges, and midpoint zones based on customizable session timeframes and global offsets.

RD-PivotLines_v1
Indicator

RD-PivotLines_v1

This technical indicator calculates and plots daily pivot points, Camarilla breakout levels, and intermediate midpoints based on historical price ranges to identify key supply and demand zones.

RD-PivotLines_v2
Indicator

RD-PivotLines_v2

This indicator dynamically calculates and plots classic pivots, Camarilla breakdown levels, and intermediate midpoints based on daily price ranges to identify key structural supply and demand zones.

realMACD
Indicator

realMACD

iMA

This indicator quantifies the velocity of price movement by calculating the divergence between two exponential moving averages and overlaying a smoothed signal line to identify momentum shifts.

Real_Time_MultiIndicator_v1
Indicator

Real_Time_MultiIndicator_v1

iMACDiADXiMAiSAR

This indicator aggregates signal data from Parabolic SAR, MACD, Moving Average crossovers, and ADX across multiple timeframes into a synchronized visual dashboard.

Real_Woodie_CCI
Indicator

Real_Woodie_CCI

iCCIiMA

This indicator synthesizes standard Commodity Channel Index calculations with an LSMA-based center line to visualize momentum shifts, price trends, and multi-stage state transitions through dynamic histogram coloring.

ReConnecter
Indicator

ReConnecter

This script programmatically navigates the MT4 Favorites window via Windows API calls to cycle logins between multiple trading accounts at predefined intervals.

Regression_Channel
Indicator

Regression_Channel

iMA

This indicator dynamically calculates a linear regression band by identifying significant price extremes and applying standard deviation offsets to determine volatility boundaries.

Regression_Channel
Indicator

Regression_Channel

iMA

This indicator automatically identifies significant price extremes relative to a moving average to construct a linear regression channel based on the standard deviation of price variance.