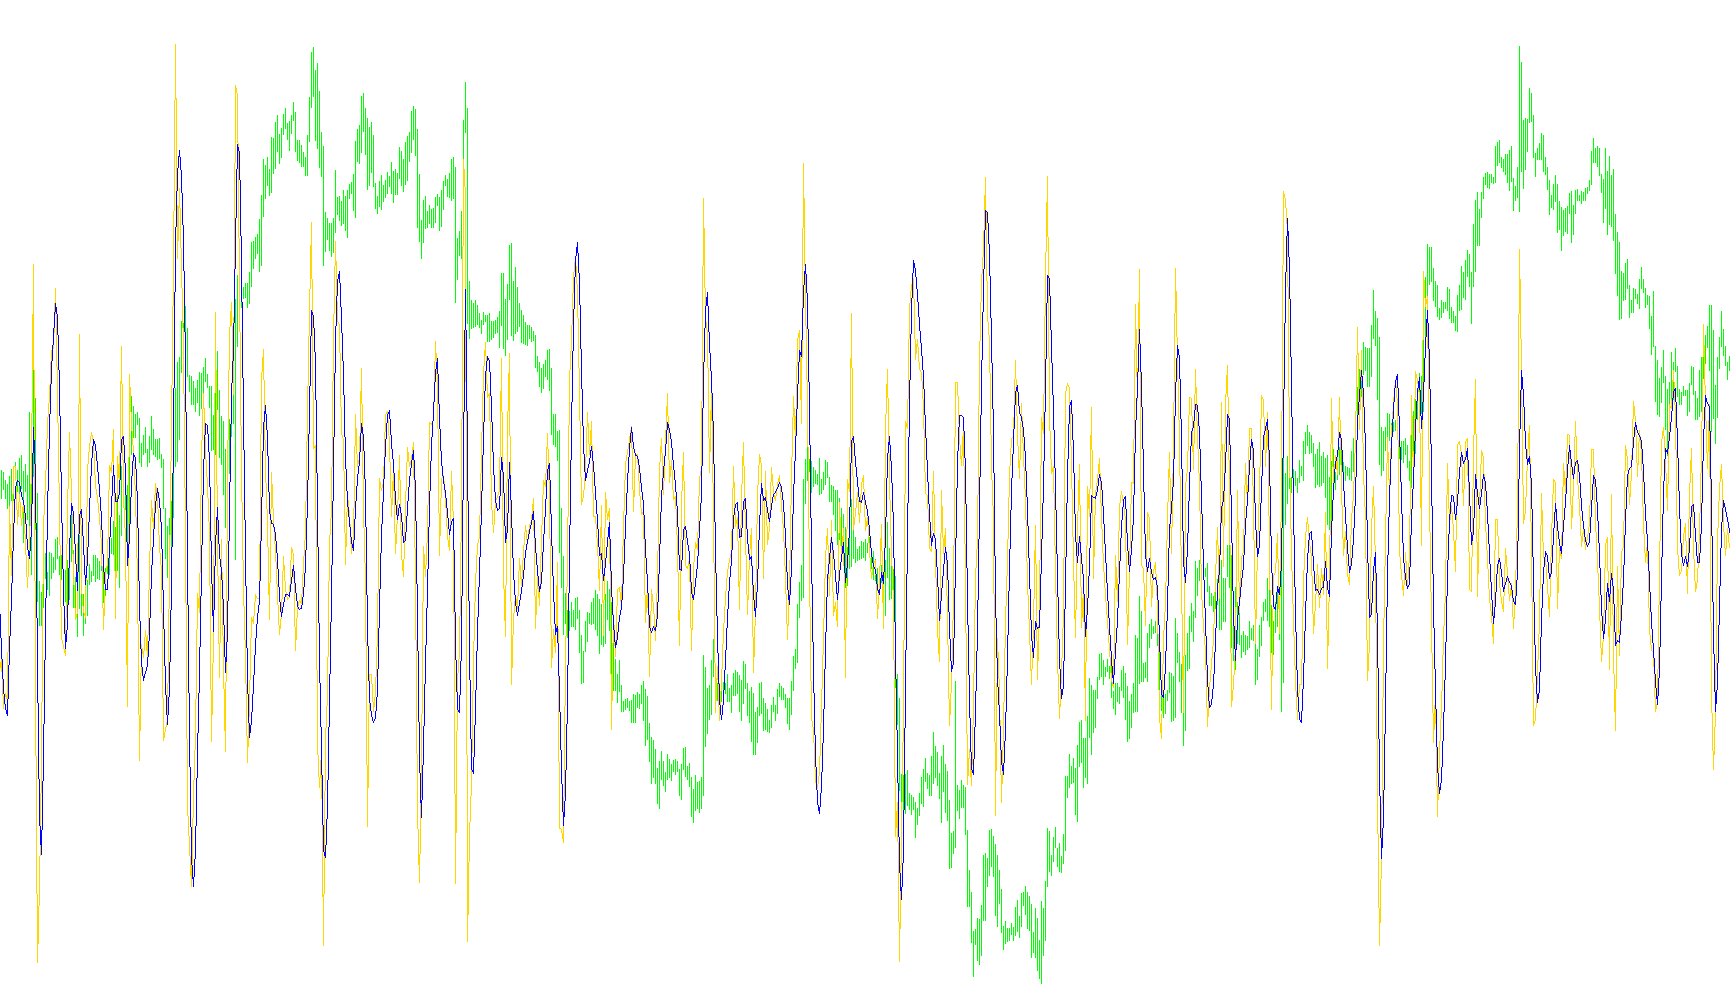
This tool is designed to help traders visualize market trends and potential momentum shifts by analyzing historical price data. It focuses on identifying the relationship between current prices and a calculated "weighted" average, providing a smoother look at how the market is moving compared to standard oscillators.
How the Logic Works
The script operates through a multi-step mathematical process to transform raw price movements into a readable forecast:
1. Weighted Trend Analysis Instead of simply looking at the most recent price, the tool calculates a "weighted" sum of closing prices over a specific period (defined by the Regression parameter). By giving different importance to various data points in this window, it creates a more stable baseline of where the market has been moving.
2. Deviation Calculation (The Forecast) The logic then compares the current market price against this weighted average. By calculating the percentage difference between the two, the tool produces a "Forecast" value. This tells you how far the price has stretched away from its established trend—essentially highlighting whether the market is overextended or moving strongly in one direction.
3. Smoothing and Projection (T3 Filtering) To make the data easier for a human to read, the script applies a sophisticated smoothing technique known as a T3 filter. This process takes the raw forecast values and rounds off sharp edges and "noise," creating a fluid line that represents the underlying momentum.
4. Predictive Signal Generation Finally, the tool uses specific coefficients to project these smoothed values forward. This allows the indicator to show not just where the market is now, but the direction in which the current momentum is likely heading based on the mathematical curvature of recent price action.
Summary for the User
In simple terms, this script filters out the "jitter" of the live market to show you a smoothed path of price momentum. It helps you see if the price is currently leading its trend or lagging behind it, providing a visual guide to help identify potential turning points in the market's direction.
//+------------------------------------------------------------------+
//|                                                 forecast osc.mq4 |
//|                Copyright © 2005, Nick Bilak, beluck[AT]gmail.com |
//|                                    http://metatrader.50webs.com/ |
//+------------------------------------------------------------------+
#property copyright "Copyright © 2005, Nick Bilak"
#property link      "http://metatrader.50webs.com/"

#property indicator_separate_window

#property indicator_buffers 2
#property indicator_level1 0

#property indicator_color1 SteelBlue
#property indicator_color2 Red


//---- input parameters
       int       Regress= 13;
       int       T3= 5;
       double    B= 0.8;

//---- buffers
double Osc[];
double Osct3[];

double HiSig[];
double LoSig[];


//+------------------------------------------------------------------+
//| Custom indicator initialization function                         |
//+------------------------------------------------------------------+
int init()
{
   SetIndexStyle(0,DRAW_LINE);
   SetIndexBuffer(0,Osc);

   SetIndexEmptyValue(0,0);
   SetIndexStyle(1,DRAW_LINE);
   SetIndexBuffer(1,Osct3);

   return(0);
}

//+------------------------------------------------------------------+
//| Custor indicator deinitialization function                       |
//+------------------------------------------------------------------+
int deinit()
{
   return(0);
}

//+------------------------------------------------------------------+
//| Custom indicator iteration function                              |
//+------------------------------------------------------------------+
int start()
{
   int counted_bars= IndicatorCounted(),
       limit;

   if (counted_bars<0) return(-1);
   if (counted_bars>0) counted_bars--;

   limit= Bars - counted_bars;

   ForecastOsc(0, limit, Osc, Osct3, Regress, T3, B);

   return (0);
}


//+------------------------------------------------------------------+
//| Calc forecast buffers  from lastbar down to offset               |
//+------------------------------------------------------------------+
void ForecastOsc(int offset, int lastbar, double &osc[], double &osct3[], int regress, int t3, double b)
{

   int shift, length;
   double b2,b3,c1,c2,c3,c4,w1,w2,n,WT,
          forecastosc,t3_fosc,sum,
          e1,e2,e3,e4,e5,e6,tmp,tmp2;

   lastbar= MathMin(Bars-31-regress, lastbar);

   for (shift= lastbar+30; shift>=offset; shift--)   {

      b2=b*b;
      b3=b2*b;
      c1=-b3;
      c2=(3*(b2+b3));
      c3=-3*(2*b2+b+b3);
      c4=(1+3*b+b3+3*b2);
      n=t3;

      if (n<1) n=1;
      n = 1 + 0.5*(n-1);
      w1 = 2 / (n + 1);
      w2 = 1 - w1;

      length= regress;
      sum = 0;
      for (int i = length; i>0; i--) {
         tmp = length+1;
         tmp = tmp/3;
         tmp2 = i;
         tmp = tmp2 - tmp;
         sum = sum + tmp*Close[shift+length-i];
      }
      tmp = length;

      WT = sum*6/(tmp*(tmp+1));

      forecastosc= (Close[shift]-WT)/WT*100;

      e1 = w1*forecastosc + w2*e1;
      e2 = w1*e1 + w2*e2;
      e3 = w1*e2 + w2*e3;
      e4 = w1*e3 + w2*e4;
      e5 = w1*e4 + w2*e5;
      e6 = w1*e5 + w2*e6;

      t3_fosc = c1*e6 + c2*e5 + c3*e4 + c4*e3;

      if (shift<=lastbar) {   // don't put swing in cycle into the signal buffers
         osc[shift] = forecastosc;
         osct3[shift] = t3_fosc;
      }

    }

   return(0);
}
Comments