RD-forecast osc-15M_v1
Download script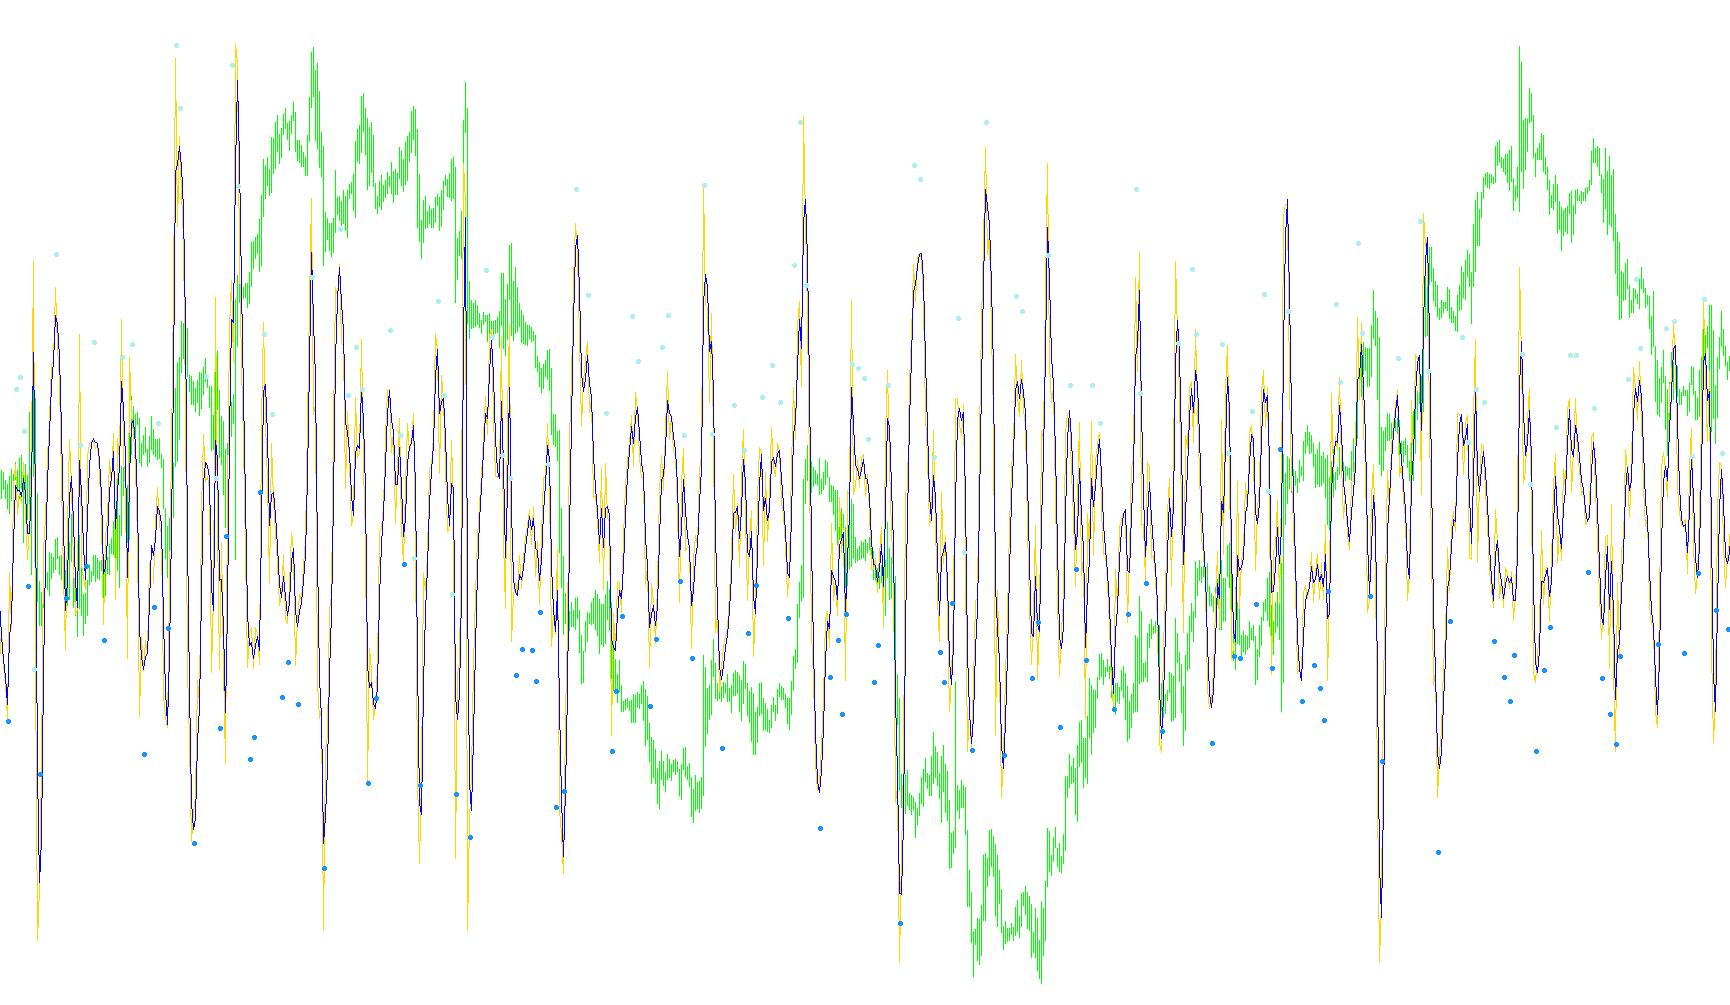
This indicator is designed to provide traders with a predictive look into price momentum by blending historical data analysis with mathematical smoothing techniques. Instead of simply showing where the price has been, it attempts to calculate where the price is likely headed by analyzing current trends and filtering out market "noise."
Core Methodology
The logic operates through three distinct phases:
1. Trend Analysis (Weighted Calculations) The script begins by examining a specific window of historical closing prices. It calculates a weighted average that gives more significance to recent data points than older ones. This helps the tool understand the prevailing direction of the market while ensuring that outdated price movements do not skew the current perspective.
2. The Forecast Oscillator Once the trend is identified, the script calculates a "Forecast Oscillator." This is a percentage-based value that represents the discrepancy between the current price and the calculated weighted average. Essentially, it measures how far the market has stretched away from its established trend. By converting this into an oscillator, the tool makes it easier for traders to visualize overextended movements or potential reversals.
3. Multi-Stage Smoothing and Prediction To ensure the signals are reliable and not just reacting to every minor price flicker, the script applies a complex series of smoothing filters (referred to as a Triple Exponential approach). It passes the oscillator values through multiple layers of mathematical "filters," which progressively refine the data. The final output is a smoothed predictive line that follows the forecast oscillator more fluidly than the raw data would allow.
Visual Signals and Interpretation
The tool provides two primary visual outputs on the chart:
- Trend Lines: These represent the smoothed forecast of the market’s momentum. When these lines move in sync, they indicate a steady trend; when they begin to diverge or flatten, it suggests a potential change in momentum.
- Automated Signals: The script identifies specific "trigger points" where the primary oscillator crosses its smoothed predictive line.
- High Signals: These appear when the momentum shows a sharp shift upward relative to its smoothed path, potentially indicating a buying opportunity.
- Low Signals: These appear when the momentum drops below its smoothed path, suggesting a potential selling opportunity or downward pressure.
By combining these elements, the indicator serves as a sophisticated guide for identifying trend strength and pinpointing high-probability moments where price action might be about to pivot.
/*-----------------------------+
|			       |
| Shared by www.Aptrafx.com    |
|			       |
+------------------------------*/

//+------------------------------------------------------------------+
//|                                                 forecast osc.mq4 |
//|                Copyright © 2005, Nick Bilak, beluck[AT]gmail.com |
//|                                    http://metatrader.50webs.com/ |
//+------------------------------------------------------------------+
#property copyright "Copyright © 2005, Nick Bilak"
#property link      "http://metatrader.50webs.com/"

#property indicator_separate_window
#property indicator_buffers 4
#property indicator_level1 0
#property indicator_color1 SteelBlue
#property indicator_color2 HotPink
#property indicator_color3 Magenta
#property indicator_color4 Aqua

//---- input parameters
extern int       regress=15;
extern int       t3=3;
extern double    b=0.7;

//---- buffers
double osc[];
double osct3[];
double hiSig[];
double loSig[];

int shift,limit,length;
double b2,b3,c1,c2,c3,c4,w1,w2,n,WT,forecastosc,t3_fosc,sum,e1,e2,e3,e4,e5,e6,tmp,tmp2;

//+------------------------------------------------------------------+
//| Custom indicator initialization function                         |
//+------------------------------------------------------------------+
int init()
  {
//---- indicators
//   SetIndexStyle(0,DRAW_HISTOGRAM);
   SetIndexStyle(0,DRAW_LINE);
   SetIndexBuffer(0,osc);
   SetIndexEmptyValue(0,0);

   SetIndexStyle(1,DRAW_LINE);
   SetIndexBuffer(1,osct3);

   SetIndexStyle(2,DRAW_ARROW);
   SetIndexBuffer(2,hiSig);
   SetIndexEmptyValue(2,EMPTY_VALUE);
   SetIndexArrow(2,159);

   SetIndexStyle(3,DRAW_ARROW);
   SetIndexBuffer(3,loSig);
   SetIndexEmptyValue(3,EMPTY_VALUE);
   SetIndexArrow(3,159);
//----
   return(0);
  }
//+------------------------------------------------------------------+
//| Custor indicator deinitialization function                       |
//+------------------------------------------------------------------+
int deinit()
  {
   return(0);
  }
//+------------------------------------------------------------------+
//| Custom indicator iteration function                              |
//+------------------------------------------------------------------+
int start()
  {
   int counted_bars=IndicatorCounted();

   if (counted_bars<0) return(-1);
   if (counted_bars>0) counted_bars--;
   limit=Bars-31;
   if(counted_bars>=31) limit=Bars-counted_bars+2;

   for (shift=limit+30;shift>=0;shift--)   {

      b2=b*b;
      b3=b2*b;
      c1=-b3;
      c2=(3*(b2+b3));
      c3=-3*(2*b2+b+b3);
      c4=(1+3*b+b3+3*b2);
      n=t3;

      if (n<1) n=1;
      n = 1 + 0.5*(n-1);
      w1 = 2 / (n + 1);
      w2 = 1 - w1;

      length=regress;
      sum = 0;
      for (int i = length; i>0; i--) {
         tmp = length+1;
         tmp = tmp/3;
         tmp2 = i;
         tmp = tmp2 - tmp;
         sum = sum + tmp*Close[shift+length-i];
      }
      tmp = length;
      WT = sum*6/(tmp*(tmp+1));

      forecastosc=(Close[shift]-WT)/WT*100;

      e1 = w1*forecastosc + w2*e1;
      e2 = w1*e1 + w2*e2;
      e3 = w1*e2 + w2*e3;
      e4 = w1*e3 + w2*e4;
      e5 = w1*e4 + w2*e5;
      e6 = w1*e5 + w2*e6;

      t3_fosc = c1*e6 + c2*e5 + c3*e4 + c4*e3;

      osc[shift] = forecastosc;
      osct3[shift] = t3_fosc;

      if (osc[shift+1] > osct3[shift+2] && osc[shift+2] <= osct3[shift+3] && osct3[shift+1]<0) loSig[shift+1] = t3_fosc-0.05;
      if (osc[shift+1] < osct3[shift+2] && osc[shift+2] >= osct3[shift+3] && osct3[shift+1]>0) hiSig[shift+1] = t3_fosc+0.05;

   }
   return(0);
  }
//+------------------------------------------------------------------+
Comments