RSI-TC_NEW_Alert2
Indicator

RSI-TC_NEW_Alert2

iBandsiATRiMAiRSI

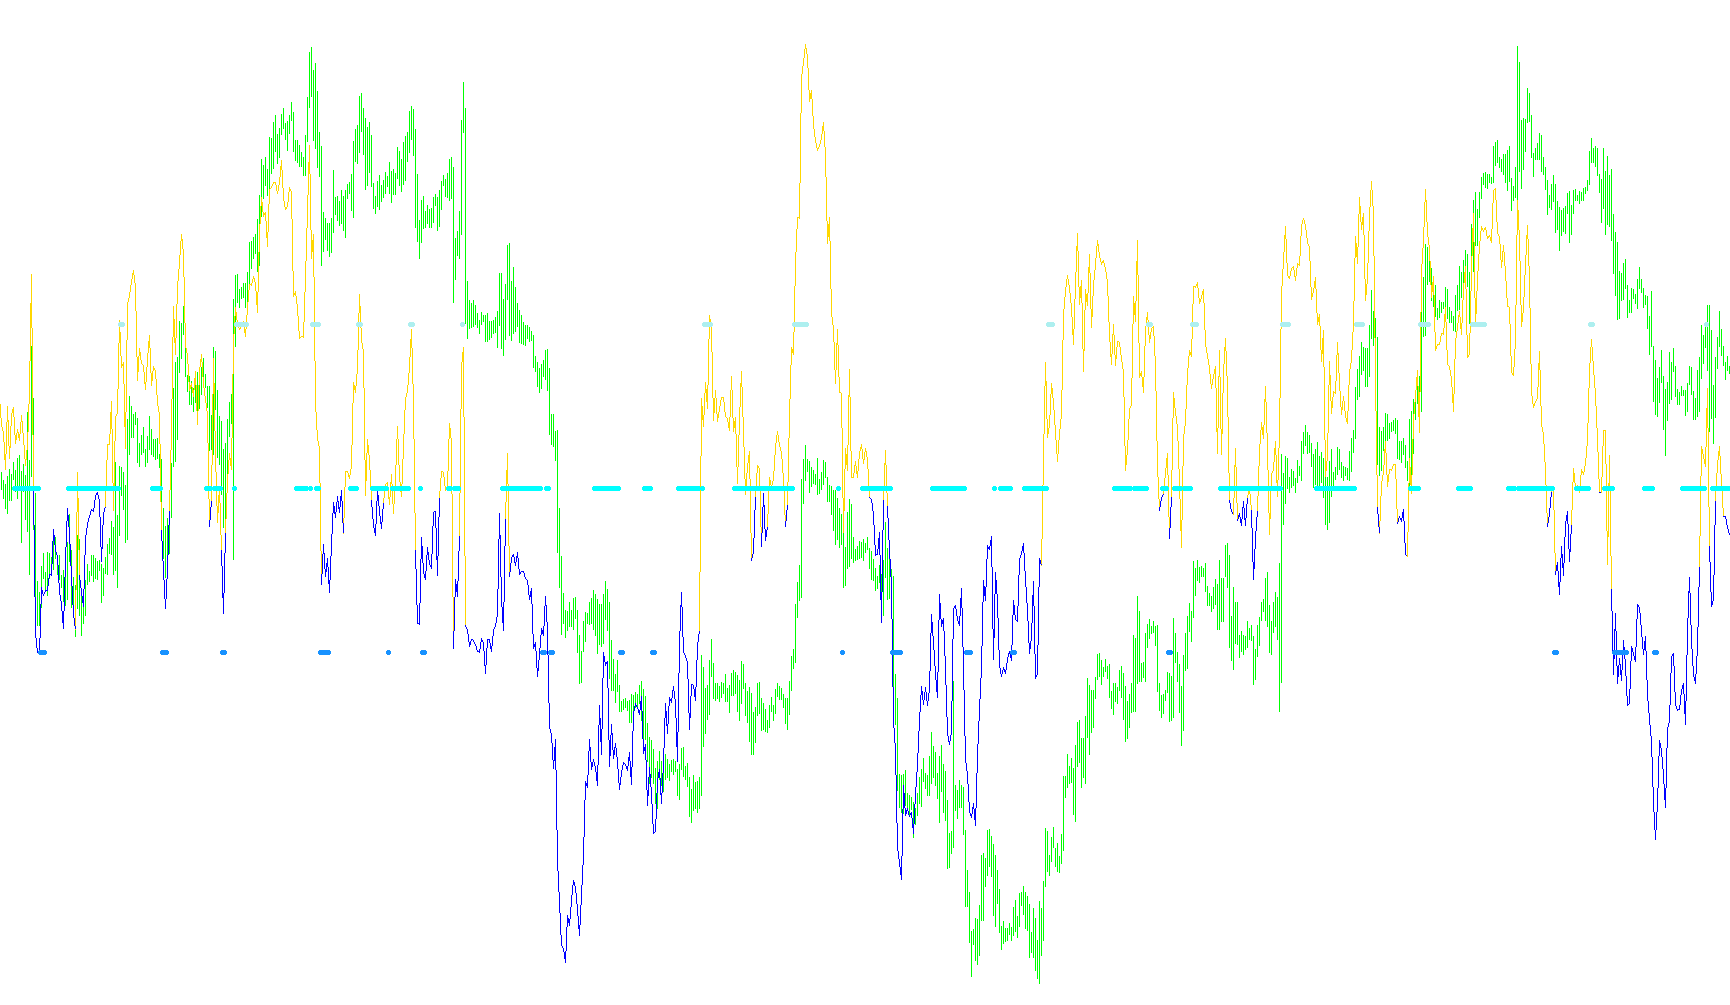
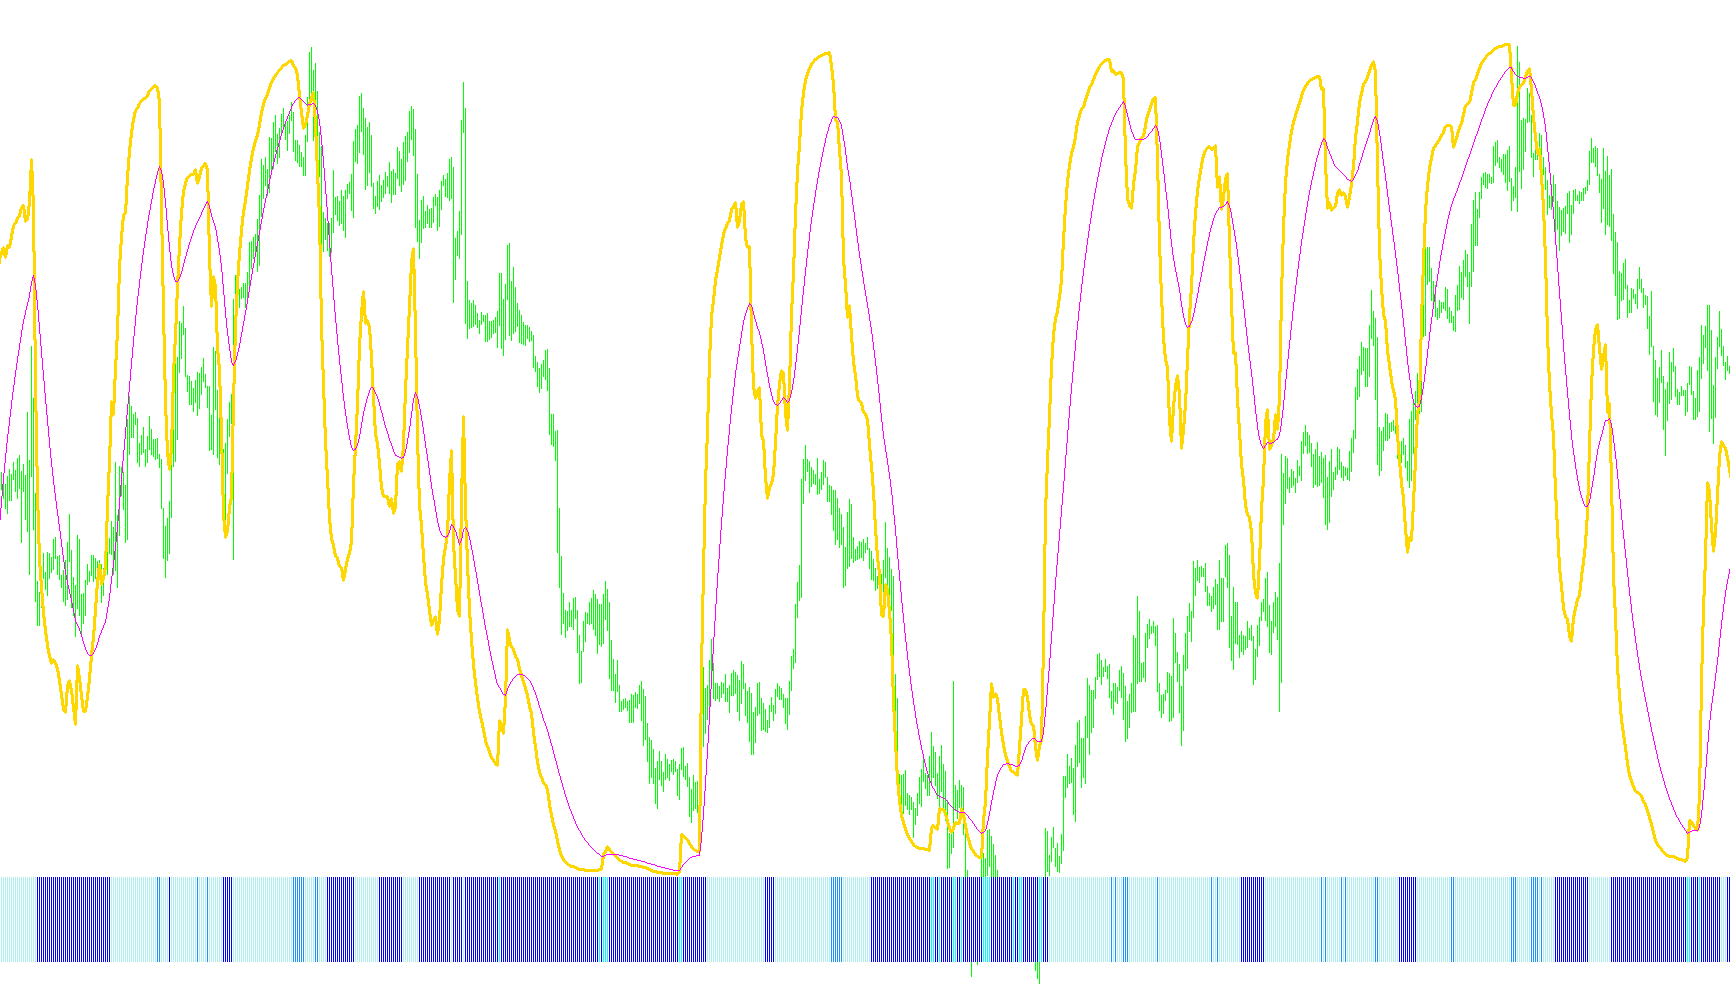
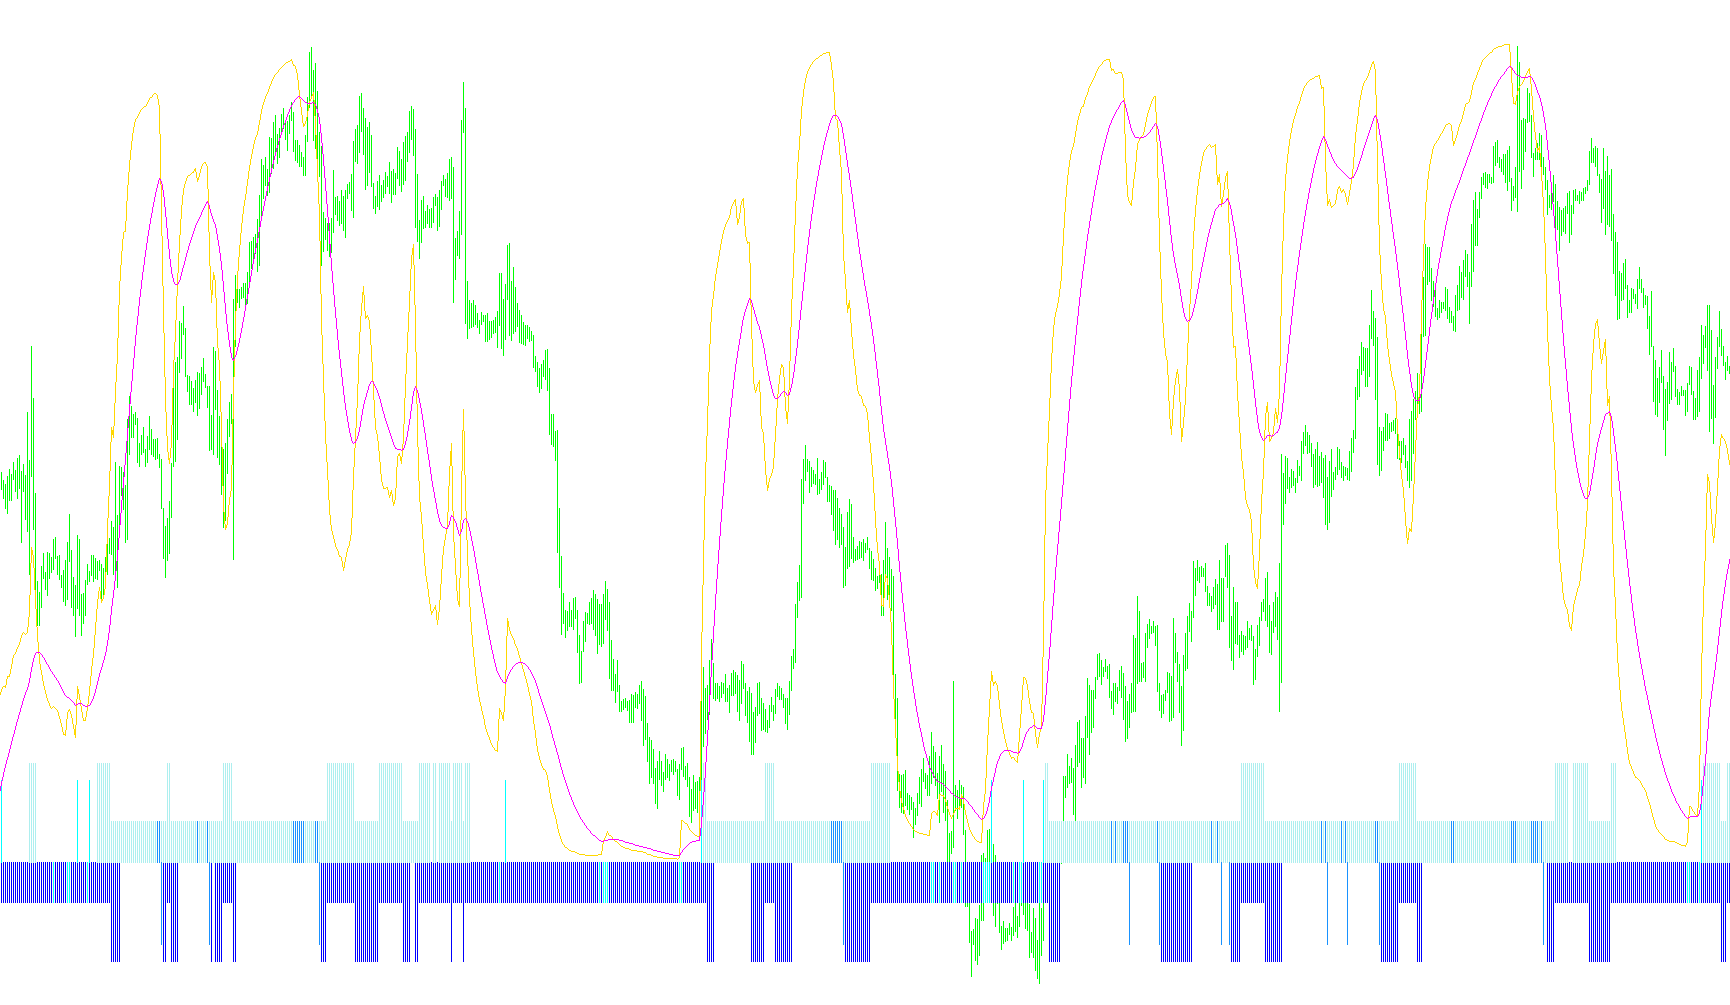
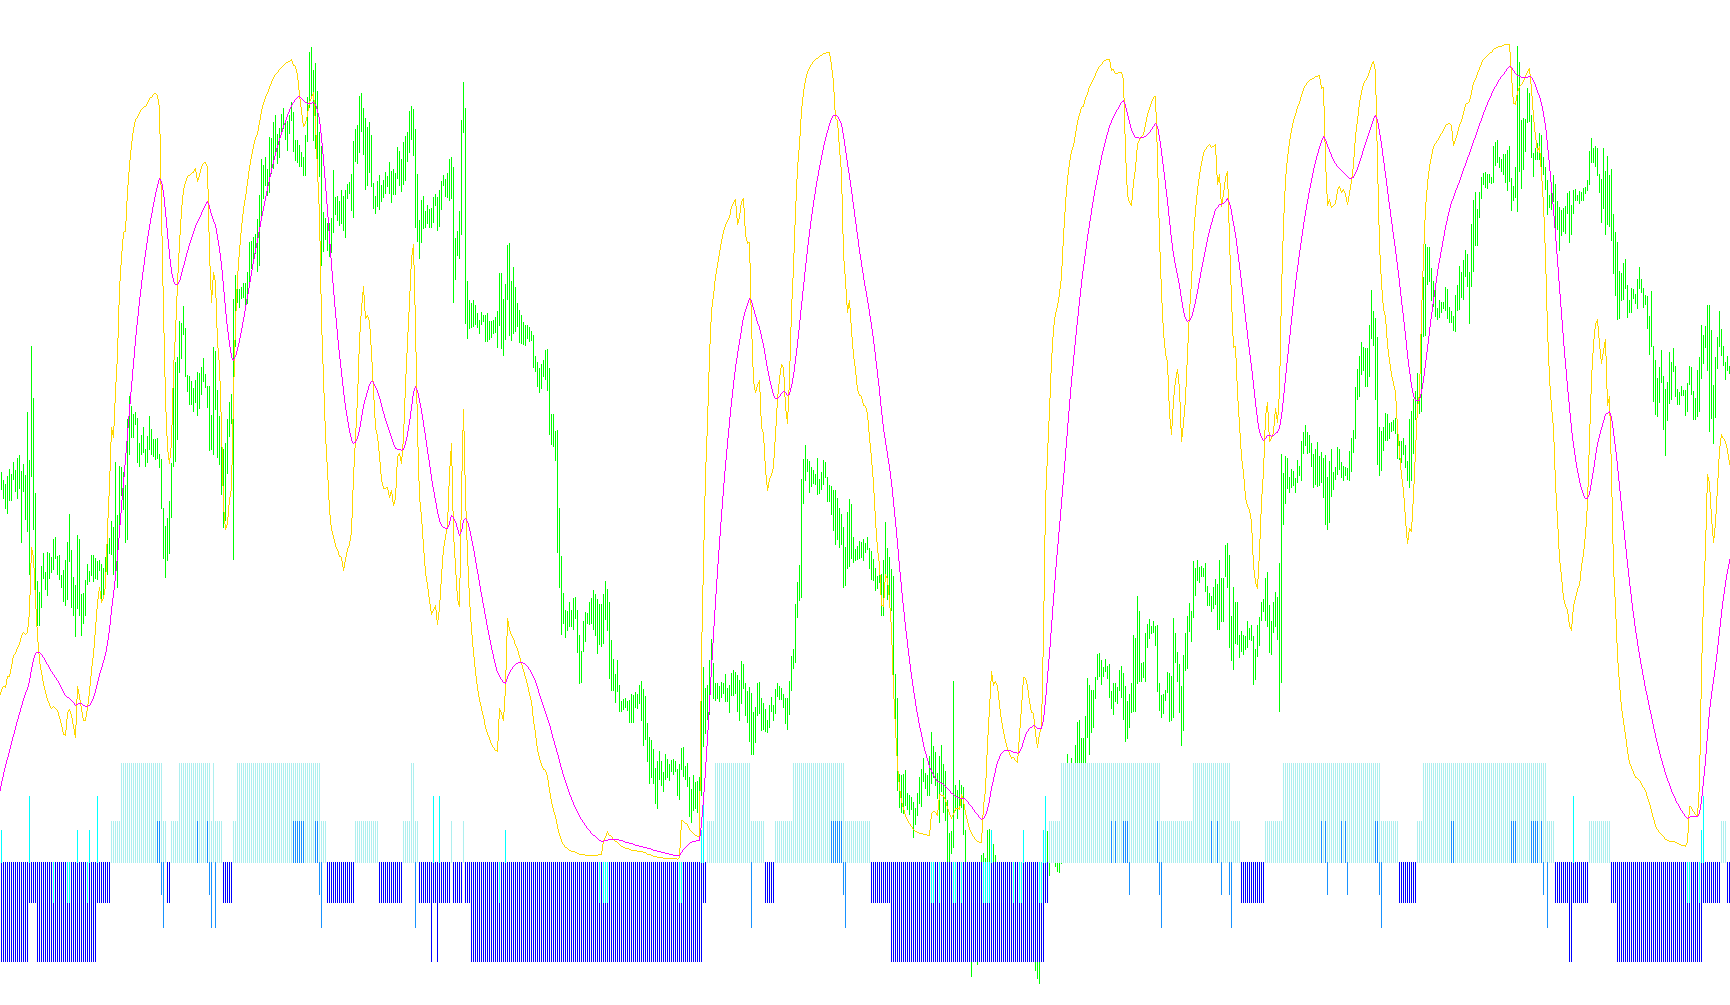
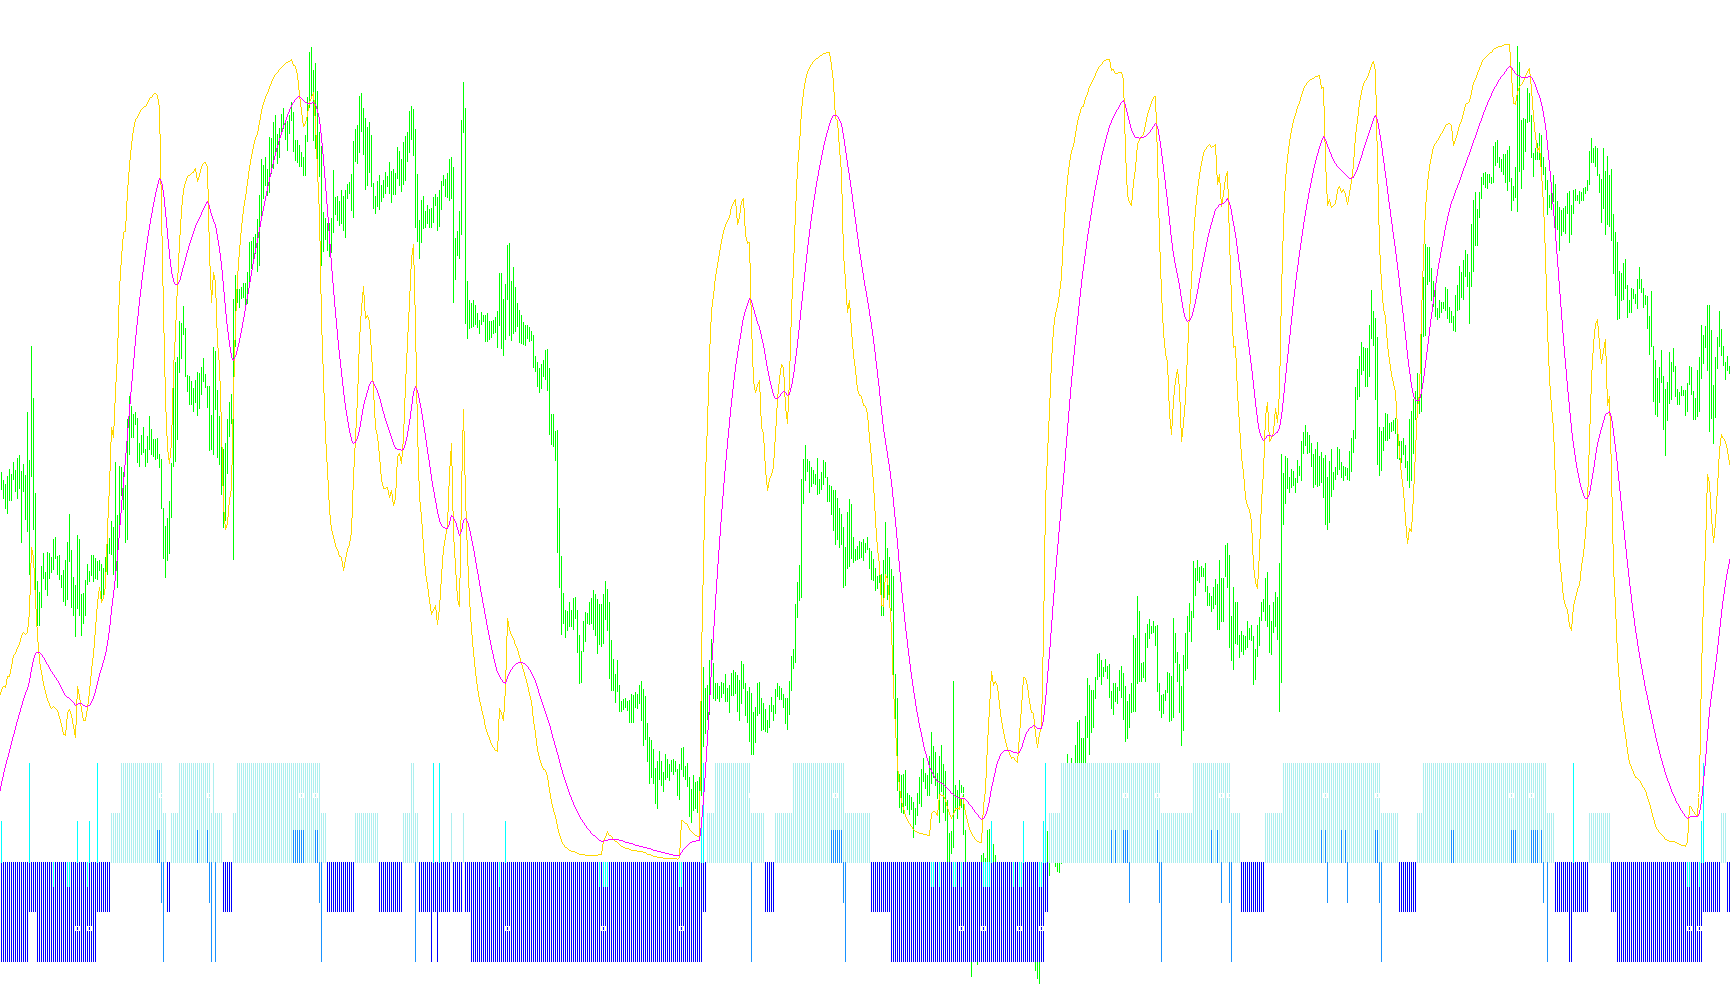
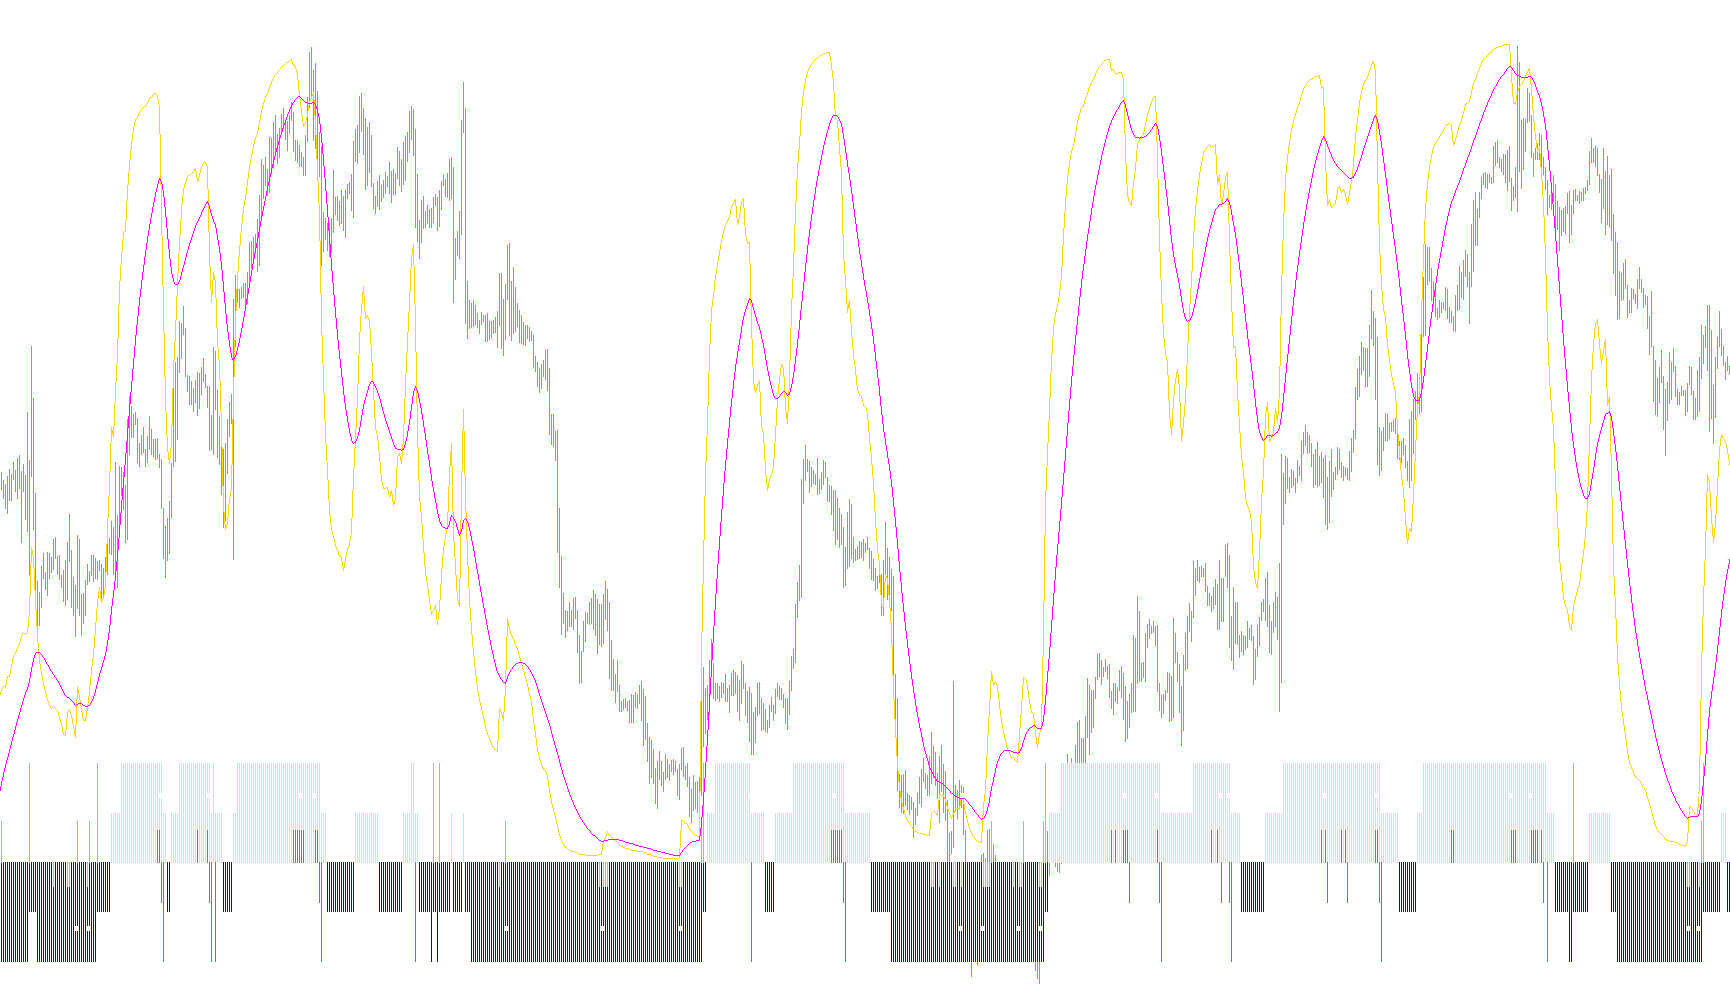
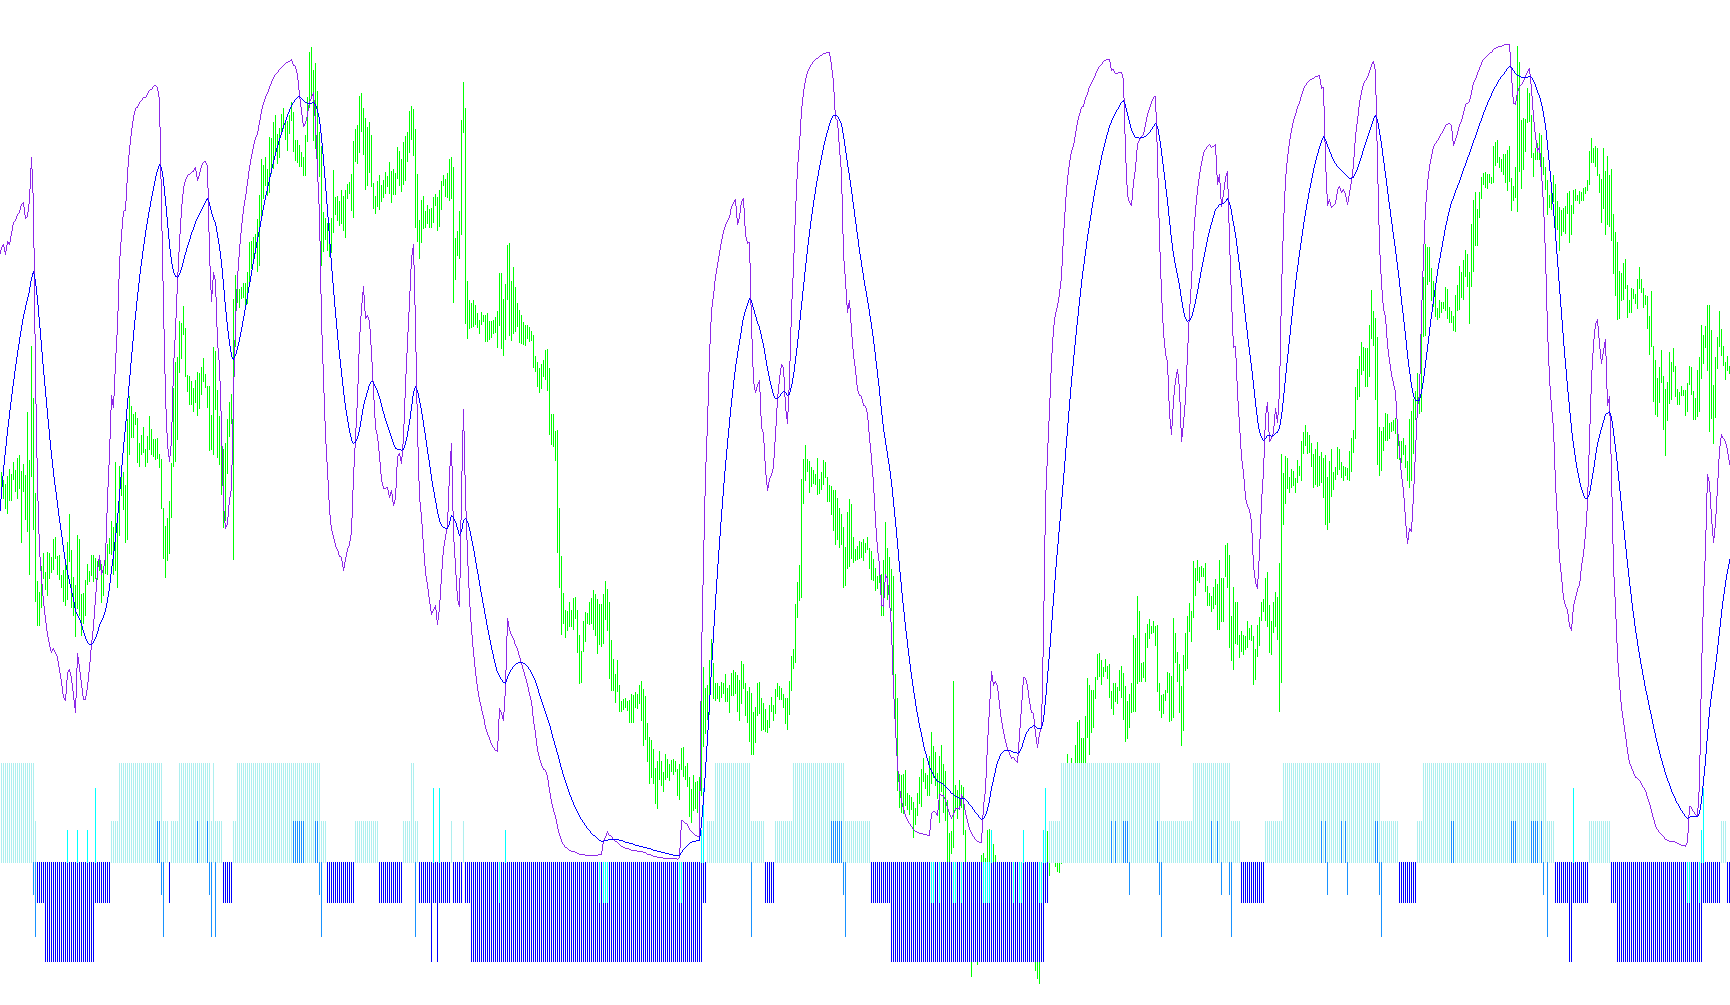
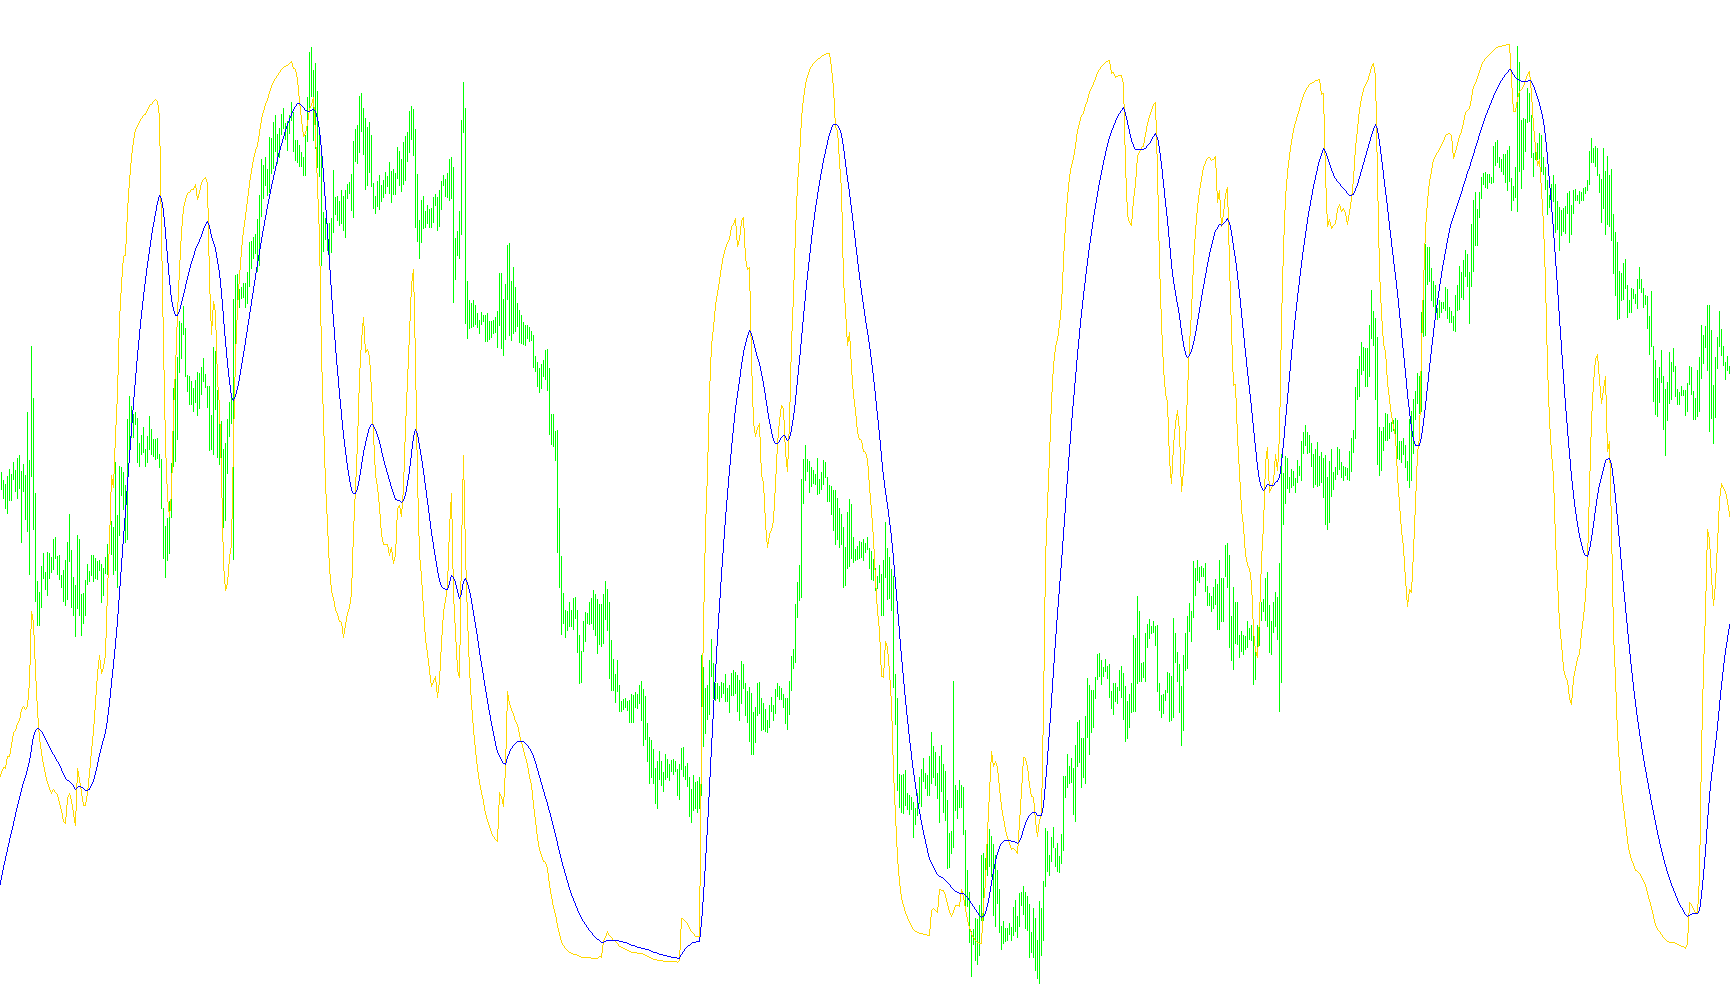
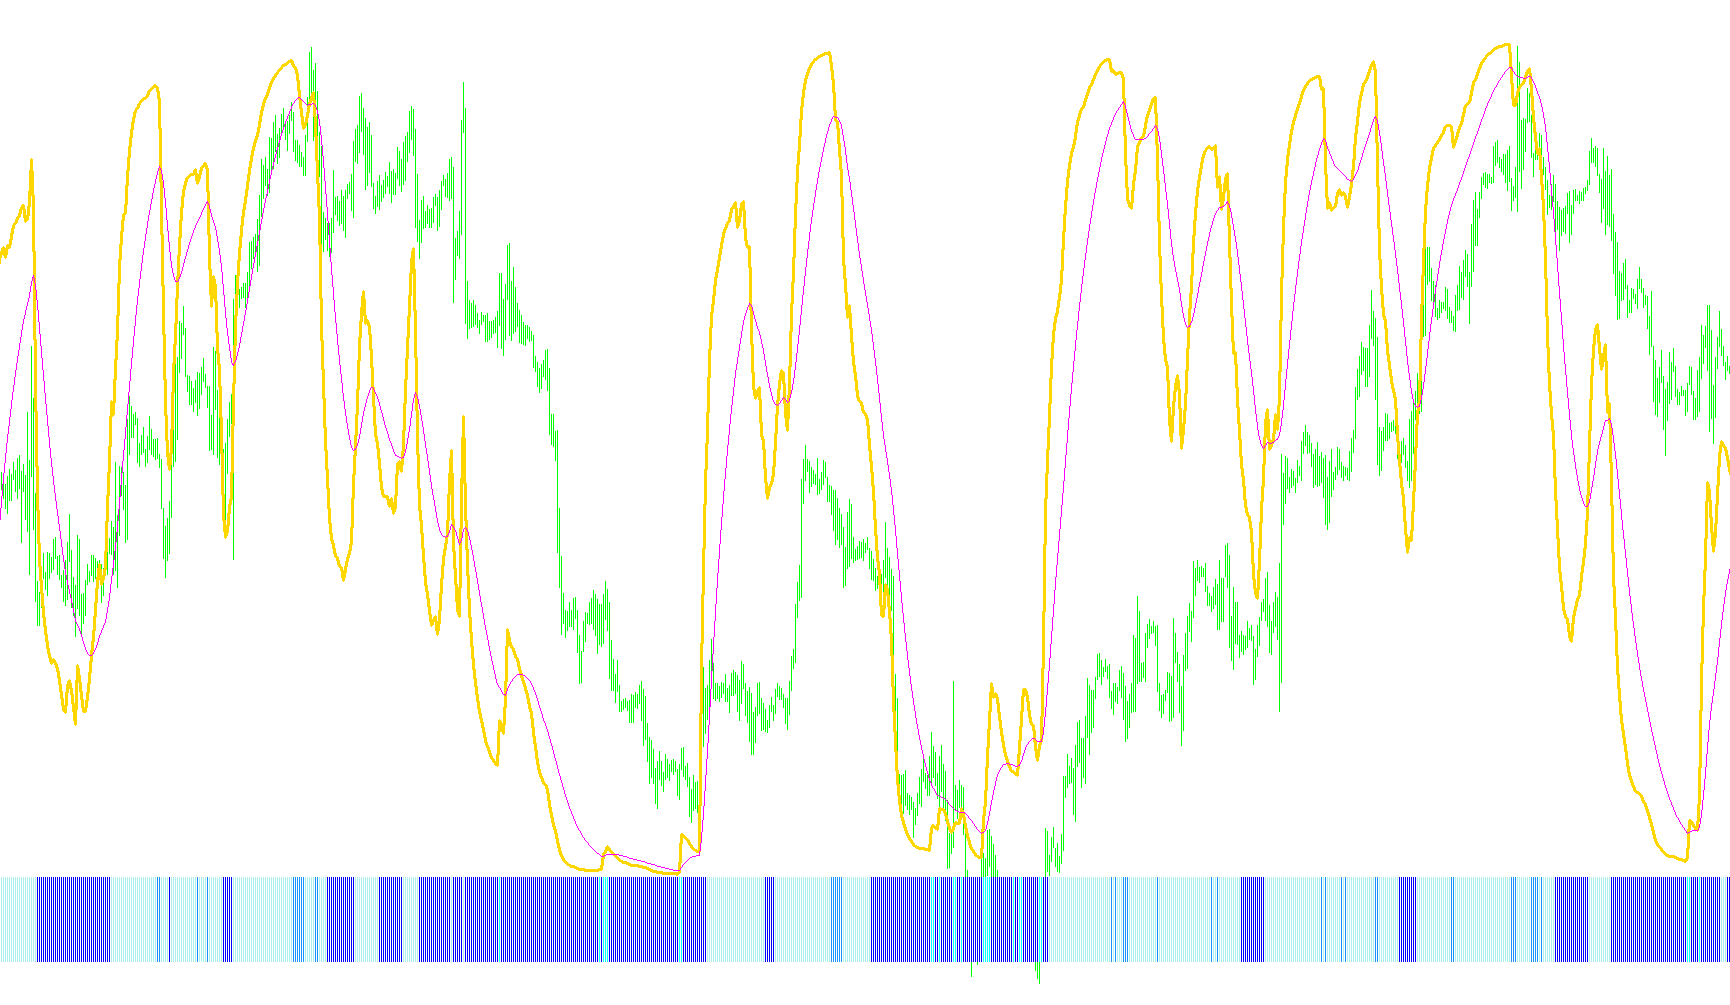
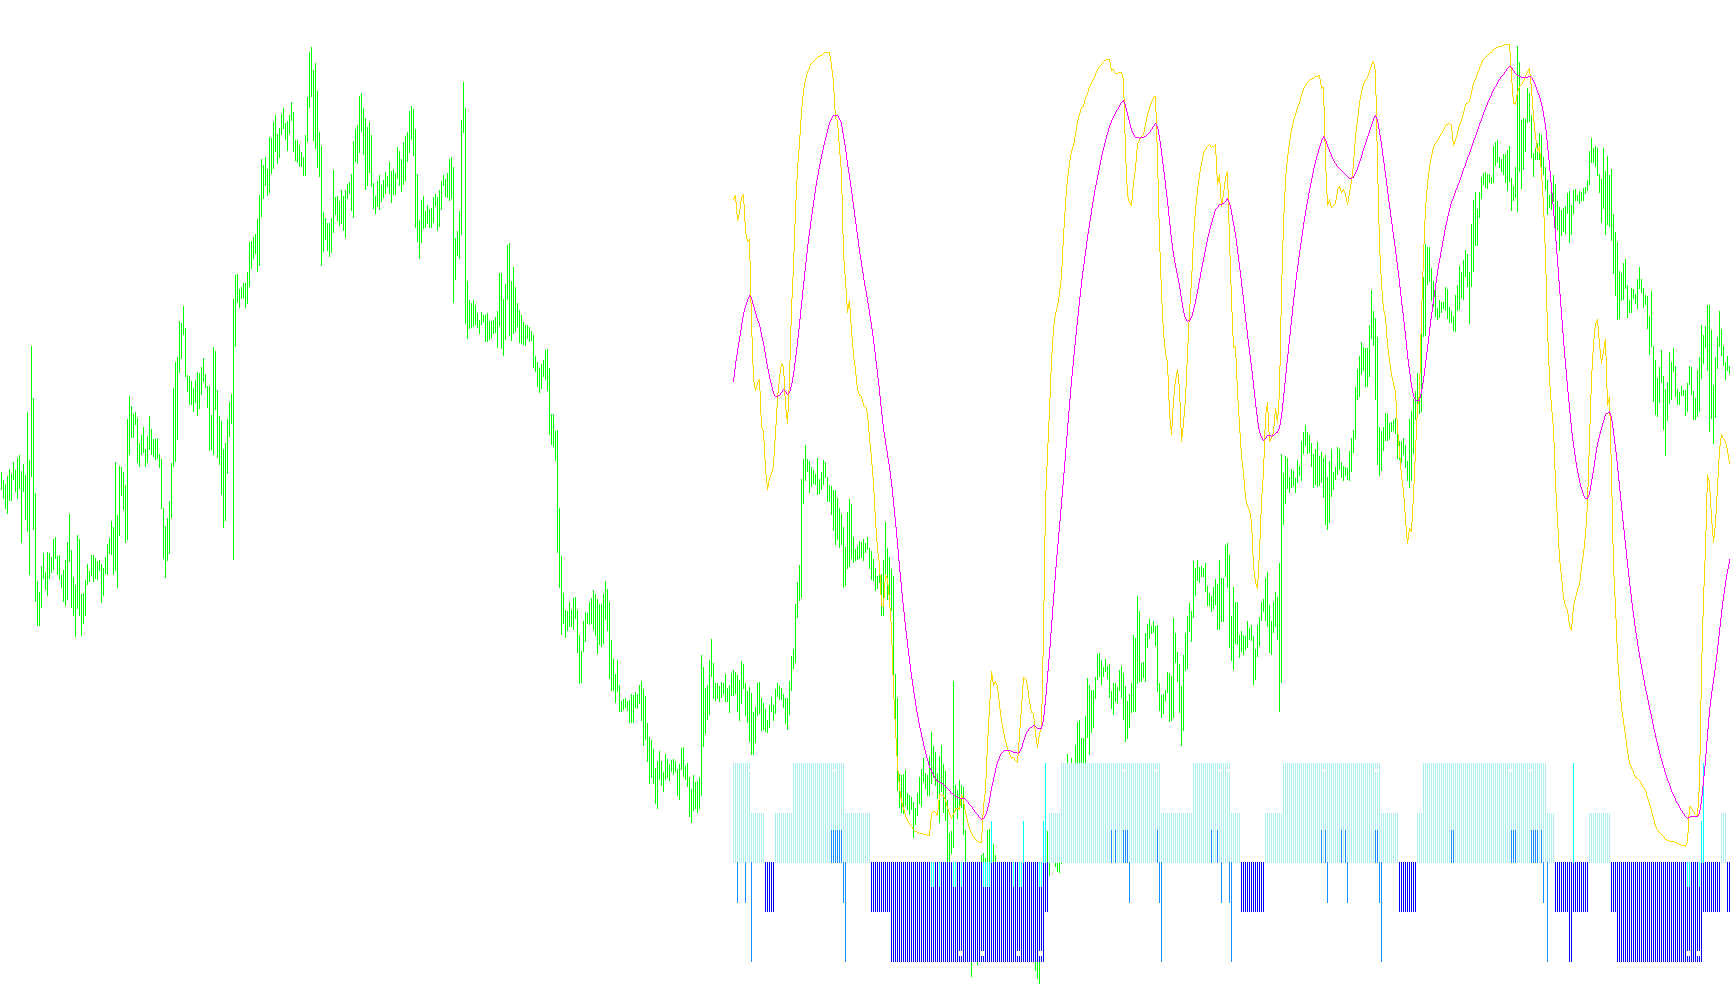
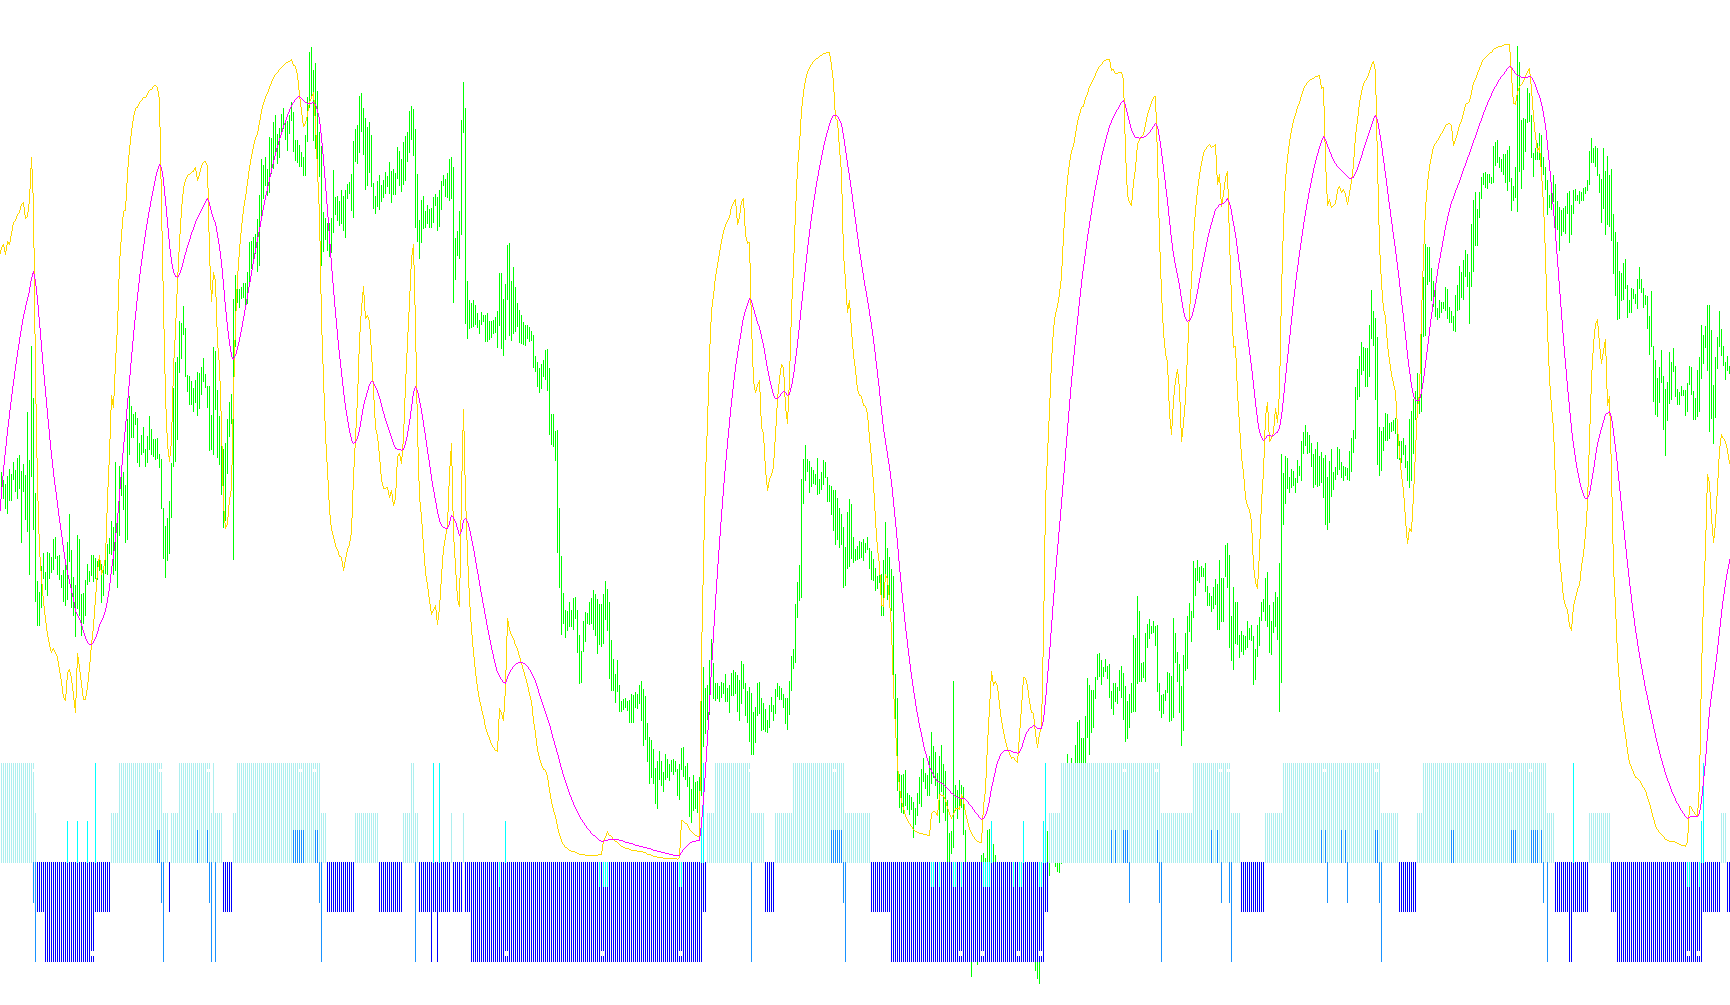
This indicator identifies high-probability trend reversals by detecting price volatility compression (Squeeze) and validating breakouts through RSI momentum shifts and Bollinger Band expansions.

RSI-TC_NEW_v2
Indicator

RSI-TC_NEW_v2

iBandsiATRiMAiRSI

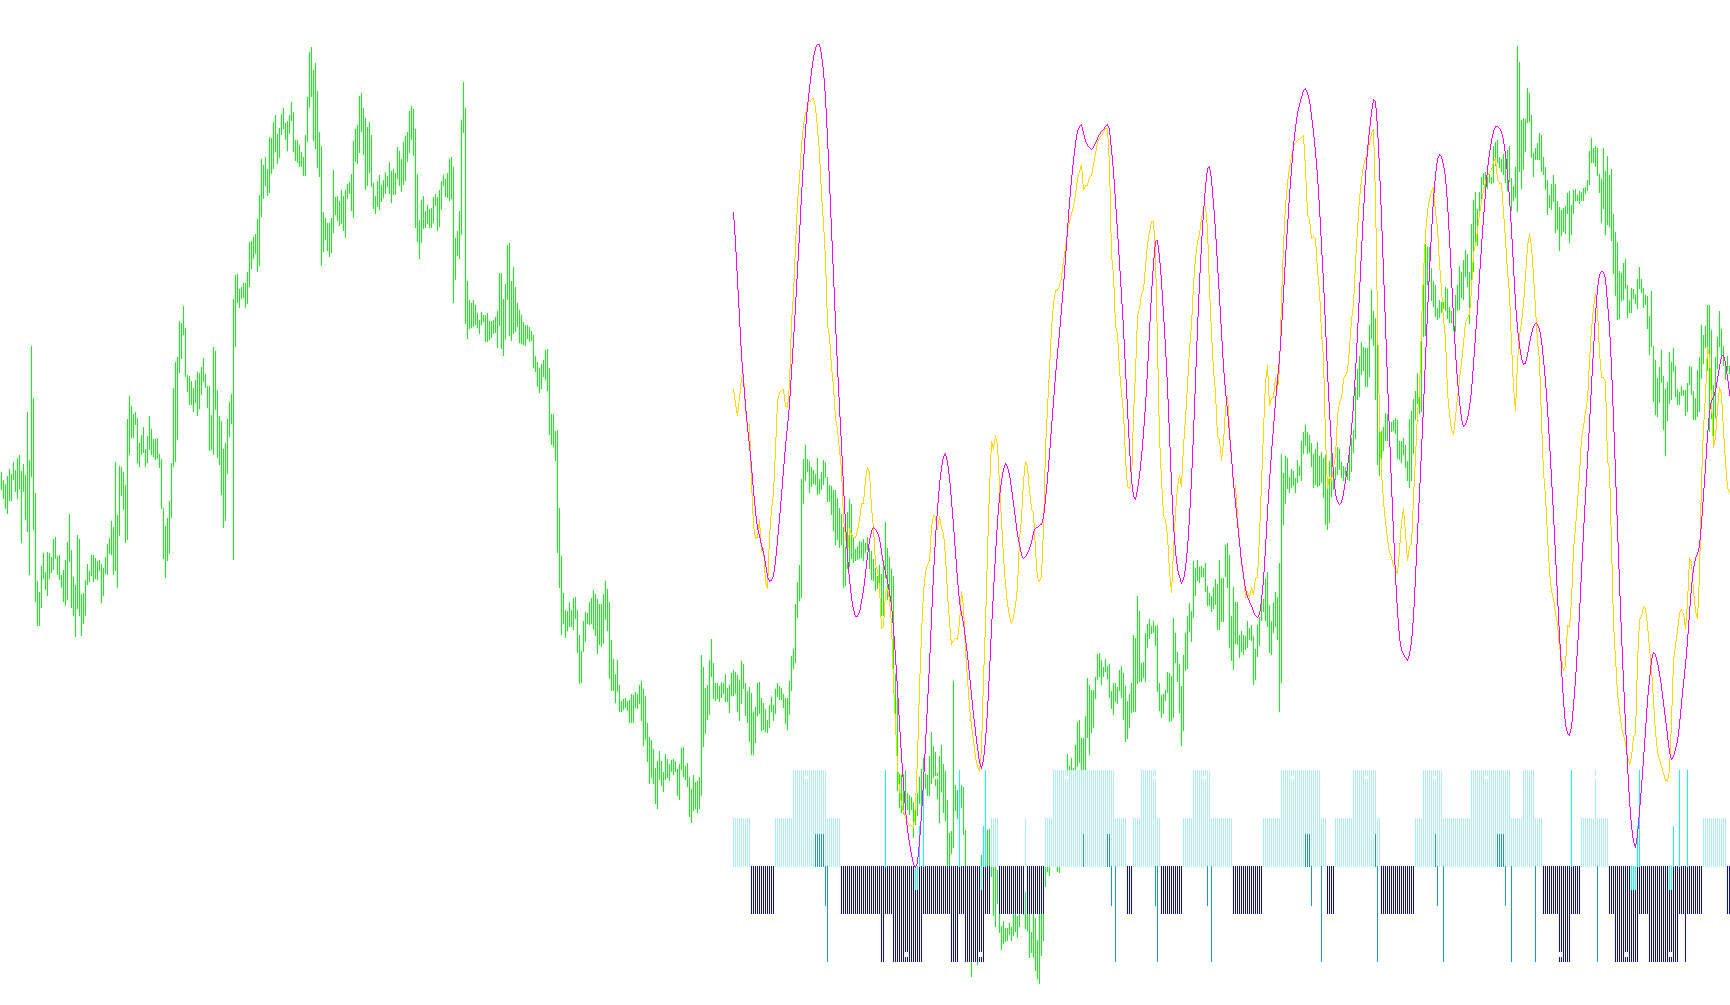
This indicator identifies high-probability trend continuations by detecting volatility 'squeezes' through Bollinger Band and Keltner Channel convergence, filtered by RSI momentum shifts.

RSI-TC_v1
Indicator

RSI-TC_v1

iBandsiATRiMAiRSI

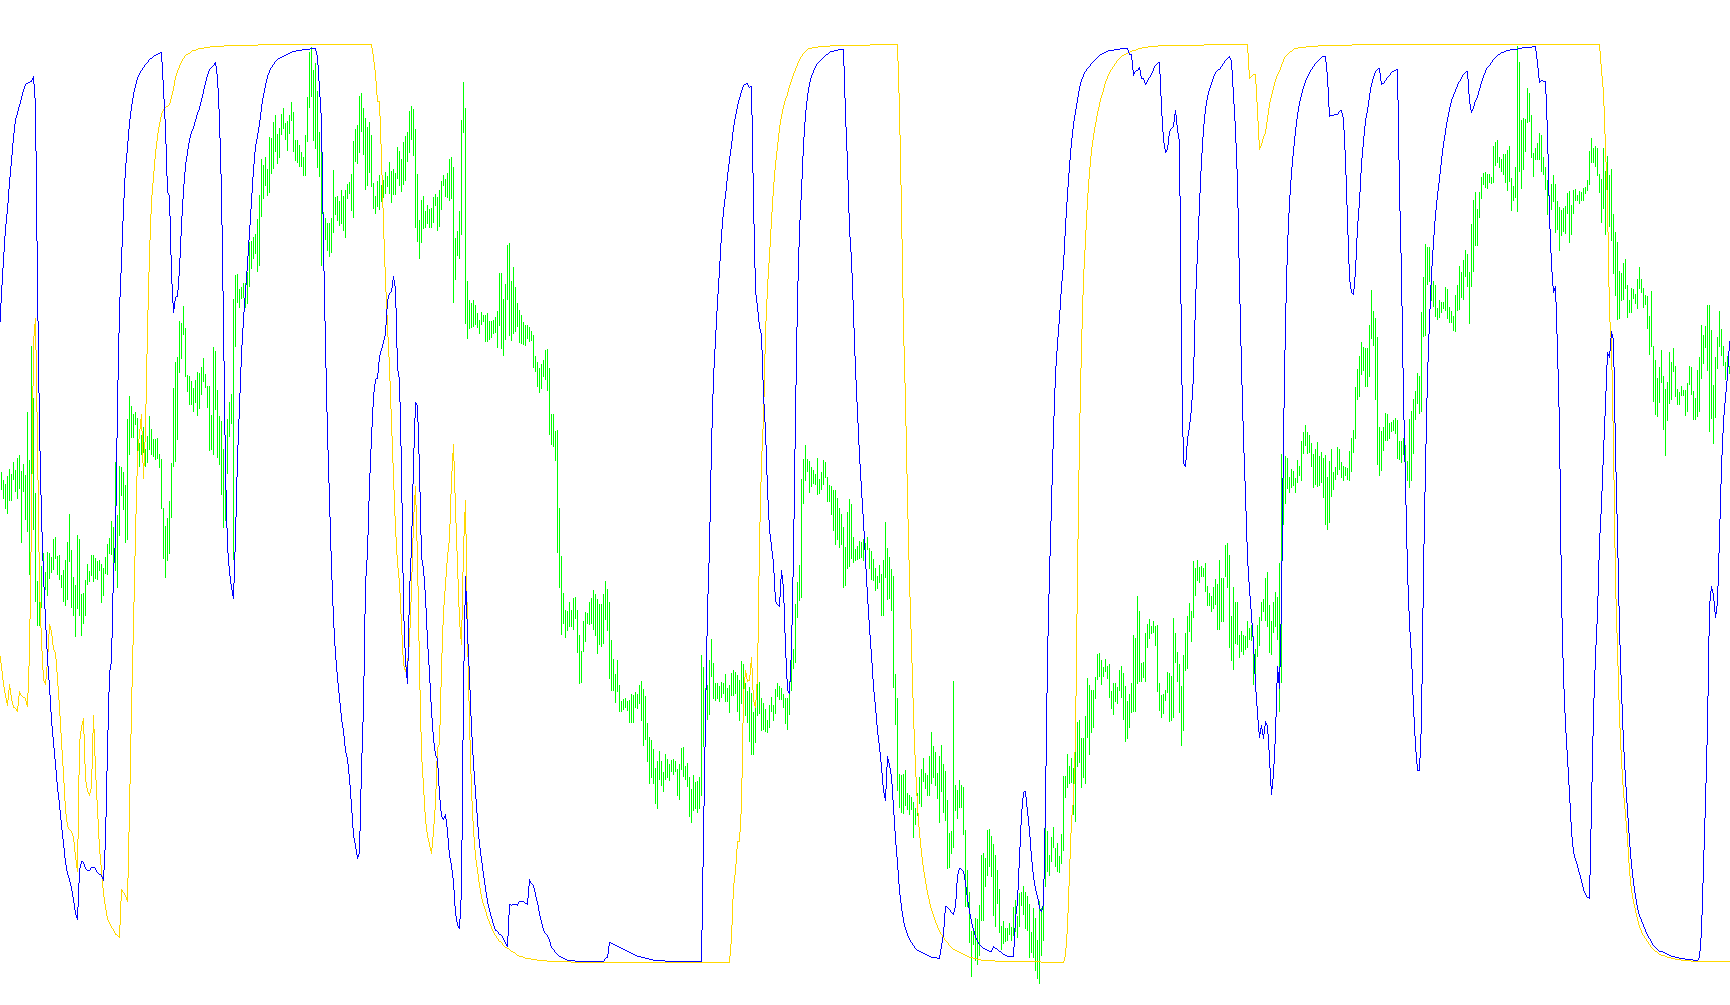
This indicator identifies high-probability entries by synchronizing RSI momentum with the spatial divergence between Bollinger Bands and SuperTrend volatility envelopes.

RSI
Indicator

RSI

Calculates a smoothed relative strength metric by aggregating price velocity into a normalized momentum scale.

Indicator

RSIArrows

iRSI
rsier1m
Indicator

rsier1m

This indicator identifies potential trend reversal points by detecting specific cross-over thresholds on the Relative Strength Index (RSI) across different timeframes.

rsier1m2
Indicator

rsier1m2

Identifies reversal opportunities by detecting instances where the RSI values cross specific overbought and oversold boundaries on a multi-timeframe basis.

rsier1m2_v1
Indicator

rsier1m2_v1

Identifies potential trend exhaustion by detecting when the multi-timeframe RSI crosses the 30 and 70 oversold and overbought boundaries.

rsier1m_v1
Indicator

rsier1m_v1

The indicator identifies bullish entries when the Multi-Timeframe RSI crosses upward through the 30 level and bearish entries when it crosses downward below the 70 level.

RSIFilter_v1
Indicator

RSIFilter_v1

iRSI

This indicator identifies trend reversals by monitoring RSI breaches of extreme boundaries and maintains visual signals based on secondary momentum levels.

RSIFilter_v1_001
Indicator

RSIFilter_v1_001

iRSI

This indicator filters directional momentum by identifying extreme RSI boundaries to establish a trend bias and validates active signals based on specific mid-range threshold crossovers.

RSIFilter_v1_v1
Indicator

RSIFilter_v1_v1

iRSI

This indicator identifies trend persistence by filtering Relative Strength Index values against extreme overbought and oversold boundaries to highlight active momentum zones.

RSIFilter_v1_v2
Indicator

RSIFilter_v1_v2

iRSI

This indicator identifies directional bias by capturing extreme overbought and oversold excursions and filtering for sustained momentum within specific intermediate zones.

RSIFilter_v1_v3
Indicator

RSIFilter_v1_v3

iRSI

This indicator identifies directional bias by capturing RSI extremes and validating trend persistence through specific overbought/oversold corridor thresholds.

RSIOMA Bollinger Bands
Indicator

RSIOMA Bollinger Bands

iMA

This indicator calculates a smoothed Relative Strength Index and overlays Bollinger Bands to identify trend exhaustion and momentum shifts via overbought/oversold signal triggers.

RSIOMA
Indicator

RSIOMA

iMA

This indicator calculates the Relative Strength Index by applying Exponential Moving Averages to price changes and identifies overbought/oversold reversals through specific trend-crossing signals.

RSIOMA_v2
Indicator

RSIOMA_v2

iMAiMAOnArray

This indicator identifies momentum shifts by applying a dual-layer smoothed moving average to the Relative Strength Index while simultaneously highlighting trend violations and overextended price reversals through dynamic histogram triggers.

RSIOMA_v2HHLS
Indicator

RSIOMA_v2HHLS

iMAiMAOnArrayiRSIOnArray

This indicator synthesizes a dual-layered moving average on the Relative Strength Index to identify momentum shifts and visualize directional bias through multi-zone histogram signaling.

RSIOMA_v2HHLS22
Indicator

RSIOMA_v2HHLS22

iMAiMAOnArrayiRSIOnArray

This indicator synthesizes smoothed Relative Strength Index data with dual-layer moving averages to identify trend exhaustion, momentum shifts, and dynamic support/resistance transitions.

RSIOMA_v2HHLSX
Indicator

RSIOMA_v2HHLSX

iMAiMAOnArrayiRSIOnArray

This indicator identifies momentum shifts by calculating a Moving Average on an RSI-derived array to generate crossover signals and multi-level trend exhaustion zones.

RSIOMA_v2HHLSX_001
Indicator

RSIOMA_v2HHLSX_001

iMAiMAOnArrayiRSIOnArray

This indicator synthesizes a dual-layered Moving Average of the Relative Strength Index to identify momentum crossovers and dynamic trend exhaustion zones.

RSIOMA_v2HHLSX_v1
Indicator

RSIOMA_v2HHLSX_v1

iMAiMAOnArrayiRSIOnArray

This indicator synthesizes a smoothed Relative Strength Index with moving average crossovers and multi-tier volatility thresholds to identify momentum shifts and trend exhaustion.

RSIOMA_v2HHLSX__rev
Indicator

RSIOMA_v2HHLSX__rev

iMAiMAOnArrayiRSIOnArray

This indicator utilizes a dual-layer smoothing technique by applying a Moving Average to price data before calculating the RSI, then layering a secondary MA over that result to generate trend crossovers and momentum exhaustion signals.

RSIOMA_v2HHLSX__rev_alert
Indicator

RSIOMA_v2HHLSX__rev_alert

iMAiMAOnArrayiRSIOnArray

This indicator identifies trend shifts by calculating a Moving Average of the RSI on a pre-smoothed price buffer, generating visual signals and alerts upon momentum crossovers.

RSIOMA_v2HLS
Indicator

RSIOMA_v2HLS

iMAiMAOnArray

This indicator synthesizes a smoothed RSI with integrated moving averages and dynamic histogram overlays to identify momentum shifts and extreme price exhaustion levels.

RSIOMA_v2HLS22
Indicator

RSIOMA_v2HLS22

iMAiMAOnArray

This indicator combines a smoothed Relative Strength Index with a secondary moving average and dynamic histogram signals to identify trend shifts, momentum reversals, and extreme overbought or oversold conditions.

RSIOMA_v2MA
Indicator

RSIOMA_v2MA

iMAiMAOnArrayiRSIOnArray

This indicator calculates a Relative Strength Index based on smoothed moving average data, then applies a secondary moving average overlay to filter noise and identify trend momentum.

RSIOMA_v2MaMa
Indicator

RSIOMA_v2MaMa

iMAiMAOnArrayiRSIOnArray

This indicator calculates a nested momentum overlay by applying Smoothed Moving Averages (SMMA) over an RSI derived from an initial Moving Average sequence.

RSIOMA_v2MA_001
Indicator

RSIOMA_v2MA_001

iMAiMAOnArrayiRSIOnArray

This indicator computes a Relative Strength Index based on smoothed price data, then applies a secondary moving average to the resulting momentum for refined signal filtering.

RSIOMA_v2Only
Indicator

RSIOMA_v2Only

iMAiRSIOnArray

This indicator calculates a nested momentum metric by applying a Relative Strength Index calculation over a pre-smoothed Exponential Moving Average buffer.

RSIOMA_v2_001
Indicator

RSIOMA_v2_001

iMAiMAOnArray

This indicator calculates a smoothed Relative Strength Index combined with a moving average to identify momentum shifts and potential reversal zones through histogram signals.

RSIOMA_v2_006
Indicator

RSIOMA_v2_006

iMAiMAOnArrayiRSIOnArray

This indicator calculates a Relative Strength Index based on an Exponential Moving Average to identify trend shifts and detect extreme price exhaustion via multi-layered signal triggers.

RSIOMA_v2_v1
Indicator

RSIOMA_v2_v1

iMAiMAOnArray

This indicator identifies trend extremes and potential reversals by combining a smoothed Relative Strength Index with a secondary Moving Average overlay to highlight momentum shifts.

RSIOMA_v3
Indicator

RSIOMA_v3

iMAiMAOnArrayiRSIOnArray

This indicator employs a nested calculation of RSI on an Moving Average array to identify trend shifts and momentum extremes through multi-level signal crossovers.

RSIOMA_v3CDVar
Indicator

RSIOMA_v3CDVar

iMAiMAOnArrayiRSIOnArray

This indicator calculates a dynamic momentum spread by deriving a Moving Average, applying an RSI filter to that average, and then measuring the variance between that filtered value and its secondary moving average.

RSIOMA_v3L
Indicator

RSIOMA_v3L

iMAiRSIOnArray

This indicator calculates a Relative Strength Index based on a moving average of price data to provide a filtered momentum signal.

RSIOMA_v3LMA
Indicator

RSIOMA_v3LMA

iMAiMAOnArrayiRSIOnArray

This indicator calculates a Relative Strength Index based on an underlying Moving Average array, then applies a secondary smoothing moving average to the resulting RSI values to identify momentum trends.

RSIOMA_v3LMA_custJMA_RSI_LSMA
Indicator

RSIOMA_v3LMA_custJMA_RSI_LSMA

iRSIOnArray

This indicator identifies price momentum by calculating a Relative Strength Index (RSI) based on a Jurik Moving Average (JMA) input, then smoothing the resulting signal with a Linear Weighted Moving Average (LSMA).

RSIOMA_v3LMA_LSMA_RSI_LSMA
Indicator

RSIOMA_v3LMA_LSMA_RSI_LSMA

iRSIOnArray

This indicator calculates a Relative Strength Index derived from a Linear Moving Average of price data, then overlays a secondary smoothed moving average to identify momentum shifts.

RSIOMA_v3Var
Indicator

RSIOMA_v3Var

iMAiMAOnArrayiRSIOnArray

This indicator calculates a nested moving average of Relative Strength Index values derived from a primary moving average to filter out market noise and identify structural trend shifts.

RSIOMA_v3_alerts
Indicator

RSIOMA_v3_alerts

iMAiMAOnArrayiRSIOnArray

This indicator utilizes a nested RSI calculation on moving average arrays to identify trend reversals and momentum shifts through moving average crossovers and dynamic threshold breaches.

RSIOMA_v3_alertsD
Indicator

RSIOMA_v3_alertsD

iMAiMAOnArrayiRSIOnArray

This indicator identifies momentum shifts by calculating an RSI on a smoothed Moving Average array and detects trend reversals through multi-level threshold breaches and moving average crossovers.

RSIOMA_v3_alertsD_002
Indicator

RSIOMA_v3_alertsD_002

iMAiMAOnArrayiRSIOnArray

This indicator identifies trend shifts and exhaustion points by calculating a smoothed RSI on a Moving Average array and monitoring its crossovers against dynamic trend, trigger, and signal thresholds.

RSIOMA_v3_alerts_002
Indicator

RSIOMA_v3_alerts_002

iMAiMAOnArrayiRSIOnArray

This indicator identifies trend reversals and momentum shifts by analyzing the intersection of an RSI-based moving average with dynamic overbought, oversold, and midline threshold levels.

RSIOMA_v3_LSMA_RSI_LSMA
Indicator

RSIOMA_v3_LSMA_RSI_LSMA

iCCIOnArrayiRSIOnArray

This indicator identifies trend reversals and momentum shifts by applying a Linear Weighted Moving Average to an RSI calculation derived from a primary price moving average.

RSIOMA_v4 Arrows
Indicator

RSIOMA_v4 Arrows

This indicator identifies directional reversals by cross-referencing multi-timeframe RSI Oscillator Moving Average deviations against specific bullish and bearish momentum thresholds.

Indicator

RSIOMA_v4-Lines

iMAiMAOnArrayiRSIOnArray
Indicator

RSIOMA_v4

iMAiMAOnArrayiRSIOnArray
Indicator

RSIOMA_v4_v1

iMAiMAOnArrayiRSIOnArray
RSIonMA
Indicator

RSIonMA

iMAiRSIOnArray

This indicator computes Relative Strength Index values derived from two distinct Moving Average layers to filter noise and identify momentum trends.