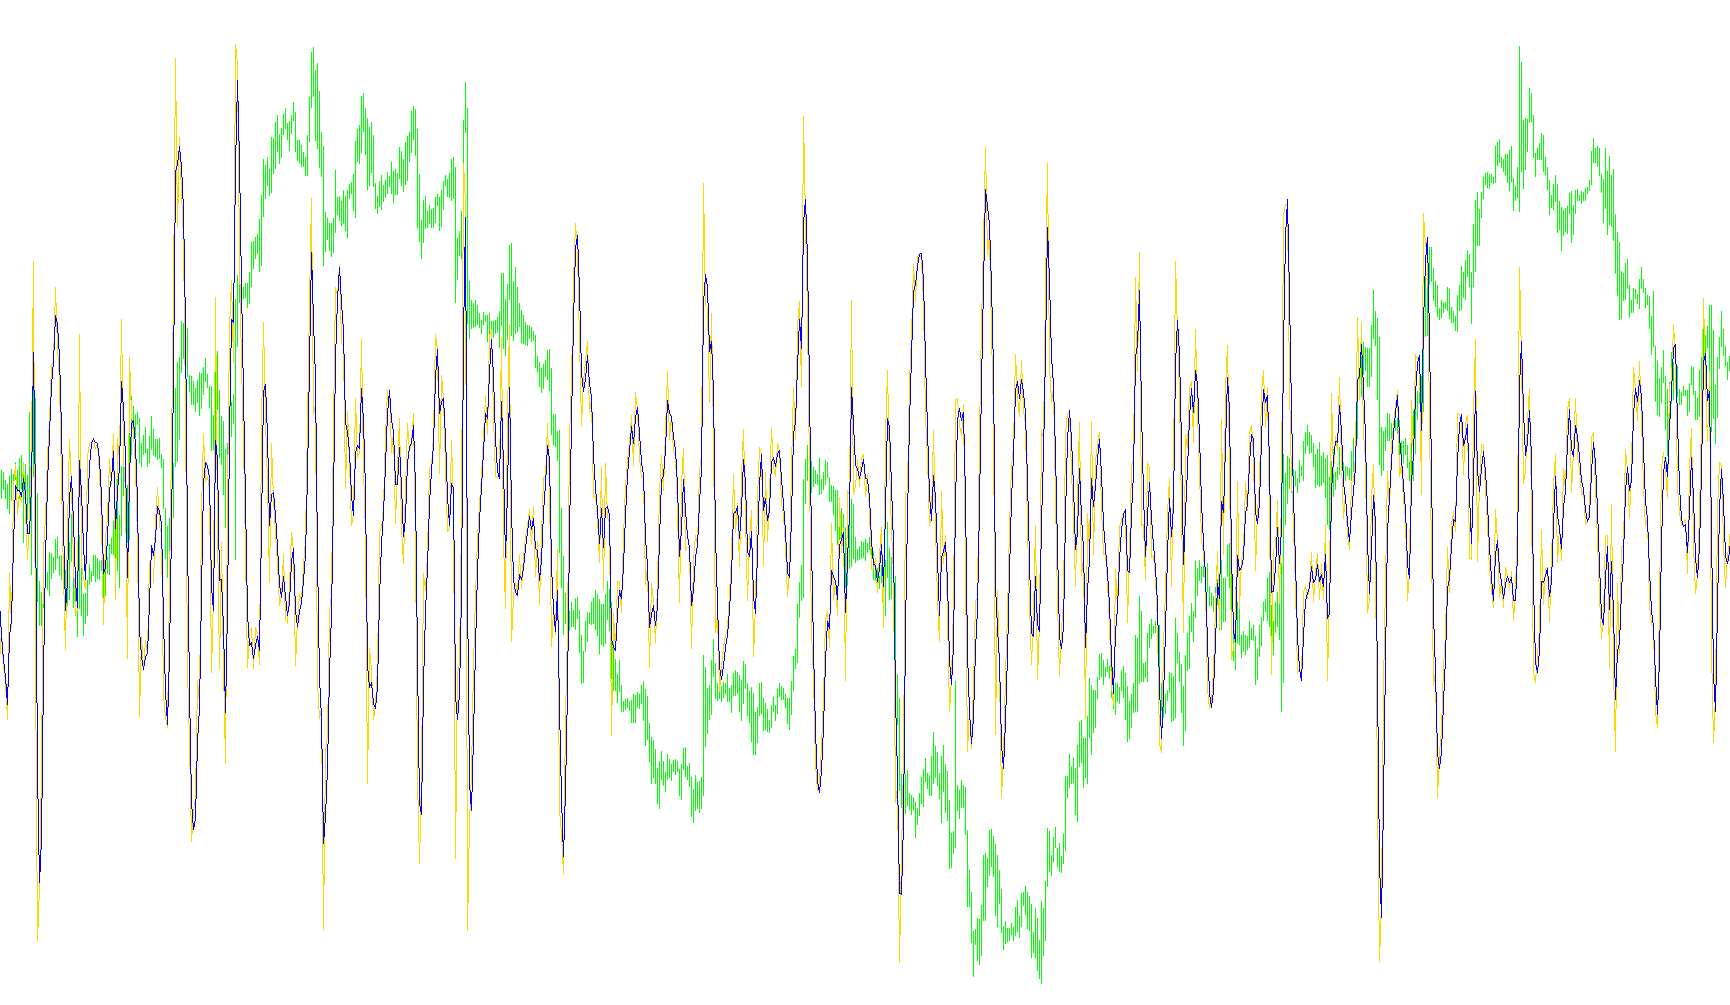
The Forecast Osc is a specialized technical analysis tool designed to help traders visualize price momentum and potential future trends by analyzing historical price behavior. Instead of simply showing where the price has been, this script attempts to smooth out market "noise" to reveal underlying cycles and directional shifts.
How the Logic Works
The tool operates through a multi-layered mathematical process to generate two distinct visual lines on your chart:
1. Data Smoothing and Weighting The script begins by looking at a specific window of historical closing prices (defined by the "Regress" setting). It applies a weighting system that gives more importance to recent price actions while still considering the broader context of the preceding bars. This prevents the indicator from reacting too violently to minor, insignificant price flickers.
2. The Weighted Average Calculation The core of the logic involves calculating a weighted average of the price data. By comparing the current price against this weighted average, the script determines the "oscillation" or the degree to which the price is deviating from its mean path. This result is expressed as a percentage, providing a normalized view of market strength.
3. The Forecasting Mechanism (Triple Smoothing) To make the data actionable for a trader, the script doesn't stop at the raw oscillation. It applies a sophisticated smoothing technique known as a "T3" filter. This involves:
- Taking the calculated oscillation and passing it through multiple layers of recursive calculations.
- Using specific coefficients to balance responsiveness with smoothness.
- Generating a "forecast" line that attempts to project the direction of the momentum more clearly than a standard moving average could.
What the Results Mean for You
The indicator provides two primary visual outputs:
- The Primary Oscillation: This represents the smoothed momentum of the price. It helps you see if the market is currently overextended or moving with consistent strength.
- The Forecast Line: This is the "refined" version of the oscillation. Because it has been smoothed through several layers of calculation, it is designed to filter out temporary spikes, helping you identify the broader trend and potential turning points more effectively.
In summary, this script transforms raw price data into a refined momentum map, allowing you to see the "rhythm" of the market more clearly by calculating how far the current price has strayed from its average and where that momentum is likely heading next.
//+------------------------------------------------------------------+
//|                                                 forecast osc.mq4 |
//|                Copyright © 2005, Nick Bilak, beluck[AT]gmail.com |
//|                                    http://metatrader.50webs.com/ |
//+------------------------------------------------------------------+
#property copyright "Copyright © 2005, Nick Bilak"
#property link      "http://metatrader.50webs.com/"

#property indicator_separate_window

#property indicator_buffers 2
#property indicator_level1 0

#property indicator_color1 SteelBlue
#property indicator_color2 Red


//---- input parameters
       int       Regress= 15;
       int       T3= 3;
       double    B= 0.7;

//---- buffers
double Osc[];
double Osct3[];

double HiSig[];
double LoSig[];


//+------------------------------------------------------------------+
//| Custom indicator initialization function                         |
//+------------------------------------------------------------------+
int init()
{
   SetIndexStyle(0,DRAW_LINE);
   SetIndexBuffer(0,Osc);

   SetIndexEmptyValue(0,0);
   SetIndexStyle(1,DRAW_LINE);
   SetIndexBuffer(1,Osct3);

   return(0);
}

//+------------------------------------------------------------------+
//| Custor indicator deinitialization function                       |
//+------------------------------------------------------------------+
int deinit()
{
   return(0);
}

//+------------------------------------------------------------------+
//| Custom indicator iteration function                              |
//+------------------------------------------------------------------+
int start()
{
   int counted_bars= IndicatorCounted(),
       limit;

   if (counted_bars<0) return(-1);
   if (counted_bars>0) counted_bars--;

   limit= Bars - counted_bars;

   ForecastOsc(0, limit, Osc, Osct3, Regress, T3, B);

   return (0);
}


//+------------------------------------------------------------------+
//| Calc forecast buffers  from lastbar down to offset               |
//+------------------------------------------------------------------+
void ForecastOsc(int offset, int lastbar, double &osc[], double &osct3[], int regress, int t3, double b)
{

   int shift, length;
   double b2,b3,c1,c2,c3,c4,w1,w2,n,WT,
          forecastosc,t3_fosc,sum,
          e1,e2,e3,e4,e5,e6,tmp,tmp2;

   lastbar= MathMin(Bars-31-regress, lastbar);

   for (shift= lastbar+30; shift>=offset; shift--)   {

      b2=b*b;
      b3=b2*b;
      c1=-b3;
      c2=(3*(b2+b3));
      c3=-3*(2*b2+b+b3);
      c4=(1+3*b+b3+3*b2);
      n=t3;

      if (n<1) n=1;
      n = 1 + 0.5*(n-1);
      w1 = 2 / (n + 1);
      w2 = 1 - w1;

      length= regress;
      sum = 0;
      for (int i = length; i>0; i--) {
         tmp = length+1;
         tmp = tmp/3;
         tmp2 = i;
         tmp = tmp2 - tmp;
         sum = sum + tmp*Close[shift+length-i];
      }
      tmp = length;

      WT = sum*6/(tmp*(tmp+1));

      forecastosc= (Close[shift]-WT)/WT*100;

      e1 = w1*forecastosc + w2*e1;
      e2 = w1*e1 + w2*e2;
      e3 = w1*e2 + w2*e3;
      e4 = w1*e3 + w2*e4;
      e5 = w1*e4 + w2*e5;
      e6 = w1*e5 + w2*e6;

      t3_fosc = c1*e6 + c2*e5 + c3*e4 + c4*e3;

      if (shift<=lastbar) {   // don't put swing in cycle into the signal buffers
         osc[shift] = forecastosc;
         osct3[shift] = t3_fosc;
      }

    }

   return(0);
}
Comments