RD-PivotLinesOld
Download script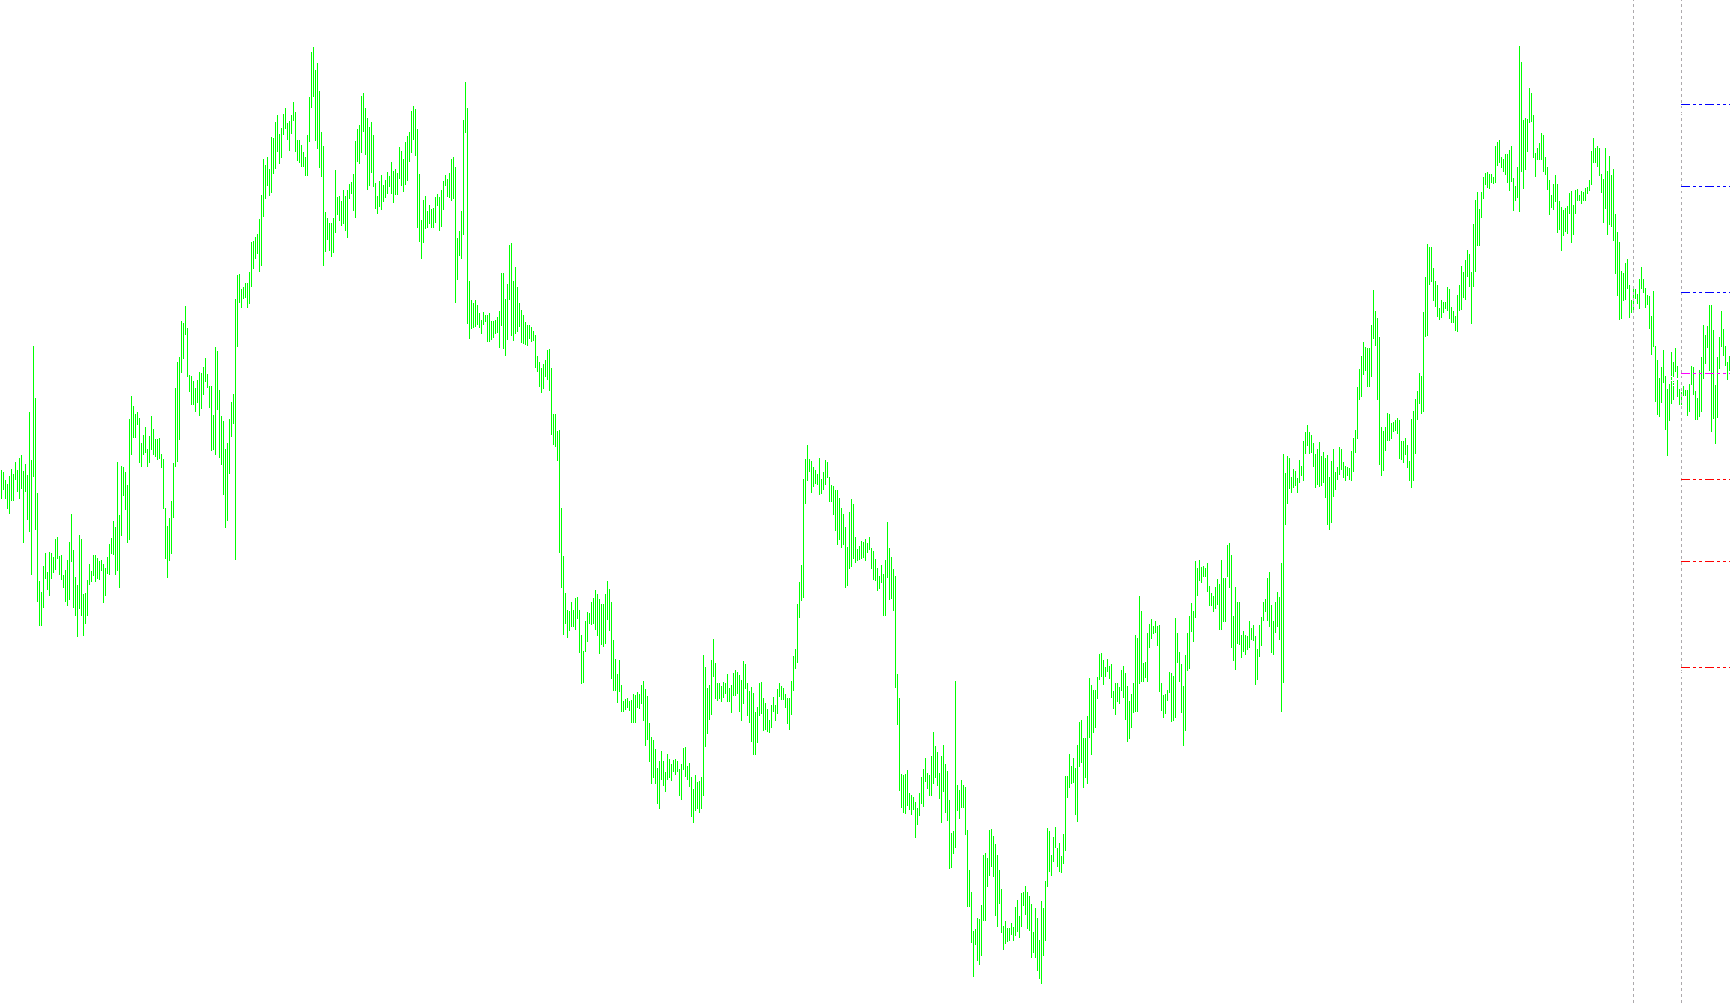
This script is designed to automatically calculate and display key price levels—known as Pivot Points—directly on a trading chart. These levels act as horizontal guides that help traders identify potential areas of support (where prices might stop falling) and resistance (where prices might struggle to rise further).
Core Logic & Functionality
Time Zone Intelligence The script is designed to be versatile regarding different global markets. It allows users to define their local time zone and a "destination" time zone. This ensures that the script calculates price levels based on specific trading sessions (like the London or New York sessions) regardless of where the trader is physically located. It specifically looks for the start of a new day in the chosen session to begin its calculations.
Data Collection To determine tomorrow's levels, the script "looks back" at historical price data from the previous trading day. It automatically scans the hourly bars to identify four critical pieces of information:
- The highest price reached (High)
- The lowest price reached (Low)
- The price at which the market opened
- The price at which the market closed
Calculation Methods The script performs several different mathematical models to draw various types of lines on your chart:
- Standard Pivot Points: It calculates a central "Pivot" level based on the previous day's average, then branches out to provide three Resistance levels (R1, R2, R3) and three Support levels (S1, S2, S3).
- Camarilla Levels: This is a specific trading model that focuses on identifying "breakout" points. It provides four high and four low levels (H3, H4, L3, L4) based on the previous day's range and closing price.
- Midpoint Pivots: For more granular analysis, the script can draw "M" levels (M0 through M5). These represent the halfway points between the standard Resistance and Support lines, helping traders identify smaller fluctuations within larger trends.
Visual Output Once the calculations are complete, the script draws these levels as horizontal dashed lines on the chart. Each line is accompanied by a text label (e.g., "R1" or "S2") so the user can easily identify them. Additionally, the script displays a summary at the top of the screen showing the price range of both yesterday and today in pips, providing an immediate snapshot of market volatility.
Automation & Maintenance The script is programmed to refresh its data automatically every 10 minutes to ensure the lines stay current. It also includes a "cleanup" routine that removes old objects from the chart when it initializes or closes, ensuring the trading workspace remains clean and uncluttered.
//+------------------------------------------------------------------+
//|                                                        Pivot.mq4 |
//|                      Copyright © 2004, MetaQuotes Software Corp. |
//|                                        http://www.metaquotes.net |
//+------------------------------------------------------------------+
#property copyright "Copyright © 2004, MetaQuotes Software Corp."
#property link      "http://www.metaquotes.net"

#property indicator_chart_window

// ---- user input ---------------
/*
   LocalTimeZone: TimeZone for which MT4 shows your local time,
                  e.g. 1 or 2 for Europe (GMT+1 or GMT+2 (daylight
                  savings time).  Use zero for no adjustment.

   DestTimeZone:  TimeZone for the session from which to calculate
                  the levels (e.g. 1 or 2 for the European session
                  (without or with daylight savings time).
                  Use zero for GMT

   The following doesn't work yet, please leave it to 0/24:

   TradingHoursFrom: First hour of the trading session in the destination
                     time zone.

   TradingHoursTo: Last hour of the trading session in the destination
                   time zone (the hour starting with this value is excluded,
                   i.e. 18 means up to 17:59 o'clock)

   Example: If you are lving in the EST (Eastern Standard Time, GMT-5)
            zone and want to calculate the levels for the London trading
            session (European time GMT+1, 08:00 - 17:00), then enter
            -5 for LocalTimeZone, 1 for Dest TimeZone, 8 for HourFrom
            and 17 for hour to.
*/

extern int LocalTimeZone= 0;
extern int DestTimeZone= 0;
       int TradingHoursFrom= 0;
       int TradingHoursTo= 24;
extern bool ShowPivots = true;
extern bool ShowCamarilla = false;
extern bool ShowMidPitvot = false;


//+------------------------------------------------------------------+
//| Custom indicator initialization function                         |
//+------------------------------------------------------------------+
int init()
{
   return(0);
}

int deinit()
{
   ObjectDelete("YesterdayStart");
   ObjectDelete("YesterdayEnd");

   ObjectDelete("YesterdayStart Label");
   ObjectDelete("YesterdayEnd Label");

   ObjectDelete("Pivot Label");
   ObjectDelete("Pivot Line");

   string types= "RSHLM"; // beginning letters of objects

   for (int i= 0; i<StringLen(types); i++) {
      for (int j= 0; j<6; j++) {
         ObjectDelete(StringSubstr(types, i, 1) + j +" Line");
         ObjectDelete(StringSubstr(types, i, 1) + j +" Label");
      }
   }


   return(0);
}

//+------------------------------------------------------------------+
//| Custom indicator iteration function                              |
//+------------------------------------------------------------------+
int start()
{
   static datetime timelastupdate= 0;

   if (CurTime()-timelastupdate < 600)
      return (0);

   timelastupdate= CurTime();

   //---- exit if period is greater than daily charts
   if(Period() > 1440)
   {
      Print("Error - Chart period is greater than 1 day.");
      return(-1); // then exit
   }

   datetime startofday= 0;

   double day_high= 0;
   double day_low= 0;
   double yesterday_high= 0;
   double yesterday_open= 0;
   double yesterday_low= 0;
   double yesterday_close= 0;
   double today_open= 0;
   double today_high= 0;
   double today_low= 0;

   double P= 0;
   double Q= 0;
   double R1,R2,R3;
   double M0,M1,M2,M3,M4,M5;
   double S1,S2,S3;
   double H4,H3,L4,L3;
   double nQ= 0;
   double nD= 0;
   double D= 0;
   double rates_d1[2][6];
   double rates_h1[2][6];


   //---- Get new daily prices
   /* flat time
   ArrayCopyRates(rates_d1, Symbol(), PERIOD_D1);
   yesterday_close= rates_d1[1][4];
   yesterday_open= rates_d1[1][1];
   today_open= rates_d1[0][1];
   yesterday_high= rates_d1[1][3];
   yesterday_low= rates_d1[1][2];
   day_high= rates_d1[0][3];
   day_low= rates_d1[0][2];

   Print("unzoned1: yc =", yesterday_close, ", yo= ", yesterday_open, ", to= ", today_open, ", yhigh= ", yesterday_high, ", ylow= ", yesterday_low);
   */


   Print("Local time current bar:", TimeToStr(iTime(NULL, PERIOD_H1, 0)));
   Print("Dest  time current bar: ", TimeToStr(iTime(NULL, PERIOD_H1, 0)- (LocalTimeZone - DestTimeZone)*3600), ", tzdiff= ", LocalTimeZone - DestTimeZone);

   for (int i=0; i<=25; i++) {

      datetime time= iTime(NULL, PERIOD_H1, i);
      int tzdiff= LocalTimeZone - DestTimeZone,
          tzdiffsec= tzdiff*3600;

      Print("Looking at H1 bar ", i, " time on bar local= ", TimeToStr(time), ", bar time dest= ", TimeToStr(time-tzdiffsec));

      if (TimeHour(time - tzdiffsec)==0) {
         int idxfirstbaroftoday= i,
             idxfirstbarofyesterday= 0,
             idxlastbarofyesterday= 0;

         Print("Dest time zone\'s current day starts:", TimeToStr(iTime(NULL, PERIOD_H1, idxfirstbaroftoday)), " (local time), idxbar= ", idxfirstbaroftoday);


         // search  backwards for a 00:00 o'clock bar in the destination time zone
         for (int j= 1; j<=48; j++) {
            datetime timey= iTime(NULL, PERIOD_H1, i+j) - tzdiffsec;

            if (TimeHour(timey)==0 && TimeDayOfWeek(timey)!=6) {  // ignore saturdays (a Sa may happen due to TZ conversion)
               idxfirstbarofyesterday= i+j;
               break;
            }
         }


         datetime timeyesterdayopen= iTime(NULL, PERIOD_H1, idxfirstbarofyesterday);

         Print("Dest time zone\'s previous day starts:", TimeToStr(timeyesterdayopen), " (local time), idxbar= ", idxfirstbarofyesterday);


         //
         // walk forward from yestday's start and collect hours within the same day and within trading hours
         //
         yesterday_high= -99999;  // not high enough to remain alltime high
         yesterday_low=  +99999;  // not low enough to remain alltime low

         for (j= 0; j<24; j++) {
            int idxbar= idxfirstbarofyesterday-j;
            datetime bartime= iTime(NULL, PERIOD_H1, idxbar) - tzdiffsec;

            if (TimeDayOfWeek(bartime)==TimeDayOfWeek(iTime(NULL, PERIOD_H1, idxfirstbarofyesterday)-tzdiffsec) &&
                  TimeHour(bartime) >= TradingHoursFrom && TimeHour(bartime) < TradingHoursTo) {

               if (yesterday_open==0)  // grab first value for open
                  yesterday_open= iOpen(NULL, PERIOD_H1, idxbar);

               yesterday_high= MathMax(iHigh(NULL, PERIOD_H1, idxbar), yesterday_high);
               yesterday_low= MathMin(iLow(NULL, PERIOD_H1, idxbar), yesterday_low);

               // overwrite close in loop until we leave with the last bar's value
               yesterday_close= iClose(NULL, PERIOD_H1, idxbar);
               idxlastbarofyesterday= idxbar;
            }
         }

         Print("Dest time zone\'s previous day ends:", TimeToStr(iTime(NULL, PERIOD_H1, idxlastbarofyesterday)), " (local time), idxbar= ", idxlastbarofyesterday);


         if (tzdiff!=0 || TradingHoursFrom!=0 || TradingHoursTo!=24|| true) {
            double level= (yesterday_high + yesterday_low + yesterday_close) / 3;
            SetTimeLine("YesterdayStart", "start", idxfirstbarofyesterday, CadetBlue, level - 4*Point);
            SetTimeLine("YesterdayEnd", "end", idxlastbarofyesterday-1, CadetBlue, level - 4*Point);
         }

         today_open= iOpen(NULL, PERIOD_H1, idxfirstbaroftoday); // should be open of today start trading hour
         startofday= iTime(NULL, PERIOD_H1, idxfirstbaroftoday);

         // Print("Ybar= ", idxlastbarofyesterday, " tbar= ", idxfirstbaroftoday, "/", TimeToStr(startofday));

         day_high= -99999; // not high enough to remain alltime high
         day_low=  +99999; // not low enough to remain alltime low
         for (j= idxfirstbaroftoday; j>=0; j--) {
            day_high= MathMax(day_high, iHigh(NULL, PERIOD_H1, j));
            day_low= MathMin(day_low, iLow(NULL, PERIOD_H1, j));
         }

         break;
      }
   }

   Print("Timezoned values: yo= ", yesterday_open, ", yc =", yesterday_close, ", yhigh= ", yesterday_high, ", ylow= ", yesterday_low, ", to= ", today_open);


   //---- Calculate Pivots

   D = (day_high - day_low);
   Q = (yesterday_high - yesterday_low);
   P = (yesterday_high + yesterday_low + yesterday_close) / 3;

   R1 = (2*P)-yesterday_low;
   R2 = P+(yesterday_high - yesterday_low);
	R3 = (2*P)+(yesterday_high-(2*yesterday_low));
   S1 = (2*P)-yesterday_high;
   S2 = P-(yesterday_high - yesterday_low);
	S3 = (2*P)-((2* yesterday_high)-yesterday_low);

   //	R2 = P-S1+R1;
   //	R1 = (2*P)-yesterday_low;
   //	P = (yesterday_high + yesterday_low + yesterday_close)/3;
   //	S1 = (2*P)-yesterday_high;
   //	S2 = P-R1+S1;


   // Camarilla (http://www.moneytec.com/forums/showthread.php?t=14179&page=5)
   // H4= (high-low)*1.1/2+close;  H3= (high-low)*1.1/4+close;
   // H2= (high-low)*1.1/6+close;  H1= (high-low)*1.1/12+close
   // L1= close-(high-low)*1.1/12; L2= close-(high-low)*1.1/6;
   // L3= close-(high-low)*1.1/4;  L4= close-(high-low)*1.1/2;

	H4 = (Q*0.55)+yesterday_close;
	H3 = (Q*0.27)+yesterday_close;
	L3 = yesterday_close-(Q*0.27);
	L4 = yesterday_close-(Q*0.55);


   //
   // midpoints between pivots
   //
	M5 = (R2+R3)/2;
	M4 = (R1+R2)/2;
	M3 = (P+R1)/2;
	M2 = (P+S1)/2;
	M1 = (S1+S2)/2;
	M0 = (S2+S3)/2;


   if (Q > 5) { nQ = Q; }
   else { nQ = Q/Point; }

   if (D > 5) { nD = D; }
   else { nD = D/Point; }


   Comment("-- Good Morning, Good Luck Trading RICKY Ds System! ---\n",
           "Range: Yesterday ",nQ," pips",     ", Today ",nD," pips","\n",
           "Highs: Yesterday ",yesterday_high, ", Today ",day_high, "\n",
           "Lows:  Yesterday ",yesterday_low,  ", Today ",day_low,  "\n",
           "Close: Yesterday ",yesterday_close);

   //---- Set line labels on chart window

   //---- Pivot Lines
   if (ShowPivots==true) {
      SetLevel("R1", R1, Blue, startofday);
      SetLevel("R2", R2, Blue, startofday);
      SetLevel("R3", R3, Blue, startofday);

      SetLevel("Pivot", P, Magenta, startofday);

      SetLevel("S1", S1, Red, startofday);
      SetLevel("S2", S2, Red, startofday);
      SetLevel("S3", S3, Red, startofday);
   }


   //----- Camarilla Lines
   if (ShowCamarilla==true) {
      SetLevel("H3", H3, Yellow, startofday);
      SetLevel("H4", H4, Yellow, startofday);

      SetLevel("L3", L3, Yellow, startofday);
      SetLevel("L4", L4, Yellow, startofday);
   }


   //------ Midpoints Pivots
   if (ShowMidPitvot==true) {
      SetLevel("M5", M5, Green, startofday);
      SetLevel("M4", M4, Green, startofday);
      SetLevel("M3", M3, Green, startofday);
      SetLevel("M2", M2, Green, startofday);
      SetLevel("M1", M1, Green, startofday);
      SetLevel("M0", M0, Green, startofday);
   }


   return(0);
}


//+------------------------------------------------------------------+
//| Helper                                                           |
//+------------------------------------------------------------------+
void SetLevel(string text, double level, color col1, datetime startofday)
{
   string labelname= text + " Label";
   string linename= text + " Line";

   if (ObjectFind(labelname) != 0) {
      ObjectCreate(labelname, OBJ_TEXT, 0, Time[20], level);
      ObjectSetText(labelname, " " + text, 8, "Arial", White);
   }
   else {
      ObjectMove(labelname, 0, Time[20], level);
   }

   if (ObjectFind(linename) != 0) {
      ObjectCreate(linename, OBJ_TREND, 0, startofday, level, Time[0],level);
      ObjectSet(linename, OBJPROP_STYLE, STYLE_DASHDOTDOT);
      ObjectSet(linename, OBJPROP_COLOR, col1);
   }
   else {
      ObjectMove(linename, 1, Time[0],level);
      ObjectMove(linename, 0, startofday, level);
   }
}


//+------------------------------------------------------------------+
//| Helper                                                           |
//+------------------------------------------------------------------+
void SetTimeLine(string name, string text, int idx, color col1, double vleveltext)
{
   int x= iTime(NULL, PERIOD_H1, idx);

   if (ObjectFind(name) != 0)
      ObjectCreate(name, OBJ_TREND, 0, x, 0, x, 100);
   else {
      ObjectMove(name, 0, x, 0);
      ObjectMove(name, 1, x, 100);
   }

   ObjectSet(name, OBJPROP_STYLE, STYLE_DOT);
   ObjectSet(name, OBJPROP_COLOR, DarkGray);

   if (ObjectFind(name + " Label") != 0)
      ObjectCreate(name + " Label", OBJ_TEXT, 0, x, vleveltext);
   else
      ObjectMove(name + " Label", 0, x, vleveltext);

   ObjectSetText(name + " Label", text, 8, "Arial", col1);
}
Comments