ROC2
Indicator

ROC2

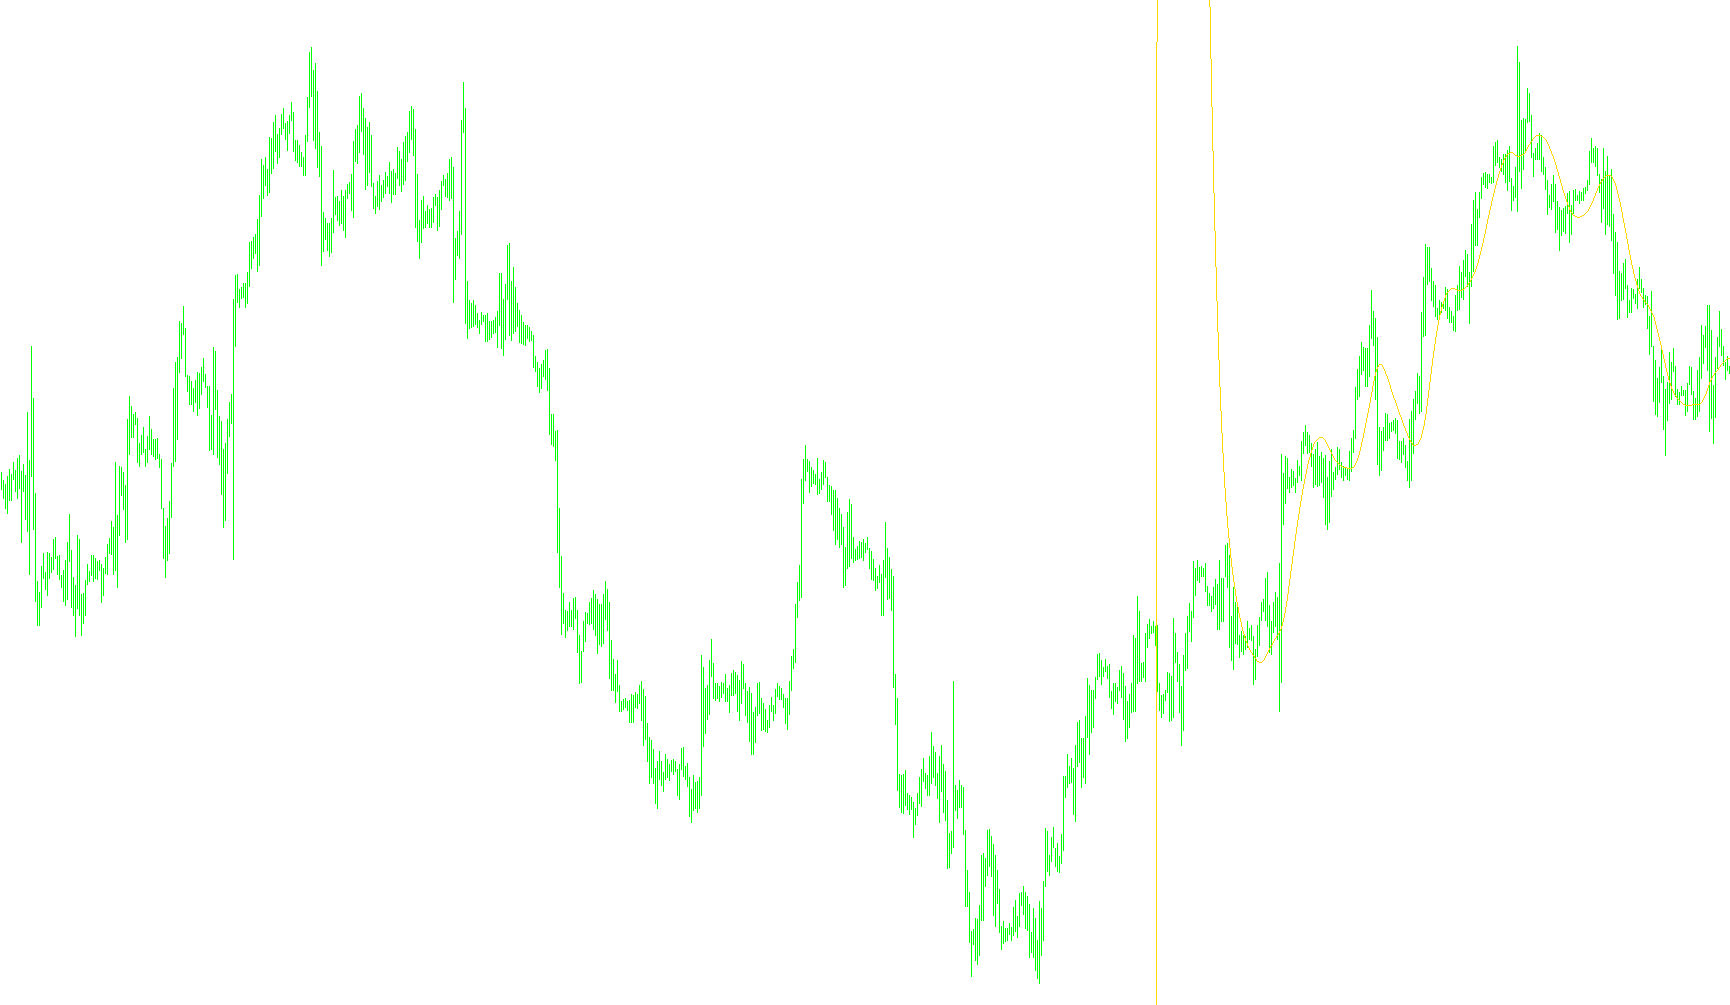
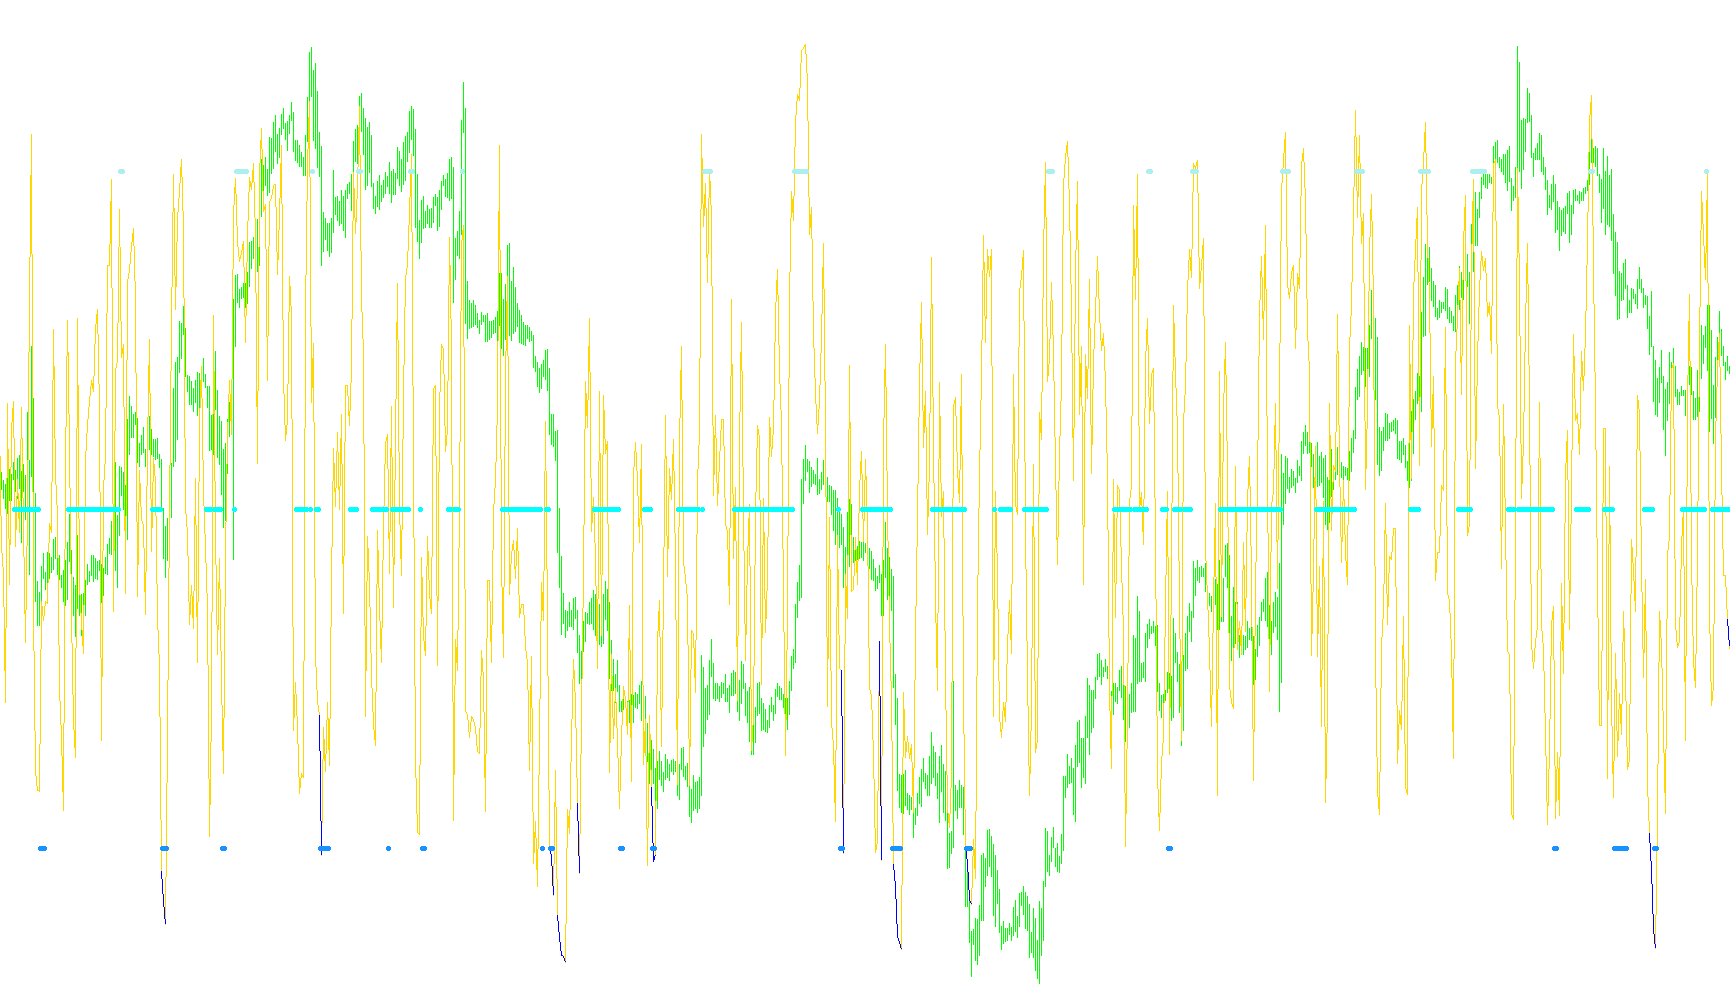
This indicator quantifies price momentum by calculating and plotting the absolute or percentage difference between current prices and multiple historical lookback periods simultaneously.

ROC2_VG
Indicator

ROC2_VG

This indicator calculates and overlays two distinct momentum variations—ranging from absolute price difference to percentage returns—to evaluate relative velocity across multiple time horizons.

ROC2_VG_v1
Indicator

ROC2_VG_v1

This indicator quantifies and visualizes price momentum by simultaneously calculating two distinct Rate-of-Change metrics across customizable periods to identify velocity shifts.

ROC_Indicator v02 e01
Indicator

ROC_Indicator v02 e01

This indicator calculates the aggregate Rate of Change by averaging the percentage price movements of the GBP, EUR, JPY, and CHF against the USD.

ROC_MA
Indicator

ROC_MA

iMAiMAOnArray

This indicator quantifies the point distance between current price and its moving average, then applies a secondary smoothing layer to visualize volatility trends.

ROC_Smoothed
Indicator

ROC_Smoothed

iMA

This indicator calculates the rate of change between current and historical price points by applying various moving average filters, including Linear Scrutiny, Non-Lag algorithms, and standard exponential smoothing.

ROC_v1
Indicator

ROC_v1

Quantifies the absolute or percentage price variance between the current candle and a fixed historical offset to reveal trend velocity.

RollerCoaster
Indicator

RollerCoaster

iMA

This indicator visualizes price momentum by tracking moving averages alongside historical high and low peaks identified over a rolling five-bar window.

Ron_Spread001
Indicator

Ron_Spread001

Calculates and visualizes the cumulative average of price discrepancies between bid and ask prices over a rolling session.

rotate_text
Indicator

rotate_text

This script orchestrates a synchronized animation of a text object and an angled trend line that dynamically shifts position, font scale, and orientation based on a continuous angular progression.

rotating_text
Indicator

rotating_text

This script dynamically animates a pivoting text label that traverses price coordinates while cyclically rotating its orientation and color to visually simulate trend shifts.

rotating_text_v1
Indicator

rotating_text_v1

This script dynamically animates a text object along a price trajectory while simultaneously cycling its rotation angle and toggling its visual state based on index progression.

Round Numbers
Indicator

Round Numbers

iMA

Dynamically projects horizontal zones based on the nearest whole-cent price points to highlight significant liquidity boundaries.

RoundLevels
Indicator

RoundLevels

Identifies and projects four proximal horizontal price levels ending in double zeros based on the current market quote.

RoundPrice-Ext
Indicator

RoundPrice-Ext

This indicator applies a recursive six-stage weighted moving average sequence to price data, calculating a final smoothed output via a specific polynomial coefficient expansion.

RoundPrice-Ext_v1
Indicator

RoundPrice-Ext_v1

The algorithm applies a recursive six-stage weighted moving average sequence to isolate price trends through progressively dampened volatility.

RoundPriceExp
Indicator

RoundPriceExp

This indicator calculates a multi-layered weighted moving average derivative by applying recursive smoothing coefficients to price action to isolate underlying trends.

RoundPriceExpCh
Indicator

RoundPriceExpCh

This indicator applies a triple-smoothed weighted moving average calculation to extract underlying price trends by minimizing market noise.

RoundPriceExp_v1
Indicator

RoundPriceExp_v1

This indicator calculates and displays a T3 moving average, a smoothed version of an exponential moving average, using a defined period and smoothing factor.

RoundPriceNE
Indicator

RoundPriceNE

This indicator calculates a multi-layered smoothed price movement by applying a Triple Exponential Moving Average logic over a recursive smoothing filter.

RoundPriceNE_big
Indicator

RoundPriceNE_big

The logic employs a triple-smoothed T3 moving average calculation based on weighted coefficients to filter market noise and identify underlying price trends.

RoundPriceNE_pips
Indicator

RoundPriceNE_pips

This indicator utilizes a triple-weighted smoothing algorithm to filter market noise and identify underlying price momentum through a multi-layered recursive calculation.

RPoint-m_v2
Indicator

RPoint-m_v2

This indicator identifies significant trend shifts by detecting price breaches of previous structural peaks and troughs based on a configurable reversal point threshold.

RPoint
Indicator

RPoint

Identifies structural trend shifts by tracking price exhaustion relative to a user-defined reversal threshold from established highs and lows.

RPoint_v1
Indicator

RPoint_v1

This indicator detects structural trend exhaustion by identifying local highs and lows that breach a predefined price retracement threshold to signal potential reversals.

RPoint_v2
Indicator

RPoint_v2

This indicator identifies trend exhaustion and structural shifts by detecting price breaches of recent extrema combined with a configurable reversal threshold.

RSI BAR CHARTv2
Indicator

RSI BAR CHARTv2

iRSI

This indicator visualizes Relative Strength Index dynamics by constructing candlestick-style bars that represent price action sentiment within a separate sub-window.

RSI Candles
Indicator

RSI Candles

iRSI

This indicator maps RSI extremes onto the price chart by dynamically color-coding candle wicks and bodies based on overbought and oversold thresholds.

Indicator

RSI CROSS

iRSI
Indicator

RSI CROSS1

iRSI
RSI HistoAlert v2
Indicator

RSI HistoAlert v2

iMAOnArrayiRSI

This indicator quantifies RSI price deviations into a zero-centered histogram to identify directional momentum shifts and extreme overbought/oversold thresholds.

Indicator

RSI THV

iRSI
RSI+MA+LABEL
Indicator

RSI+MA+LABEL

iMAOnArrayiRSI

This indicator overlays an Exponential Moving Average onto the Relative Strength Index to provide a visual confirmation of momentum shifts and trend velocity through dynamic color-coded labels.

RSI-2TF
Indicator

RSI-2TF

iRSI

This indicator overlays the current timeframe's Relative Strength Index with a higher timeframe RSI to identify multi-horizon price strength and potential divergence.

RSI-3TF
Indicator

RSI-3TF

iRSI

This indicator synchronizes Relative Strength Index values across multiple timeframes to identify overlapping momentum extremes and trend exhaustion.

RSI-3TF_ALERT_22
Indicator

RSI-3TF_ALERT_22

iRSI

This indicator identifies high-probability trend shifts by validating simultaneous Relative Strength Index (RSI) momentum alignment across three distinct multi-timeframe horizons.

RSI-3TF_v1
Indicator

RSI-3TF_v1

iRSI

This indicator synchronizes Relative Strength Index values across multiple timeframes to identify overlapping momentum trends and potential exhaustion zones.

Indicator

RSI-8_CROSS_Sound

iRSI
RSI-Alert
Indicator

RSI-Alert

iRSI

Monitors real-time Relative Strength Index fluctuations to trigger instantaneous notifications when price action breaches predefined overbought or oversold boundaries.

RSI-Alert_001
Indicator

RSI-Alert_001

iRSI

This script triggers real-time notifications when the Relative Strength Index crosses predefined high and low threshold boundaries to identify potential reversal points.

RSI-Alert_003
Indicator

RSI-Alert_003

iRSI

This indicator monitors the Relative Strength Index to trigger instantaneous notifications when momentum oscillates between predefined exhaustion boundaries.

RSI-Alert_004
Indicator

RSI-Alert_004

iRSI

This indicator identifies precise reversal points by monitoring when the Relative Strength Index crosses high-velocity overbought and oversold boundaries.

RSI-R2_voting_Ron3a
Indicator

RSI-R2_voting_Ron3a

iRSI

This indicator aggregates a plurality of relative strength index values across multiple timeframes to identify high-probability trend continuations based on sequential momentum shifts.

RSI-R2_voting_Ron4a
Indicator

RSI-R2_voting_Ron4a

iRSI

This indicator calculates a cumulative voting score by identifying sequential momentum shifts across multiple nested daily RSI periods to pinpoint high-probability trend reversals.

RSI-TC
Indicator

RSI-TC

iBandsiATRiMAiRSI

This indicator identifies high-probability trend reversals by detecting Bollinger Band contractions (squeezes) followed by price breakouts in alignment with multi-colored RSI momentum shifts.

RSI-TC_001
Indicator

RSI-TC_001

iBandsiATRiMAiRSI

This indicator identifies high-probability reversal points by combining a dual-tone RSI filter with Bollinger Band volatility squeezes and Keltner Channel expansion signals.

RSI-TC_NEW
Indicator

RSI-TC_NEW

iBandsiATRiMAiRSI

This indicator identifies explosive market entries by detecting volatility compression between Bollinger Bands and Keltner Channels, filtered by dual-tone RSI momentum and directional band breakouts.

RSI-TC_NEW1
Indicator

RSI-TC_NEW1

iBandsiATRiMAiRSI

This indicator identifies high-probability trend reversals by detecting volatility expansion from a 'squeeze' state combined with multi-layered RSI momentum filtering.

RSI-TC_NEWd
Indicator

RSI-TC_NEWd

iBandsiATRiMAiRSI

This indicator identifies high-probability trend reversals by detecting price volatility compression using a Bollinger Band and Keltner Channel squeeze, coupled with RSI momentum filtering to trigger directional signals.

RSI-TC_NEW[1]
Indicator

RSI-TC_NEW[1]

iBandsiATRiMAiRSI

This indicator identifies high-probability momentum shifts by detecting price breakouts from low-volatility Keltner Channel squeezes while filtering directionality through a dual-tone Relative Strength Index.