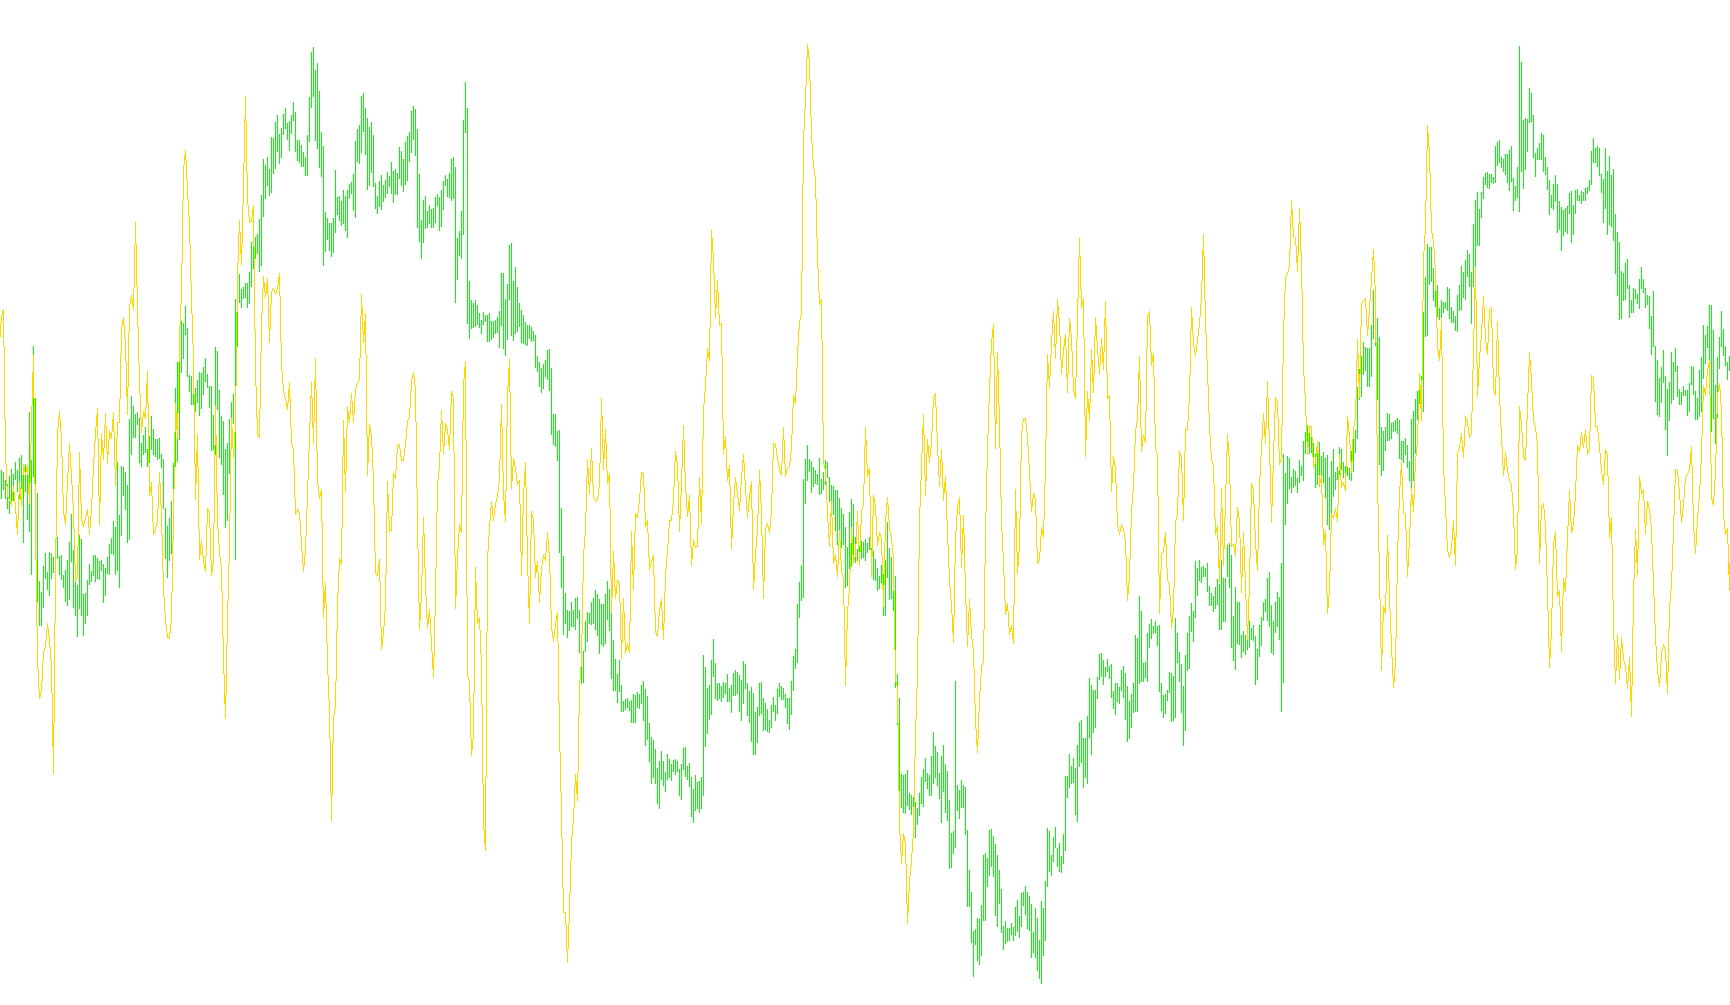
Regression_Channel_v1
Indicator

Regression_Channel_v1

iMA

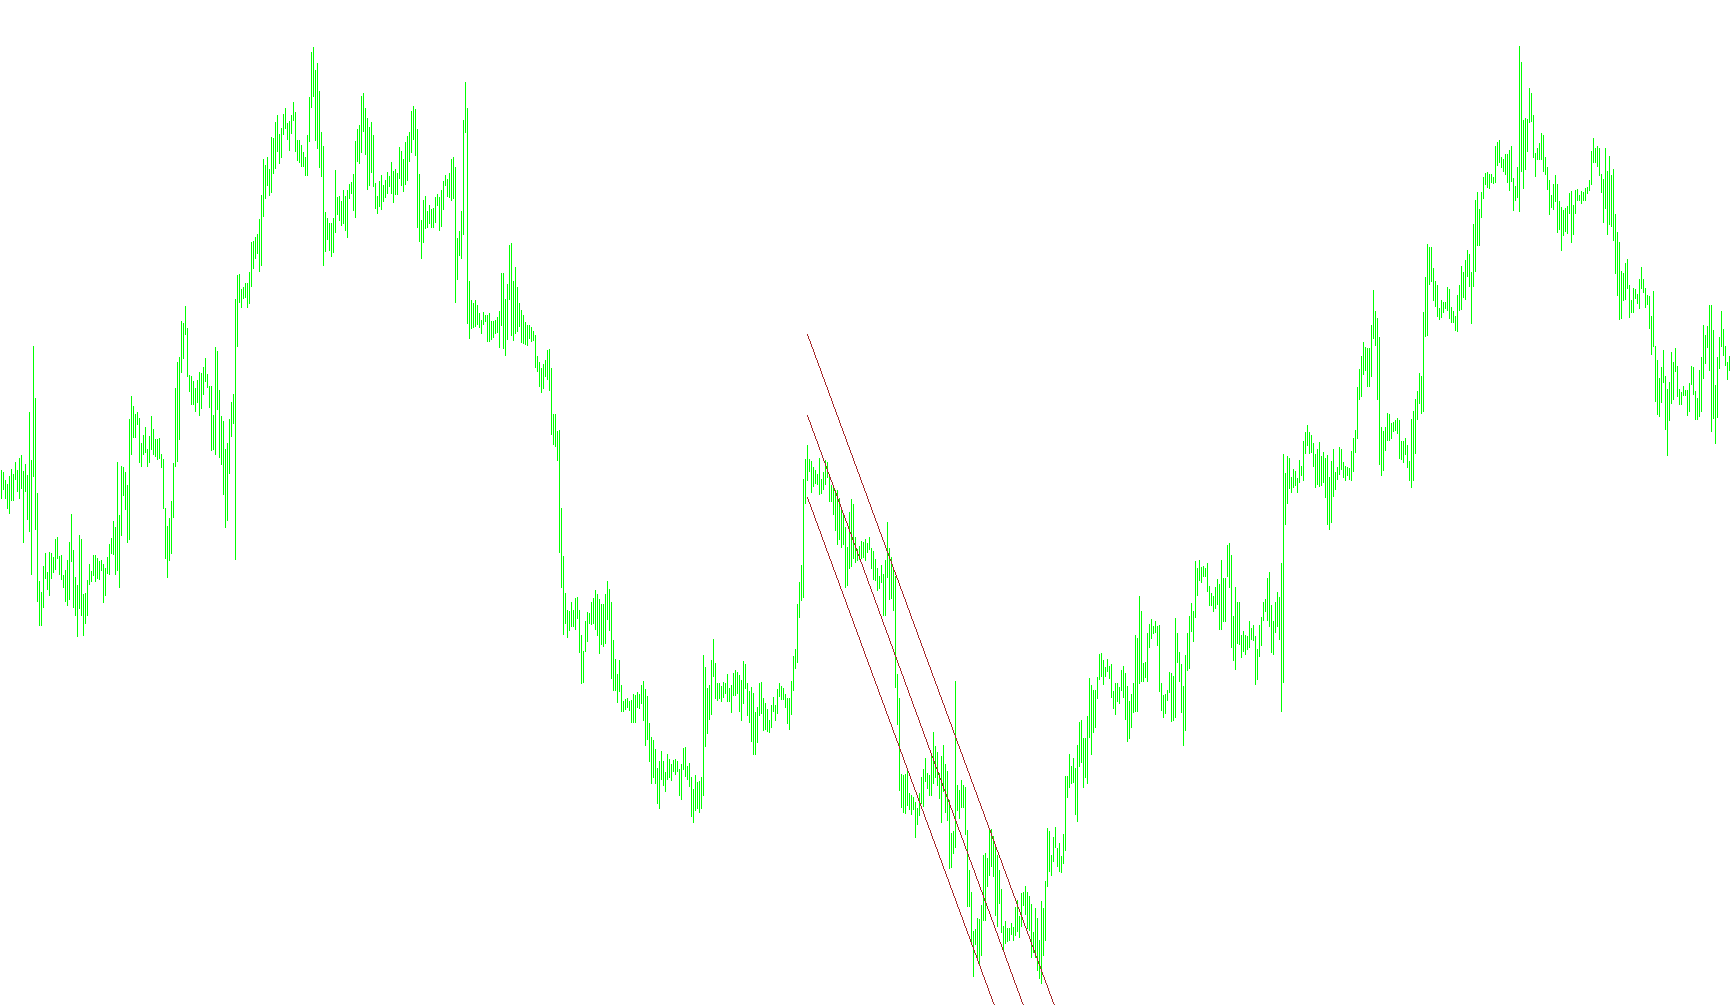
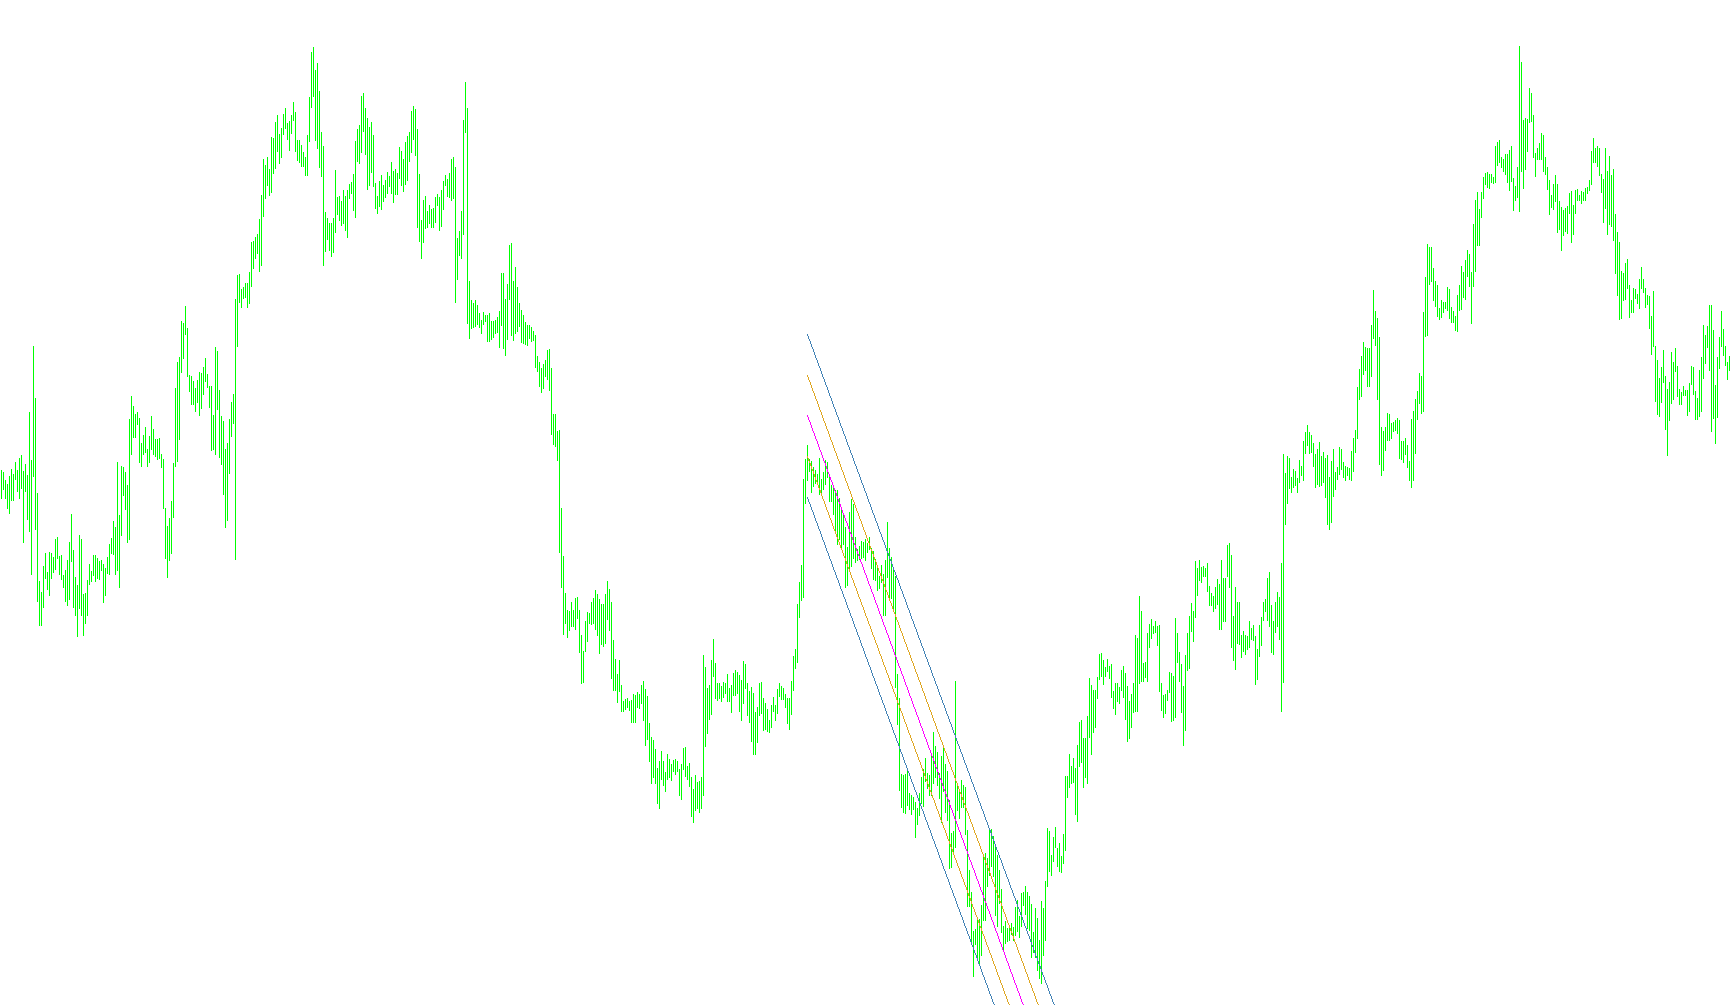
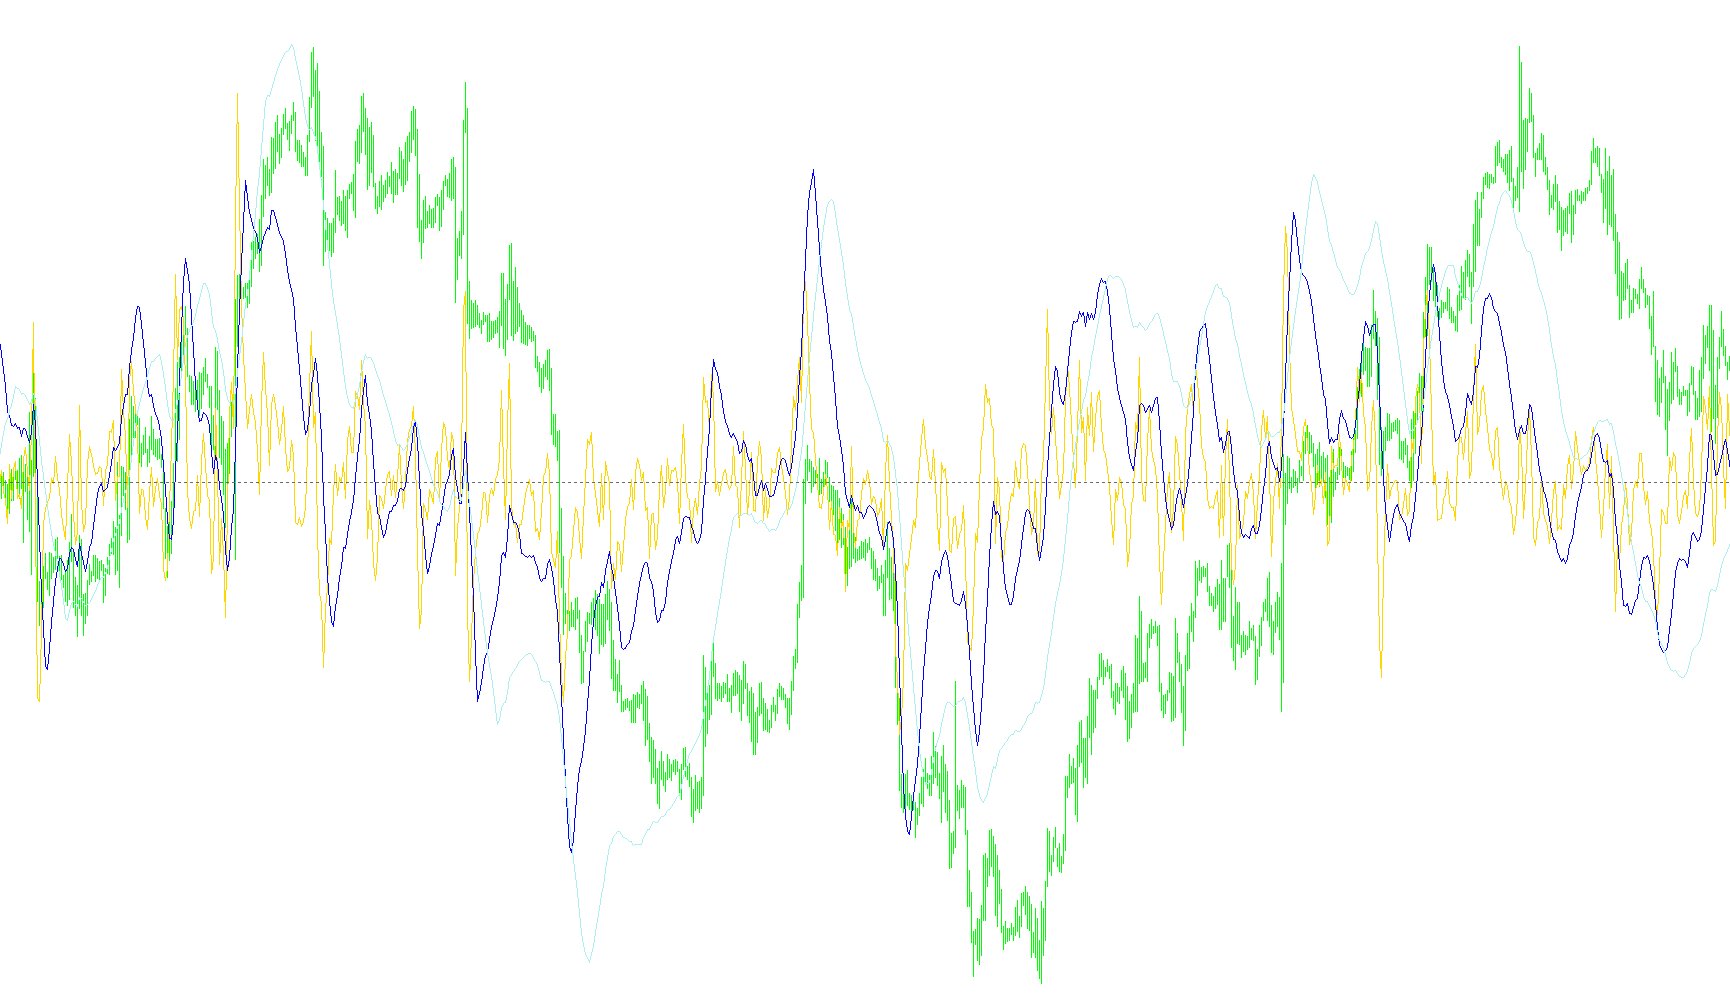
This indicator automatically identifies structural pivot points relative to a moving average to construct a linear regression channel bounded by standard deviation offsets.

Regression_Channel_V2
Indicator

Regression_Channel_V2

iMA

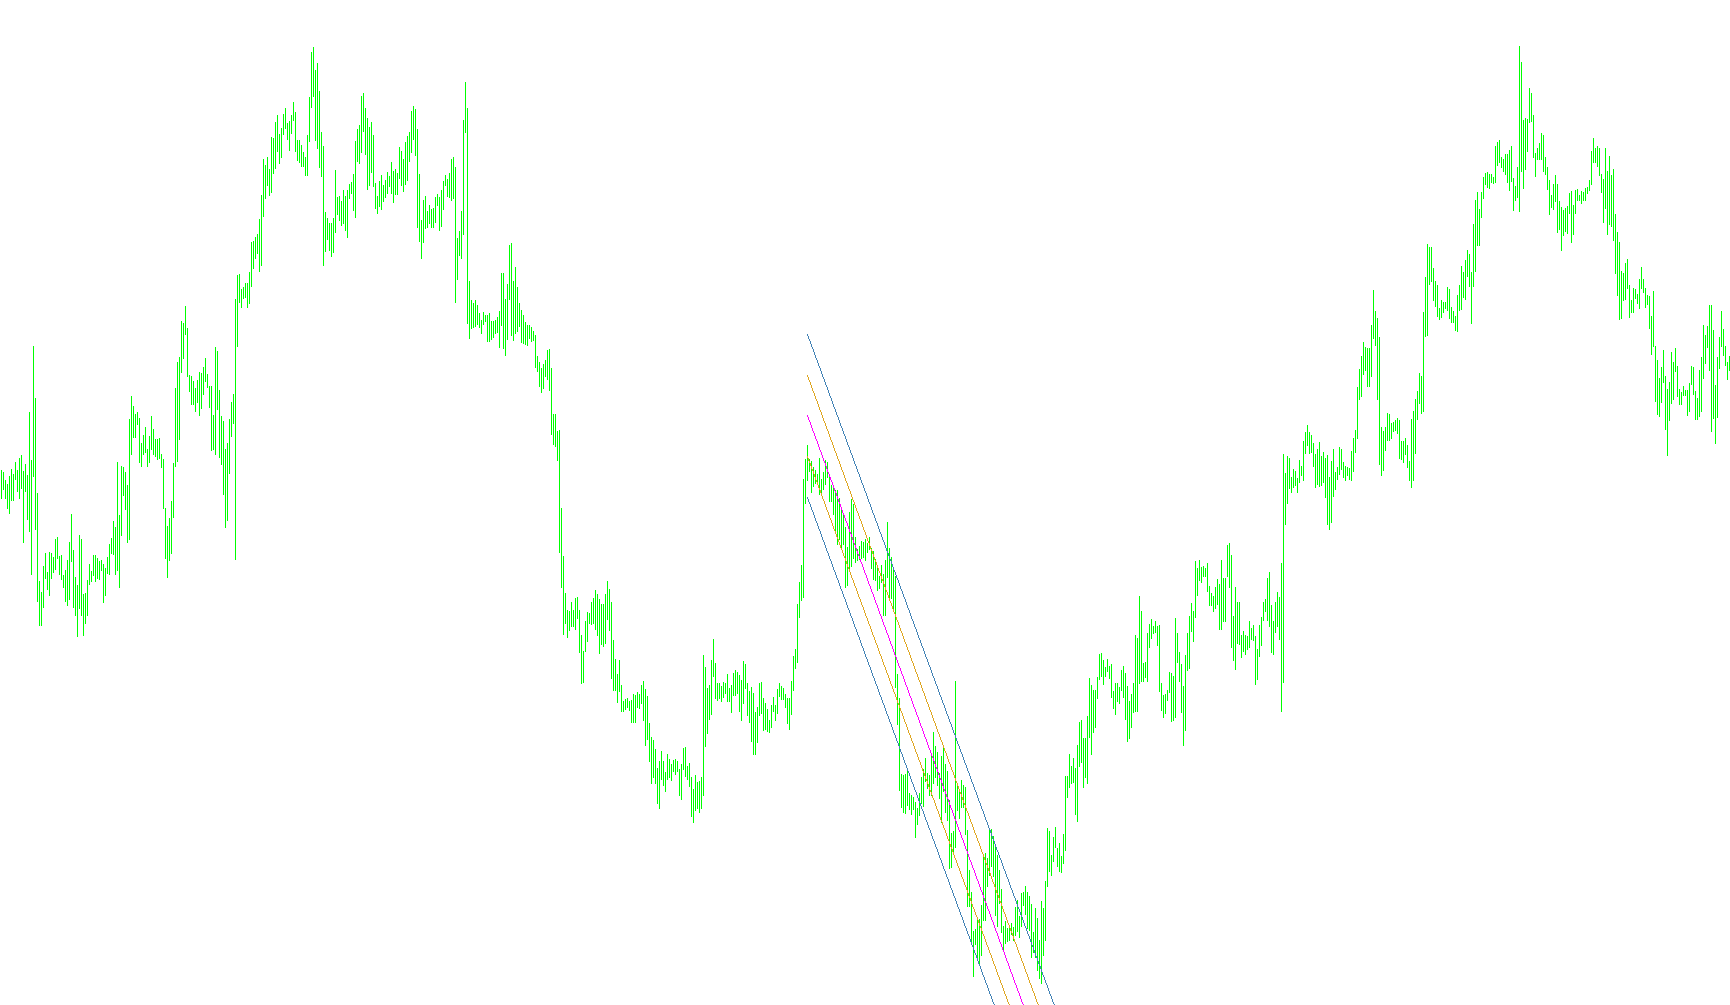
This indicator dynamically constructs a linear regression model based on extreme price excursions from a moving average to define volatility bands using multiple standard deviation thresholds.

Regression_Channel_V2_v1
Indicator

Regression_Channel_V2_v1

iMA

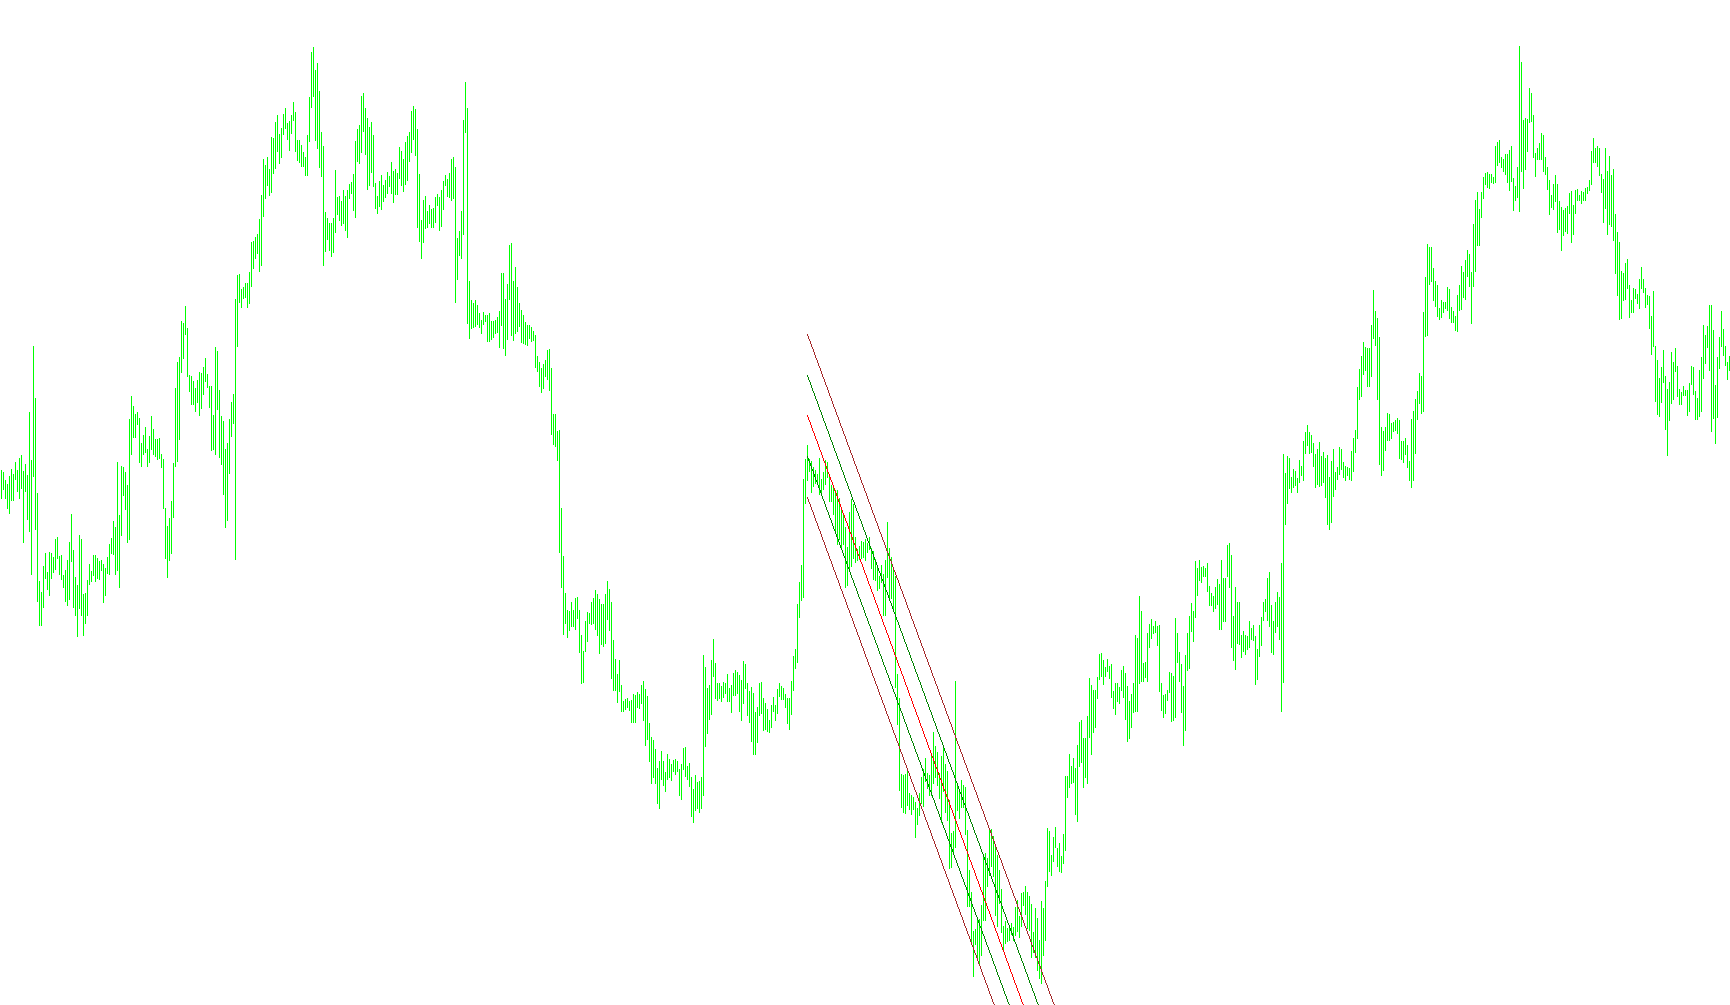
This indicator identifies price extremes by projecting a linear regression channel based on specific moving average crossovers, utilizing dual standard deviation boundaries to define inner and outer volatility zones.

Regression_Channel_V2_v2
Indicator

Regression_Channel_V2_v2

iMA

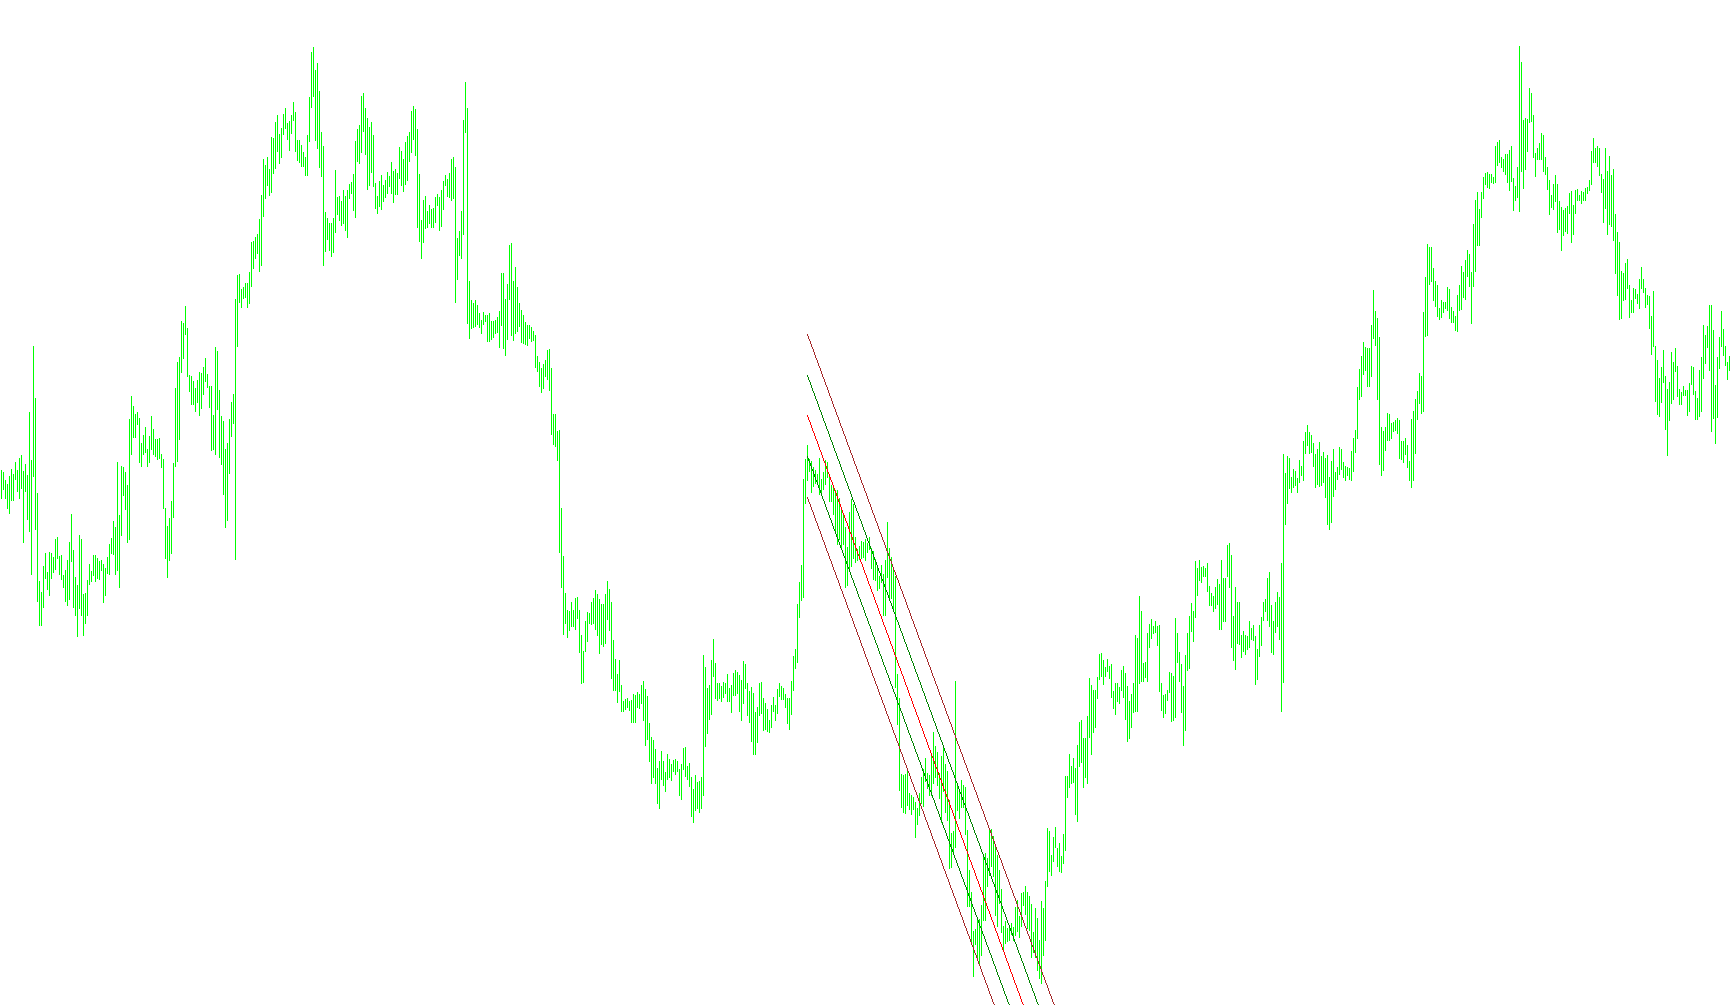
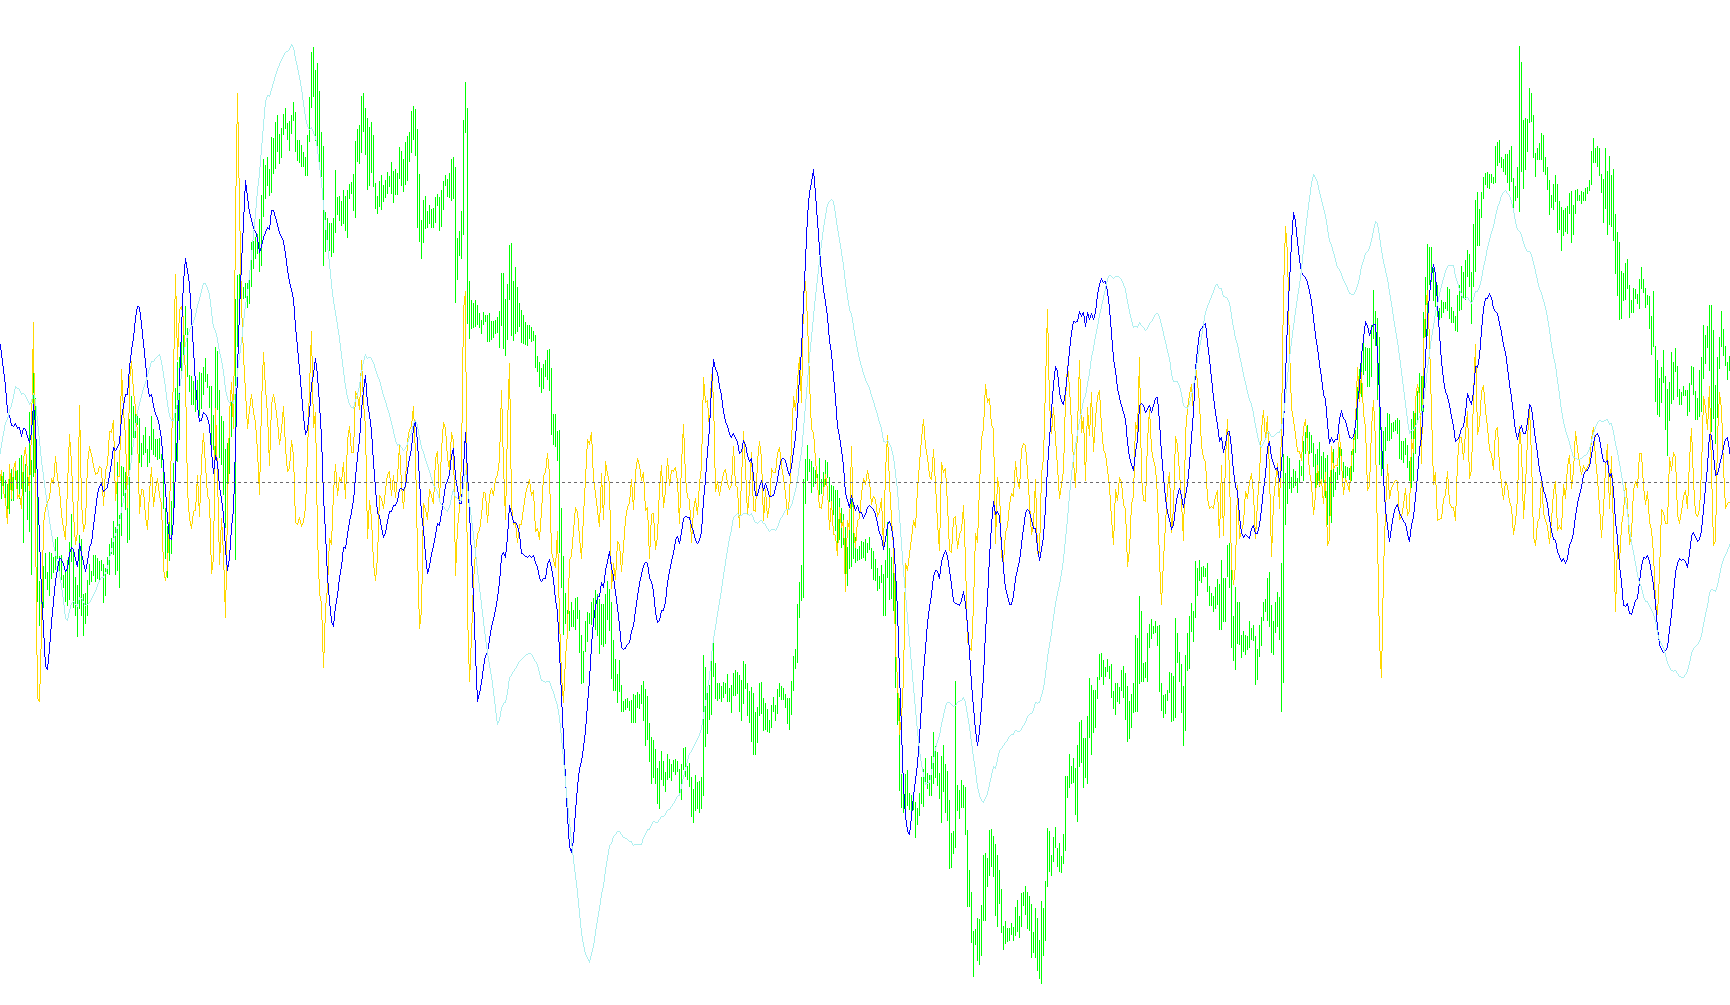
This indicator dynamically calculates a linear regression channel by identifying price extremes relative to a moving average and projecting multiple volatility bands using dual standard deviation coefficients.

Regression_Channel_V2_v3
Indicator

Regression_Channel_V2_v3

iMA

This indicator calculates a linear regression line based on price extremes to establish a multi-layered volatility corridor using dual standard deviation bands.

Regular RSI Div
Indicator

Regular RSI Div

iMAiMAOnArrayiRSI

This indicator identifies structural market reversals by detecting geometric discrepancies between price action extremes and weighted RSI-based momentum oscillations.

REI
Indicator

REI

This indicator calculates a normalized ratio between selective price range shifts and absolute high-low fluctuations to quantify structural momentum.

REIMT4
Indicator

REIMT4

This indicator calculates a momentum-based sentiment ratio by comparing the sum of price fluctuations against their absolute magnitudes over a rolling period.

Relative Vigor Index
Indicator

Relative Vigor Index

This indicator quantifies market strength by calculating a weighted ratio of average price action movements relative to the historical volatility range.

Relax_GoToSleep_v01
Indicator

Relax_GoToSleep_v01

iMAOnArray

This indicator generates non-deterministic price noise and synthetic trend overlays by blending randomized offsets with smoothed linear weights and oscillating arrow signals.

Relax_GoToSleep_v01_play2_sw
Indicator

Relax_GoToSleep_v01_play2_sw

iMAOnArray

The logic computes a moving average over a randomized price displacement series to identify trend reversals based on percentage variance between successive lags.

RelDownTrLen_forCodeBase_v01
Indicator

RelDownTrLen_forCodeBase_v01

This indicator calculates the relative proportion of the longest bearish trajectory by identifying the lower boundary of a convex hull across a specified candle range.

RelUpTrLen_forCodeBase_v01
Indicator

RelUpTrLen_forCodeBase_v01

This indicator calculates the relative strength of a bullish trend by identifying the longest ascending segment within a convex hull of price minima.

RenkoFX
Indicator

RenkoFX

This indicator reconstructs price action into fixed-size price blocks to isolate trend momentum and filter out market noise.

RenkoLiveChart_v2.3INDI
Indicator

RenkoLiveChart_v2.3INDI

This MetaTrader EA generates a Renko chart history file and dynamically updates it in real-time, creating offline Renko charts based on a specified box size and timeframe.

RenkoLiveChart_v3.0
Indicator

RenkoLiveChart_v3.0

This algorithm reconstructs price action into discrete, fixed-size bricks by filtering out minor volatility and logging synthetic candlestick data to an external history file.

RENKO_2
Indicator

RENKO_2

This indicator transforms standard price action into a synthetic Renko brick structure by calculating fixed-point price movements to isolate trend momentum from market noise.

RENKO_MultyBox
Indicator

RENKO_MultyBox

This indicator concurrently calculates and visualizes price action across five distinct Renko brick sizes to identify multi-layered trend reversals and momentum shifts.

Renko_v1
Indicator

Renko_v1

This indicator filters price noise by constructing discrete price bricks based on the Average True Range to identify structural momentum shifts.

Renko_v1_v1
Indicator

Renko_v1_v1

This algorithm filters market noise by constructing synthetic price blocks based on average true range volatility to isolate sustained directional movements.

Renko_v1_v2
Indicator

Renko_v1_v2

This indicator filters market noise by constructing price bricks based on Average True Range fluctuations to identify directional momentum independently of time intervals.

Report
Indicator

Report

This script extracts historical trade data to generate a formatted HTML statement featuring comprehensive performance metrics including drawdown, profit factors, and consecutive win/loss sequences.

Report1
Indicator

Report1

This script parses historical trading data to generate a formatted HTML report featuring comprehensive performance metrics like drawdown, profit factor, and consecutive win/loss streaks.

Indicator

report_into_chart V2

Report_v5
Indicator

Report_v5

This script extracts historical order data to generate a comprehensive HTML report featuring trade summaries, performance metrics, and risk statistics.

repulse
Indicator

repulse

iMAOnArray

The indicator quantifies the differential between bullish and bearish pressure by calculating exponential moving averages of price action extremes across three distinct temporal horizons.

repulse1.1
Indicator

repulse1.1

iMAOnArray

This indicator calculates the net force between bullish and bearish pressure by computing weighted price action differentials across three distinct time horizons and smoothing them with exponential moving averages.

Indicator

repulse1.1_mtf

iMAOnArray
RES-SUP
Indicator

RES-SUP

iATR

This indicator identifies key support and resistance levels by calculating the arithmetic mean of previous daily candles and projecting Fibonacci retracement offsets.

RES-SUP_v1
Indicator

RES-SUP_v1

iATR

The indicator identifies primary support and resistance levels by calculating the geometric mean of previous daily price action adjusted by Fibonacci retracement ratios.

Research Indicator
Indicator

Research Indicator

This tool quantifies historical price action by tallying consecutive candle color inversions to identify frequent shifts between bullish and bearish momentum.

returns
Indicator

returns

iMAOnArray

This indicator calculates normalized price returns relative to extreme high and low boundaries across three distinct timeframe horizons, smoothed via moving averages.

RFractals
Indicator

RFractals

This indicator identifies local price extrema by scanning a user-defined neighborhood to locate peaks and troughs where the central point exceeds all surrounding price points.

RFTL
Indicator

RFTL

The logic utilizes a fixed-coefficient polynomial summation across a 45-period lookback window to derive a smoothed price trajectory.

RFTL_v1
Indicator

RFTL_v1

This indicator calculates a custom price smoothing line by applying a fixed 44-period array of pre-defined numerical weights to historical closing prices.

RFTL_v2
Indicator

RFTL_v2

This indicator calculates a complex weighted moving average by applying 45 distinct coefficients to historical closing prices to identify underlying price trends.

RFTL_v3
Indicator

RFTL_v3

This indicator calculates a specific price momentum value by applying a hardcoded, non-adaptive coefficient array to a rolling 44-period lookback of closing prices.

Indicator

RIDI_LEVELS_MT4

risk
Indicator

risk

The script calculates real-time exposure by comparing current open positions against a percentage-based risk model of the account balance to determine permissible additional volume.

RiskAdvisor
Indicator

RiskAdvisor

Calculates optimal position sizing and stop-loss adjustments by evaluating real-time account margin, reserved capital for open trades, and defined percentage risk limits.

RiskReward Ratio v0.1
Indicator

RiskReward Ratio v0.1

This tool calculates and visualizes the mathematical relationship between entry price, stop-loss distance, and take-profit targets in real-time.

RiskReward Ratio
Indicator

RiskReward Ratio

Calculates the real-time ratio between potential profit and risk by measuring the distance between horizontal price anchors relative to the current bid.

RK_MindHero mail
Indicator

RK_MindHero mail

iATR

This indicator identifies trend reversals by calculating a weighted True Range volatility threshold to detect breakouts from price extremes.

RMI(L)
Indicator

RMI(L)

This indicator calculates price momentum by measuring the relative change in closing prices over varying timeframes to identify overbought and oversold conditions.

RMI
Indicator

RMI

This indicator quantifies the ratio of positive price velocity against negative price velocity over a specified period to identify momentum imbalance.

Robby DSS Bressert Colored with alert v1.1
Indicator

Robby DSS Bressert Colored with alert v1.1

This indicator calculates a recursive momentum value based on price range positioning and applies a second layer of stochastic smoothing to identify trend shifts and directional velocity.

Indicator

Robby Dss Bressert Colored with alertv1.1[mtf]

ROC
Indicator

ROC

This indicator quantifies the absolute or relative price variance between the current market close and a historical anchor point defined by a fixed period offset.
ROC1
Indicator

ROC1

Quantifies the absolute or proportional price delta between the current close and a historical point to measure immediate directional velocity.

ROC1_v1
Indicator

ROC1_v1

Measures the absolute price delta between current and historical closes to quantify acceleration or deceleration in market movement.