RD-PivotLines_v2
Download script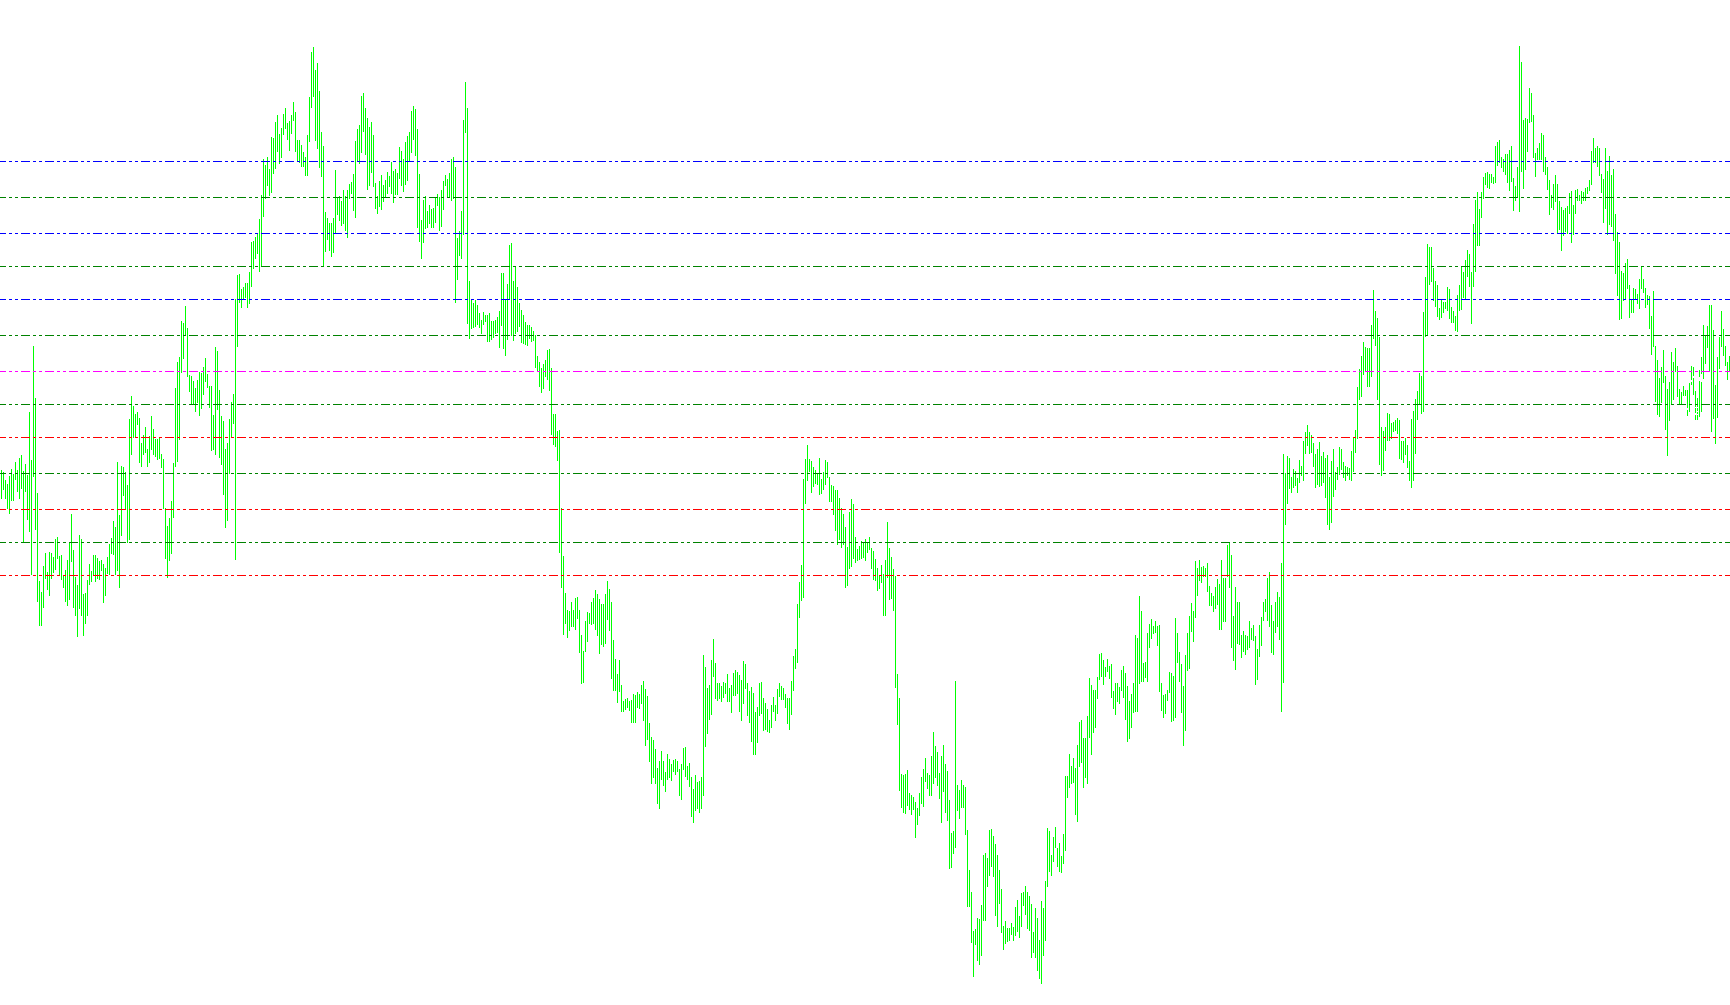
This tool is designed to provide traders with a visual roadmap of key price levels on their trading charts. By analyzing historical price data from previous sessions, it automatically calculates and plots several significant technical markers that help identify potential areas of support and resistance.
Core Functionality
The script operates by looking at the "Daily" performance of a currency or asset. It captures specific data points from yesterday—specifically the opening, closing, highest, and lowest prices—and uses these values to project levels for the current trading day.
The logic is broken down into three primary visual components that can be toggled on or off:
1. Standard Pivot Points These are the most common technical levels used by traders to gauge market sentiment. The script calculates a central "Pivot" (P) based on yesterday's average range. From this center, it projects:
- Resistance Levels (R1, R2, R3): These indicate potential price ceilings where selling pressure might increase.
- Support Levels (S1, S2, S3): These indicate potential price floors where buying interest may strengthen.
2. Camarilla Levels This is a specialized calculation often used by day traders to identify breakout points and reversal zones. The script calculates four specific lines:
- High/Low Boundaries (H3, H4 and L3, L4): These are calculated using a specific percentage of yesterday's range relative to yesterday's closing price. They are often viewed as "breakout" levels; if the price moves beyond these boundaries, it may signal a significant shift in trend.
3. Midpoint Pivots To provide a more granular view of the market, the script can display intermediate zones between the major Pivot levels. These are calculated as the mathematical averages between primary resistance and support lines (e.g., M1 through M5). These help traders identify "sub-zones" where price might stall or consolidate before making a larger move.
User Experience Features
- Automated Visuals: The script automatically draws horizontal lines and text labels on the chart, removing the need for manual calculation.
- Dynamic Updates: Because it pulls data from the daily timeframe, the levels automatically adjust as new daily candles form.
- On-Screen Dashboard: In addition to the lines, the script displays a "Good Morning" greeting and a real-time summary in the corner of the chart, showing yesterday's high/low, today's current range, and the previous day's total volatility.
- Safety Check: The tool includes a built-in check to ensure it is being used on a timeframe appropriate for daily calculations (i.e., it will notify you if you try to run it on a chart period longer than one day).
/*-----------------------------+
|			       |
| Shared by www.Aptrafx.com    |
|			       |
+------------------------------*/

//+------------------------------------------------------------------+
//|                                                        Pivot.mq4 |
//|                      Copyright © 2004, MetaQuotes Software Corp. |
//|                                        http://www.metaquotes.net |
//+------------------------------------------------------------------+
#property copyright "Copyright © 2004, MetaQuotes Software Corp."
#property link      "http://www.metaquotes.net"

#property indicator_chart_window

extern bool pivots = true;
extern bool camarilla = False;
extern bool midpivots = true;

double day_high=0;
double day_low=0;
double yesterday_high=0;
double yesterday_open=0;
double yesterday_low=0;
double yesterday_close=0;
double today_open=0;
double today_high=0;
double today_low=0;
double P=0;
double Q=0;
double R1,R2,R3;
double M0,M1,M2,M3,M4,M5;
double S1,S2,S3;
double H4,H3,L4,L3;
double nQ=0;
double nD=0;
double D=0;
double rates_d1[2][6];

//+------------------------------------------------------------------+
//| Custom indicator initialization function                         |
//+------------------------------------------------------------------+
int init()
{
   //---- indicators
    R1=0; R2=0; R3=0;
    M0=0; M1=0; M2=0; M3=0; M4=0; M5=0;
    S1=0; S2=0; S3=0;
    H4=0; H3=0; L4=0; L3=0;

   //----
   return(0);
}


//+------------------------------------------------------------------+
//| Custor indicator deinitialization function                       |
//+------------------------------------------------------------------+
int deinit()
{
   ObjectDelete("R1 Label");
   ObjectDelete("R1 Line");
   ObjectDelete("R2 Label");
   ObjectDelete("R2 Line");
   ObjectDelete("R3 Label");
   ObjectDelete("R3 Line");
   ObjectDelete("S1 Label");
   ObjectDelete("S1 Line");
   ObjectDelete("S2 Label");
   ObjectDelete("S2 Line");
   ObjectDelete("S3 Label");
   ObjectDelete("S3 Line");
   ObjectDelete("P Label");
   ObjectDelete("P Line");
   ObjectDelete("H4 Label");
   ObjectDelete("H4 Line");
   ObjectDelete("H3 Label");
   ObjectDelete("H3 Line");
   ObjectDelete("L3 Label");
   ObjectDelete("L3 Line");
   ObjectDelete("L4 Label");
   ObjectDelete("L4 Line");
   ObjectDelete("M5 Label");
   ObjectDelete("M5 Line");
   ObjectDelete("M4 Label");
   ObjectDelete("M4 Line");
   ObjectDelete("M3 Label");
   ObjectDelete("M3 Line");
   ObjectDelete("M2 Label");
   ObjectDelete("M2 Line");
   ObjectDelete("M1 Label");
   ObjectDelete("M1 Line");
   ObjectDelete("M0 Label");
   ObjectDelete("M0 Line");

   return(0);
}

//+------------------------------------------------------------------+
//| Custom indicator iteration function                              |
//+------------------------------------------------------------------+
int start()
{
   //---- exit if period is greater than daily charts
   if(Period() > 1440)
   {
      Print("Error - Chart period is greater than 1 day.");
      return(-1); // then exit
   }

   //---- Get new daily prices

   ArrayCopyRates(rates_d1, Symbol(), PERIOD_D1);

   yesterday_close = rates_d1[1][4];
   yesterday_open = rates_d1[1][1];
   today_open = rates_d1[0][1];
   yesterday_high = rates_d1[1][3];
   yesterday_low = rates_d1[1][2];
   day_high = rates_d1[0][3];
   day_low = rates_d1[0][2];


   //---- Calculate Pivots

   D = (day_high - day_low);
   Q = (yesterday_high - yesterday_low);
   P = (yesterday_high + yesterday_low + yesterday_close) / 3;

   R1 = (2*P)-yesterday_low;
   S1 = (2*P)-yesterday_high;
   R2 = P+(yesterday_high - yesterday_low);
   S2 = P-(yesterday_high - yesterday_low);

	H4 = (Q*0.55)+yesterday_close;
	H3 = (Q*0.27)+yesterday_close;
	R3 = (2*P)+(yesterday_high-(2*yesterday_low));
	M5 = (R2+R3)/2;
//	R2 = P-S1+R1;
	M4 = (R1+R2)/2;
//	R1 = (2*P)-yesterday_low;
	M3 = (P+R1)/2;
//	P = (yesterday_high + yesterday_low + yesterday_close)/3;
	M2 = (P+S1)/2;
//	S1 = (2*P)-yesterday_high;
	M1 = (S1+S2)/2;
//	S2 = P-R1+S1;
	S3 = (2*P)-((2* yesterday_high)-yesterday_low);
	L3 = yesterday_close-(Q*0.27);
	L4 = yesterday_close-(Q*0.55);
	M0 = (S2+S3)/2;

   if (Q > 5) { nQ = Q; }
   else { nQ = Q*10000; }

   if (D > 5) { nD = D; }
   else { nD = D*10000; }


   Comment("Yesterdays High= ",yesterday_high, "  Todays=  ",day_high, "    Previous Days Range= ",nQ,"\n",
           "Yesterdays Low=  ",yesterday_low,  "  Todays=  ",day_low,  "    Current Days Range= ",nD,"\n",
           "Close= ",yesterday_close, "    Good Morning, Good Luck Trading RICKY Ds System!");

   //---- Set line labels on chart window

   //---- Pivot Lines
   if (pivots==true) {
      SetLevel("R1", R1, Blue);
      SetLevel("R2", R2, Blue);
      SetLevel("R3", R3, Blue);

      SetLevel("Pivot", P, Magenta);

      SetLevel("S1", S1, Red);
      SetLevel("S2", S2, Red);
      SetLevel("S3", S3, Red);
   }


   //----- Camarilla Lines
   if (camarilla==true) {
      SetLevel("H3", H3, Yellow);
      SetLevel("H4", H4, Yellow);

      SetLevel("L3", L3, Yellow);
      SetLevel("L4", L4, Yellow);
   }


   //------ Midpoints Pivots
   if (midpivots==true) {
      SetLevel("M5", M5, Green);
      SetLevel("M4", M4, Green);
      SetLevel("M3", M3, Green);
      SetLevel("M2", M2, Green);
      SetLevel("M1", M1, Green);
      SetLevel("M0", M0, Green);
   }


   return(0);
}


//+------------------------------------------------------------------+
//| Helper                                                           |
//+------------------------------------------------------------------+
void SetLevel(string text, double level, color col1)
{
   string labelname= text + " Label";
   string linename= text + " Line";

   if (ObjectFind(labelname) != 0) {
      ObjectCreate(labelname, OBJ_TEXT, 0, Time[20], level);
      ObjectSetText(labelname, " " + text, 8, "Arial", White);
   }
   else {
      ObjectMove(labelname, 0, Time[20], level);
   }

   if (ObjectFind(linename) != 0) {
      ObjectCreate(linename, OBJ_HLINE, 0, Time[40], level);
      ObjectSet(linename, OBJPROP_STYLE, STYLE_DASHDOTDOT);
      ObjectSet(linename, OBJPROP_COLOR, col1);
   }
   else {
      ObjectMove(linename, 0, Time[40], level);
   }
}
Comments